
Introduction
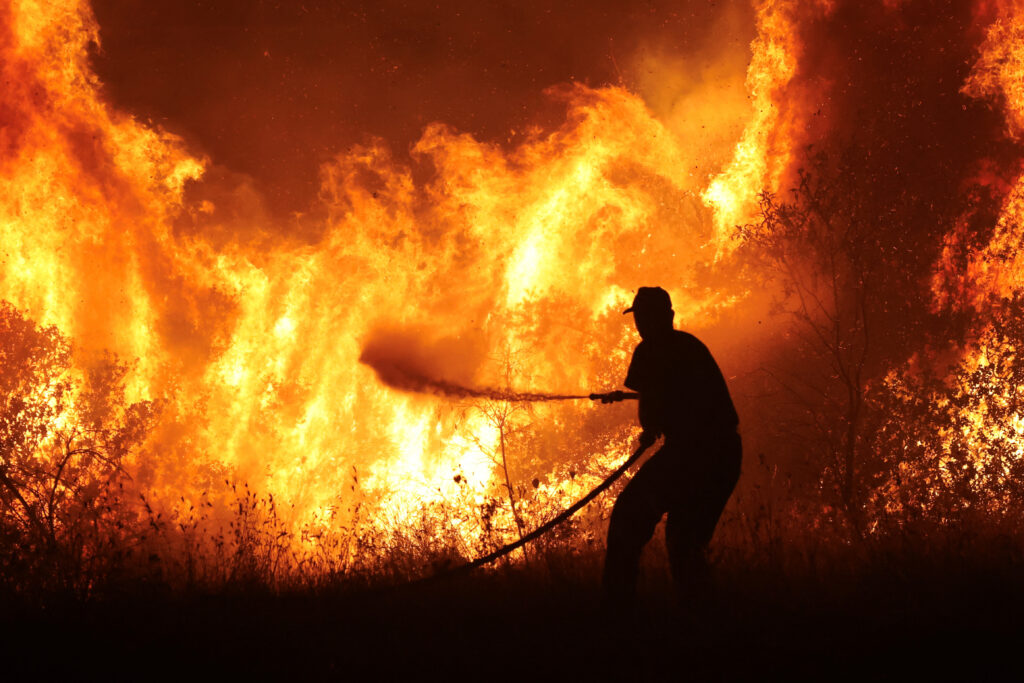
Greece’s scorching summers and dry climate create a perfect storm for wildfires. These fires cause widespread devastation, burning homes and harming ecosystems, with tragic consequences like loss of life.
While the climate undoubtedly sets the stage, many in Greece believe human activity is the real culprit. Accidental fires from carelessness or deliberate acts of arson are suspected causes for a large portion of wildfires, sparking a heated debate.
The unresolved case of the 2023 Evros wildfire, where some point fingers at immigrants, exemplifies this controversy. The question remains: are wildfires simply a natural disaster or are human actions playing a significant role in their ignition?
Method
Fire Statistics
The analysis began with calculating descriptive statistics for burned areas across various regions, land cover types, and time frames. This involved:
- Central Tendency: Measures like mean (average) and median were used to identify regions with the highest average fire damage and assess potential imbalances (skewness) in the data.
- Spread: Standard deviation was calculated to quantify the variation of burned areas from the average.
- Extremes: Minimum and maximum values were determined to pinpoint any exceptionally large or small fire events.
Mapping Relationships
The statistical findings were complemented by a spatial analysis. To assess the proximity of burned areas to infrastructure such as buildings and roads.
Finally, regression and correlation analyses were conducted to explore potential relationships between the size of burned areas and factors like distance to infrastructure and temperature conditions.
Data Used in the Analysis
Various datasets were used to understand fire patterns in Greece. They include the following :
- Greece by District Polygon
- Burned area in Greece from 2022 – 2002 (CSV)
- Greece Wildfire Polygons from 2022 – 2002
- Temperature Data 2002 – 2022 (CSV)
- Greek Capital Cities Points
- Greek Settlement Points
The raw data was processed and merged to create three key DataFrames used in the analysis :

Statistical Analysis
Central Tendency
The mean and the median graphs showed significantly different data distribution patterns. The average fire frequency indicated a spike in the Peloponnese, Western Greece, and the Ionian Islands in 2007, and the median value, which reflects a more typical scenario, did not show the same pattern.
Land Cover and Fire Occurrence
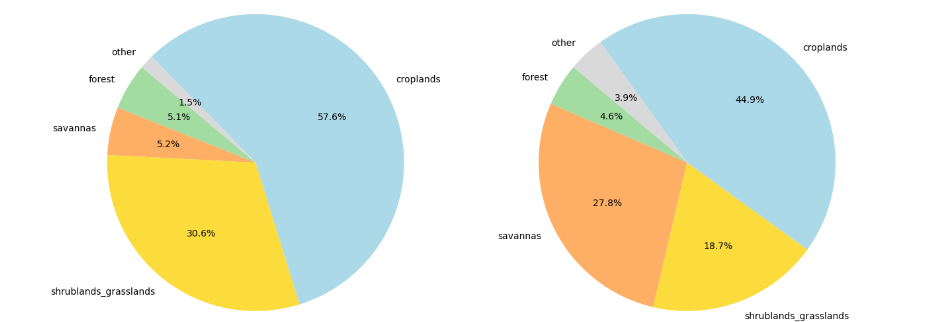
A pie chart analysis revealed croplands as the most frequent location for wildfires across the entire 20-year timeframe (2002-2022). While this could be coincidental, it warrants further investigation into the potential link between human activity and fire occurrence in these areas.
Fire Size Variation
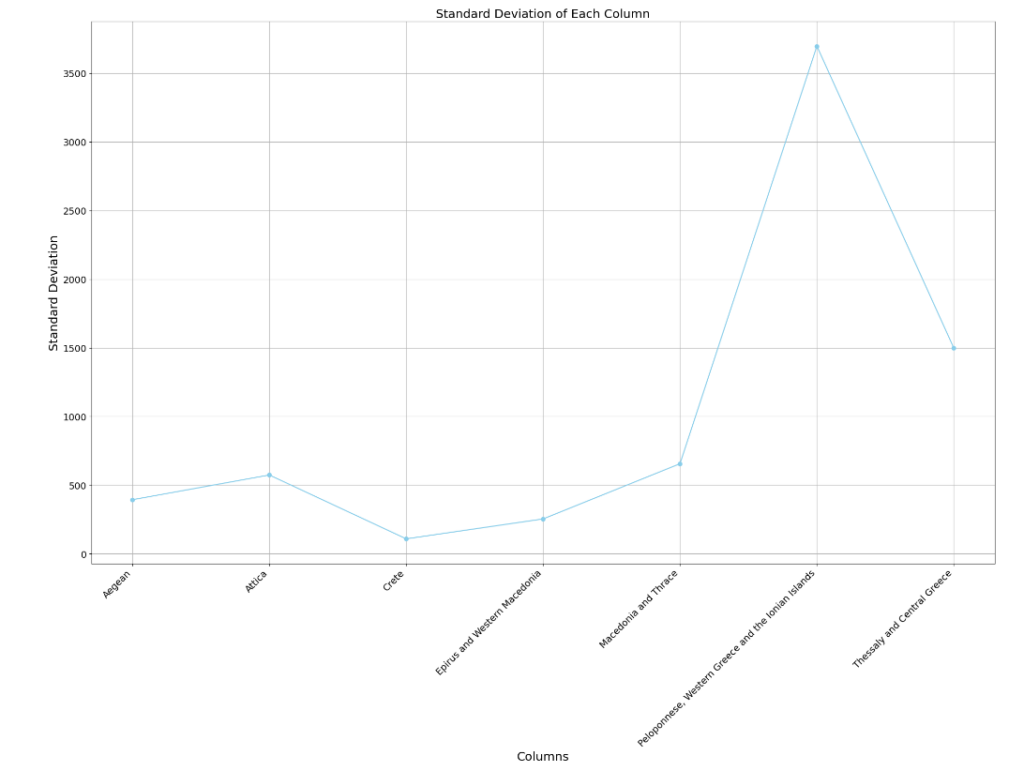
Standard deviation analysis highlighted significant variations in fire size. This suggests diverse factors might influence fire behavior, with some blazes becoming much larger or smaller than others.
Identifying Outliers
An analysis of data range revealed a maximum value that stood out considerably from the rest, indicating a potential outlier. A scatter plot graph of the distribution of hectares burnt per year confirms that that the outliers are fire occurrences in the Peloponnese, Western Greece, and the Ionian Islands regions.
After the outliers were identified, they were removed from the sample to ensure a more consistent result.
Spatial Analysis
Proximity to Human Settlement
The center of the plot, roughly corresponding to the Thessaly and Central Greece region, shows a high concentration of both wildfires (represented by orange points) and human settlements (depicted by blue points). This spatial distribution suggests a potential link between human presence and fire occurrence in this area.
In addition, the visualization utilizes lines in grayscale to depict the distance between wildfires (starting points) and settlements (end points). Darker lines indicate a closer proximity, while lighter lines represent a greater distance.
Linear Regression
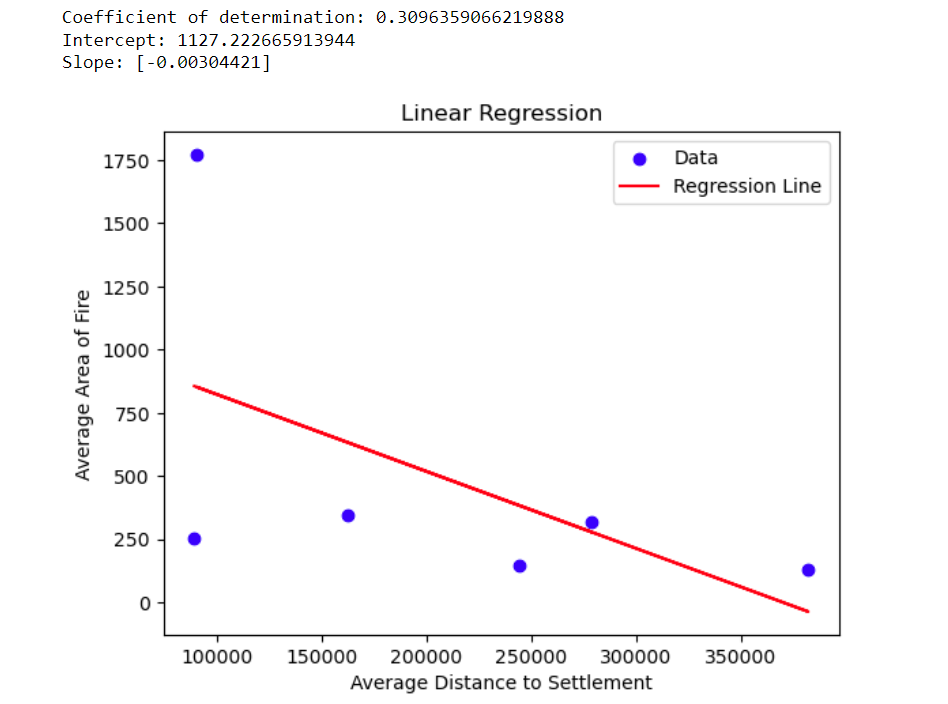
The analysis reveals that there’s an inverse relationship between the average size and distance of fires from human settlements. This means as the average distance between fires and settlements increases (X), the average size of the fires decreases (Y).
The coefficient of determination (r-squared) indicates a moderately strong connection between fire size and distance to settlements. While there’s a relationship, it’s not perfect, suggesting other factors might also influence fire size.
However, it leaves us with a crucial question: How does fire size correlate with temperature under normal conditions (without considering distance)?
Correlation Analysis
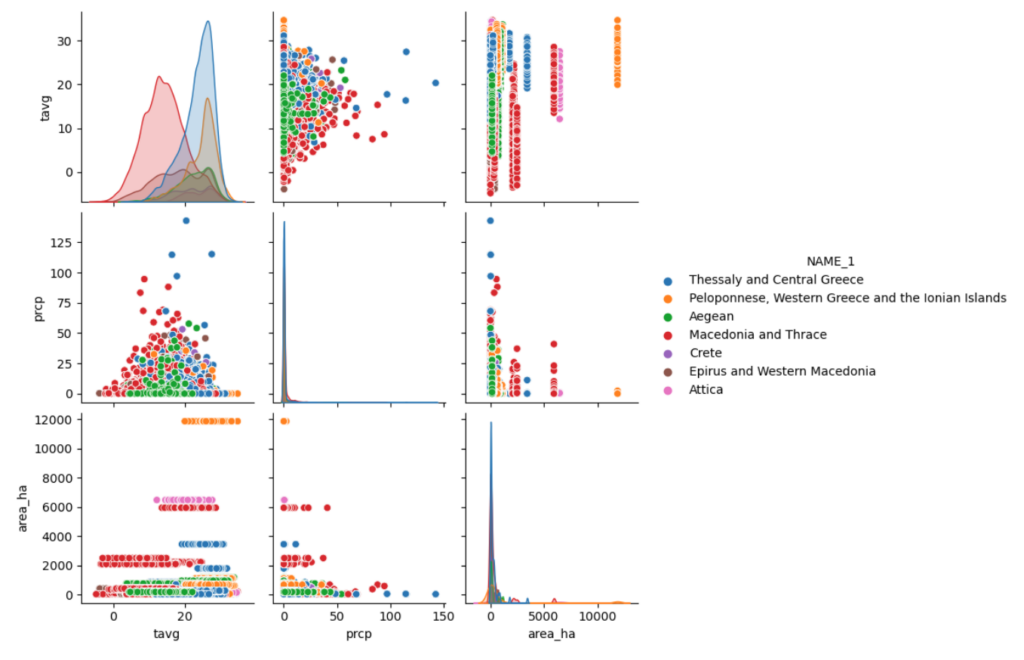
The correlation graphs indicate that areas with higher precipitation tend to experience fewer wildfires. This makes sense, as rain helps keep vegetation moist and less susceptible to burning. Interestingly, a significant number of fires also occur even when temperatures seem to be within normal ranges. This suggests that other factors, besides just temperature, might play a role in fire ignition and spread.
Conclusion
Examining Thessaly and Central Greece, it seems likely that humans play a major role in wildfires. However, the regression analysis presents a different perspective. The correlation with temperature also suggests a significant connection of wildfires to low precipitation.
Therefore in further study, it will be important to analyze weather patterns (temperature, precipitation, wind) during years with the highest fire medians (2005, 2007, 2008, 2011, 2012, 2013, 2015) within the Thessaly and Central Greece region. This is important to identify identify potential triggers related to climatic conditions.
Data Sources
- Global Wildfire Information System ( GWIS )
- Greece Open Data
