As the program team, we were responsible for defining how space is distributed and used across the building, translating regulations and density targets into a balanced mix of residential, public, and supporting functions. Within the hyperbuilding concept, we design the ‘functional cells’—the spaces where life happens—ensuring they are efficient, adaptable, and well-connected..
A Data-Driven, Human-Centric Approach
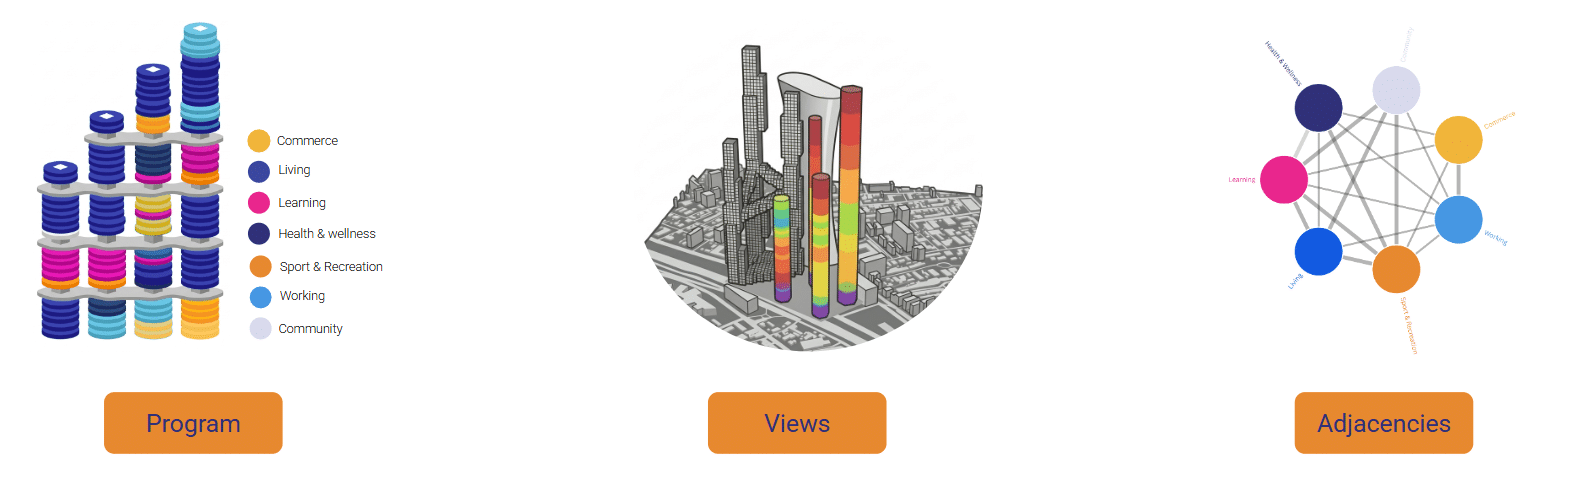
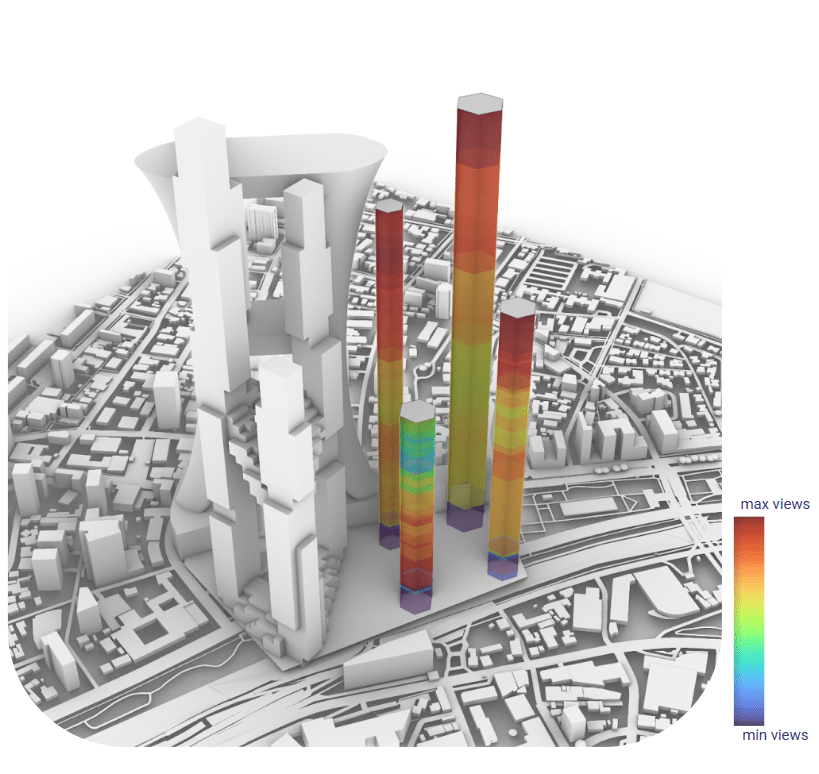
The organizational logic behind Hyperbuilding 03 is rooted in data, but always oriented toward the human experience. Three core principles guide the process: Programmatic Stacking layers different functions vertically to create a true 24/7 internal ecosystem, where residents never need to leave the building to meet their daily needs. View Analysis maps visual performance across every floor, from minimum to maximum, identifying high-value zones where quality of life — and therefore program value — is greatest. Adjacency Logic takes those findings a step further. Rather than placing programs arbitrarily, the team’s connectivity matrix is directly informed by the view analysis, clustering social programs in high-visibility areas to maximize both human comfort and urban impact. Together, these three principles transform a static tower into a high-performance vertical neighborhood.
Balancing the Mix
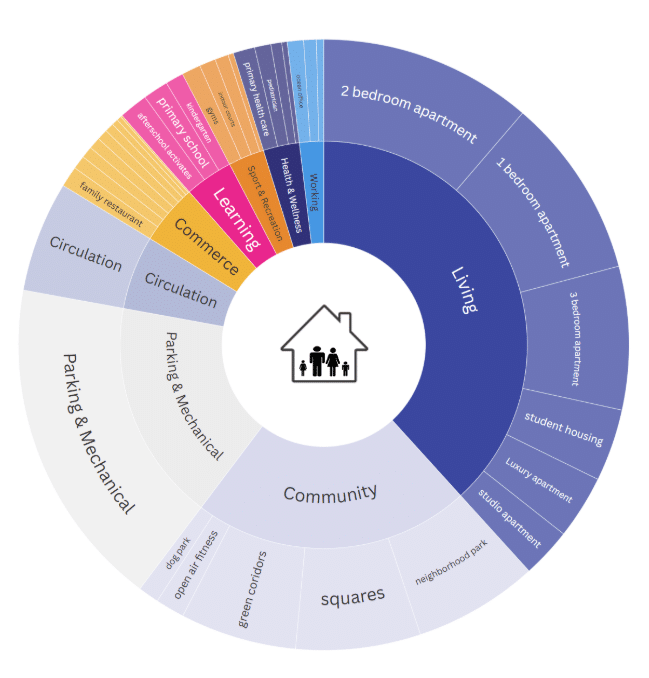
To ensure a truly functional ecosystem, the team arrived at a carefully considered program breakdown. Residential space accounts for 40% of the building, while public space takes up 23% — together forming the primary living tissue of the tower. This is supported by 12% dedicated to essential services such as education and wellness, and 25% allocated to infrastructure. Far from arbitrary, this balance is what allows Hyperbuilding 03 to function as a self-sustaining vertical community.
Benchmarking Against the World
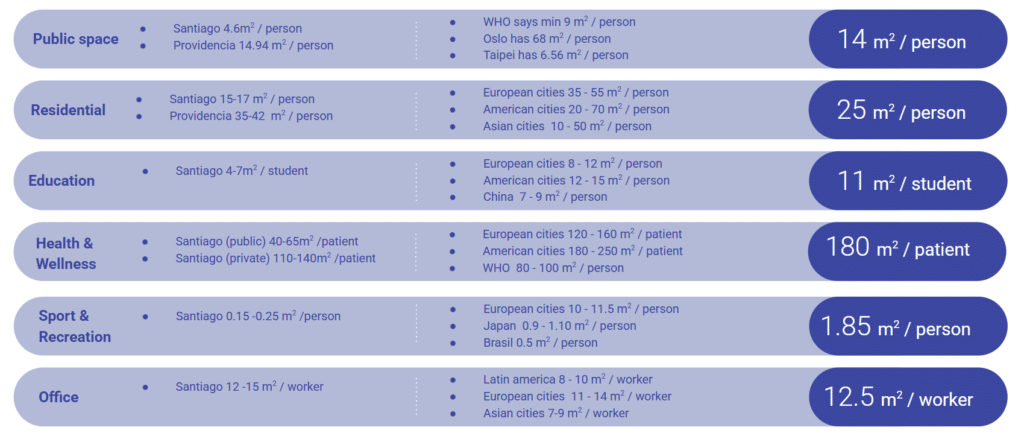
These numbers did not emerge from intuition alone. The team benchmarked Santiago against global standards, comparing local data to WHO guidelines and drawing lessons from high-performing cities. The shift in mindset was deliberate: moving from bare minimums to genuine quality of life. While the local average for public space per person falls short of international benchmarks, Hyperbuilding 03 targets 14 square meters per person — enough room to actually breathe. These percentages are not just about floor area; they are about meeting global health standards for a better way to live.
Being a Good Neighbor
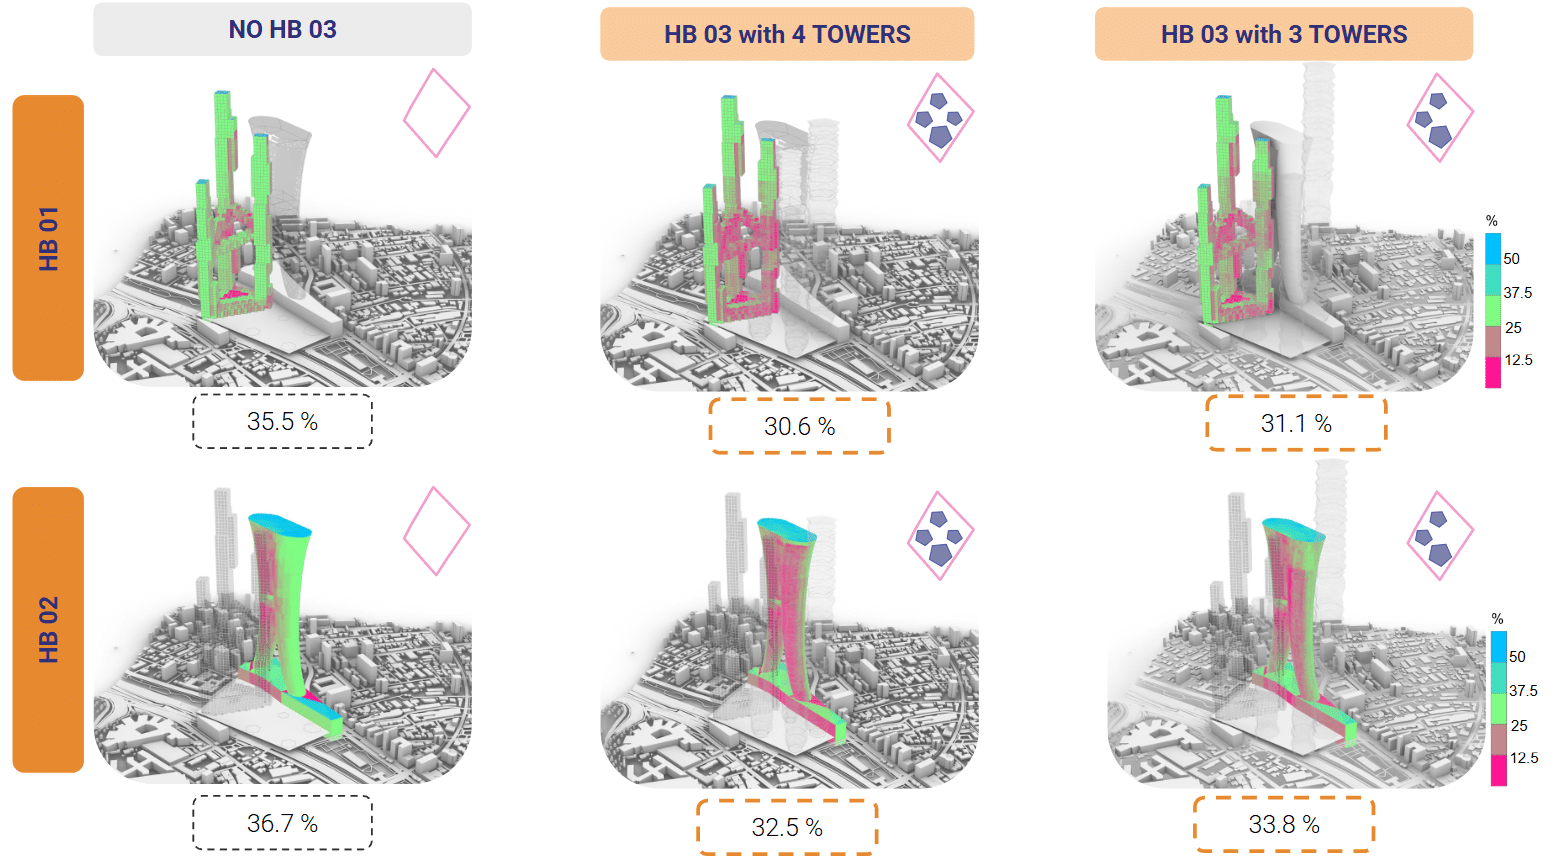
One of the more nuanced design challenges was ensuring that Hyperbuilding 03 does not compromise the quality of life for its neighbors, HB 01 and HB 02. The team measured the building’s impact on the existing visual field of both towers across two design iterations — a four-tower and a three-tower configuration.
The results were encouraging. In the three-tower scenario, HB 01 experiences only a 4.4% reduction in views, while HB 02 sees an even smaller impact of just 2.9%. By optimizing tower footprints and vertical spacing, the design maintains over 31–33% view clarity for neighboring buildings — well below the 5% impact threshold the team set as its standard. The entire cluster is designed to thrive together, not compete.
How the View Analysis Works
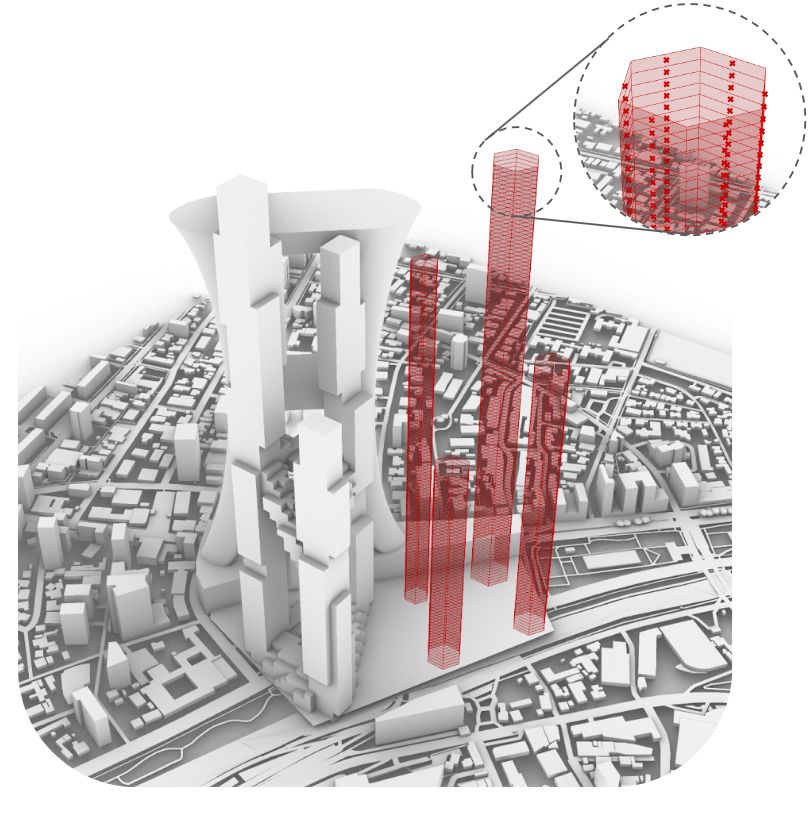
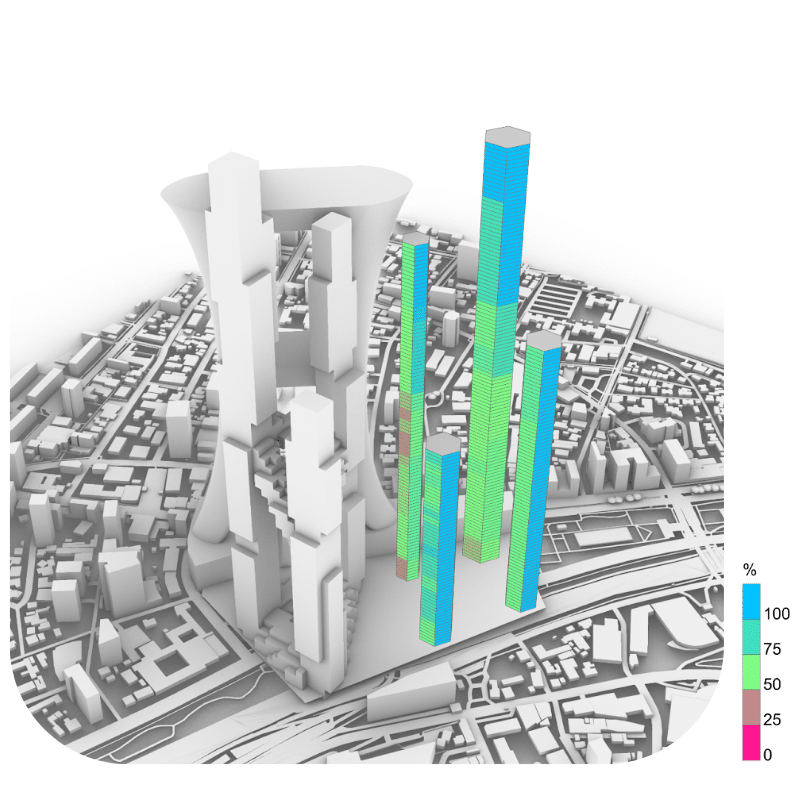
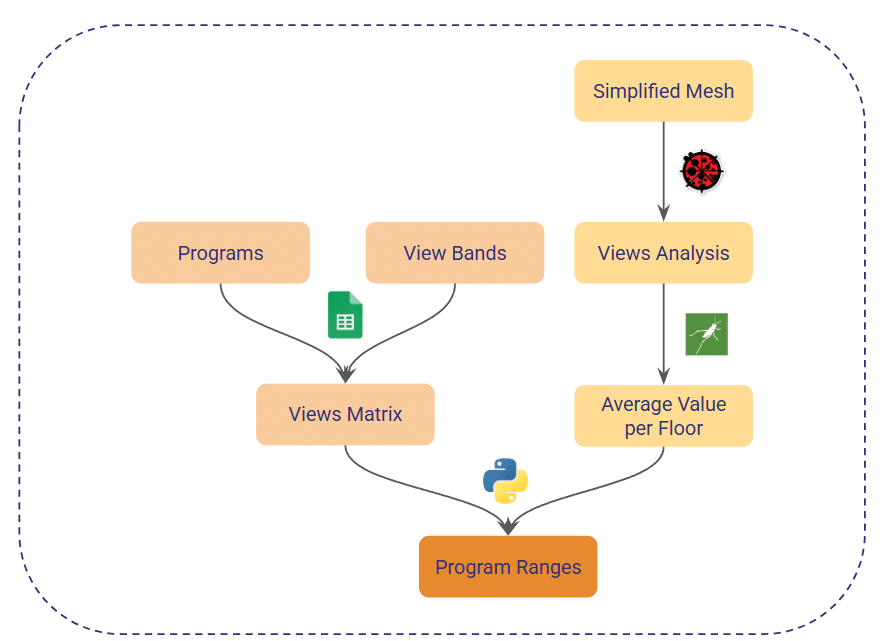
The technical process behind the view analysis begins with converting the building into a simplified mesh, placing data points across every face of the façade to act as digital sensors. Using Ladybug View Analysis, the team maps which floors have the best views and which are more enclosed, producing color gradients that make high-value zones immediately visible.
These data points are then condensed into an average value per floor, giving each level a clear score for view quality. The resulting View Matrix becomes the foundation for all subsequent program allocation decisions — ensuring premium views are used exactly where they add the most value.
Translating Views into Design Decisions
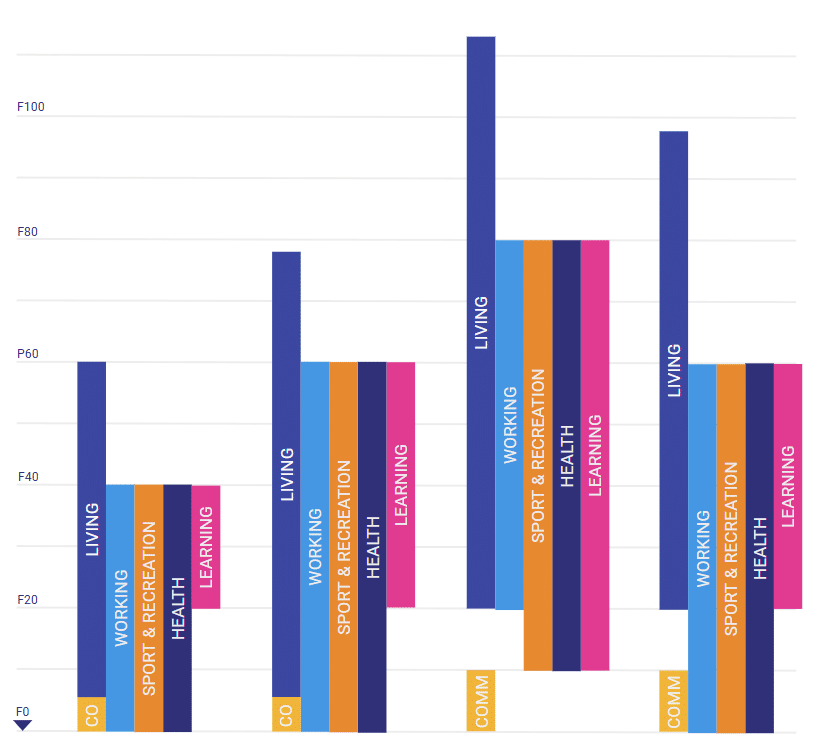
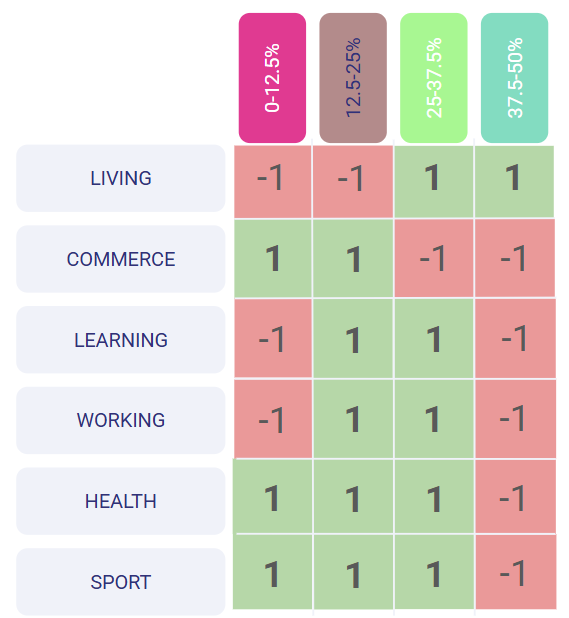
The Scoring View Matrix is where data becomes design. Every floor’s view quality is categorized into four bands ranging from 0 to 50%, and each program is scored based on how much it actually benefits from a view. Living spaces, which thrive on the highest view quality, are scored as recommended for upper floors. Commerce, which performs better closer to street level, is marked as not recommended for those same zones.
This scoring logic feeds directly into the Program alocator — the building’s rule book. It defines the specific floor ranges where each program is permitted to exist based on its view-band compatibility. The script is not static; it is a dynamic set of parameters that feeds into the design software and automatically optimizes every tower in the cluster for both human comfort and logical urban placement.
Program alocator
With the scoring logic established, the next challenge was practical: how do you take all of that data and actually distribute real programs across real towers?
The process unfolds in three steps.
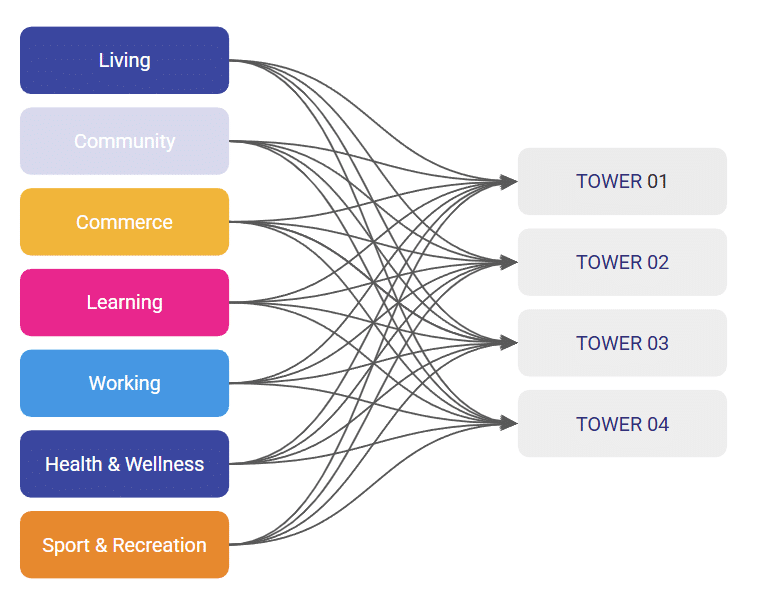
First, the total program is divided proportionally across the four towers based on their respective heights. Taller towers receive a greater share of the program, ensuring that floor area is distributed logically rather than arbitrarily. Every program category — Living, Commerce, Working, Sport & Recreation, Learning, and Health & Wellness — flows into each tower according to this proportional logic.
Second, the team defined the stacking logic. Rather than assigning programs floor by floor, each program is treated as a self-contained functional chunk spanning between three and five floors. This range is not arbitrary — it is calibrated to balance elevator wait times, MEP (mechanical, electrical, and plumbing) distribution, and structural efficiency. Each chunk behaves as a coherent unit within the tower, making the building easier to service, navigate, and inhabit.
Third, the program allocator script runs. Taking the floor ranges delivered by the View Matrix and the chunk groupings from the previous step, it distributes each program across the towers automatically — placing the right function in the right zone, at the right scale. The team can fine-tune the output in real time using a set of sliders, allowing parameters to be adjusted and results to be evaluated instantly. It is the moment where months of analysis finally become architecture.
This fits naturally between the scoring view matrix section and the optimization section. Want me to repost the full updated blog post with this integrated?
Optimization: Making the Mix Smarter
With the foundational logic in place, the team asked a deeper question: how can greater program diversity be introduced within the towers to make them both more functional and more efficient?
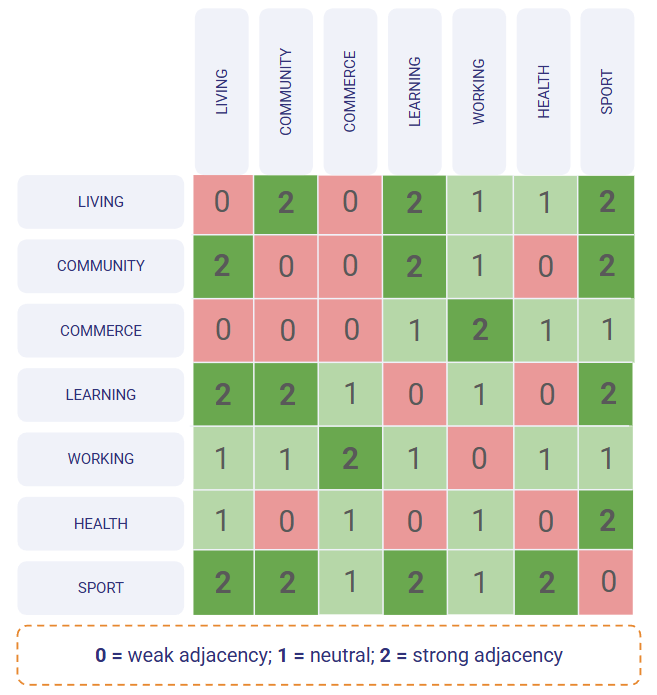
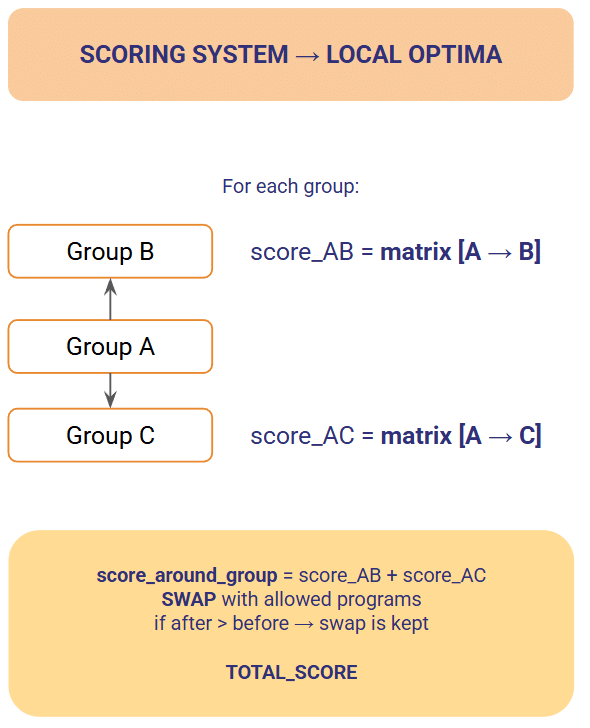
The answer came in the form of an adjacency matrix — a tool that defines the relationships between different programs, assigning a score from 0 to 2 based on how strongly certain functions benefit from being located next to each other. Building on this, an optimization process based on a hill-climbing approach evaluates whether swapping any given program chunk with another would improve the overall adjacency score, while still respecting the predefined floor ranges.
This process runs across all towers simultaneously, with a total score calculated by summing the individual scores of each chunk. The data feeds into a digital tissue dashboard, where key performance indicators can be monitored and adjusted in real time. The outcome is a significant improvement in program diversity, leading to a more balanced and effective distribution of functions throughout the building.
Conclusion
What Hyperbuilding 03 ultimately represents is a pipeline that integrates human-centered needs into a coherent design system. Programs are organized not just by technical floor logic, but by view quality, functional relationships, and the lived experience of the people who will inhabit the space. The result is a vertical neighborhood that is not only efficient — but genuinely alive.