Using a visiblity map in the residential district of Montserratina in Viladecans, Catalunya, we aim to identify which junctions in the most popular route or routes are safe and what street typologies promote safety.
VILADECANS
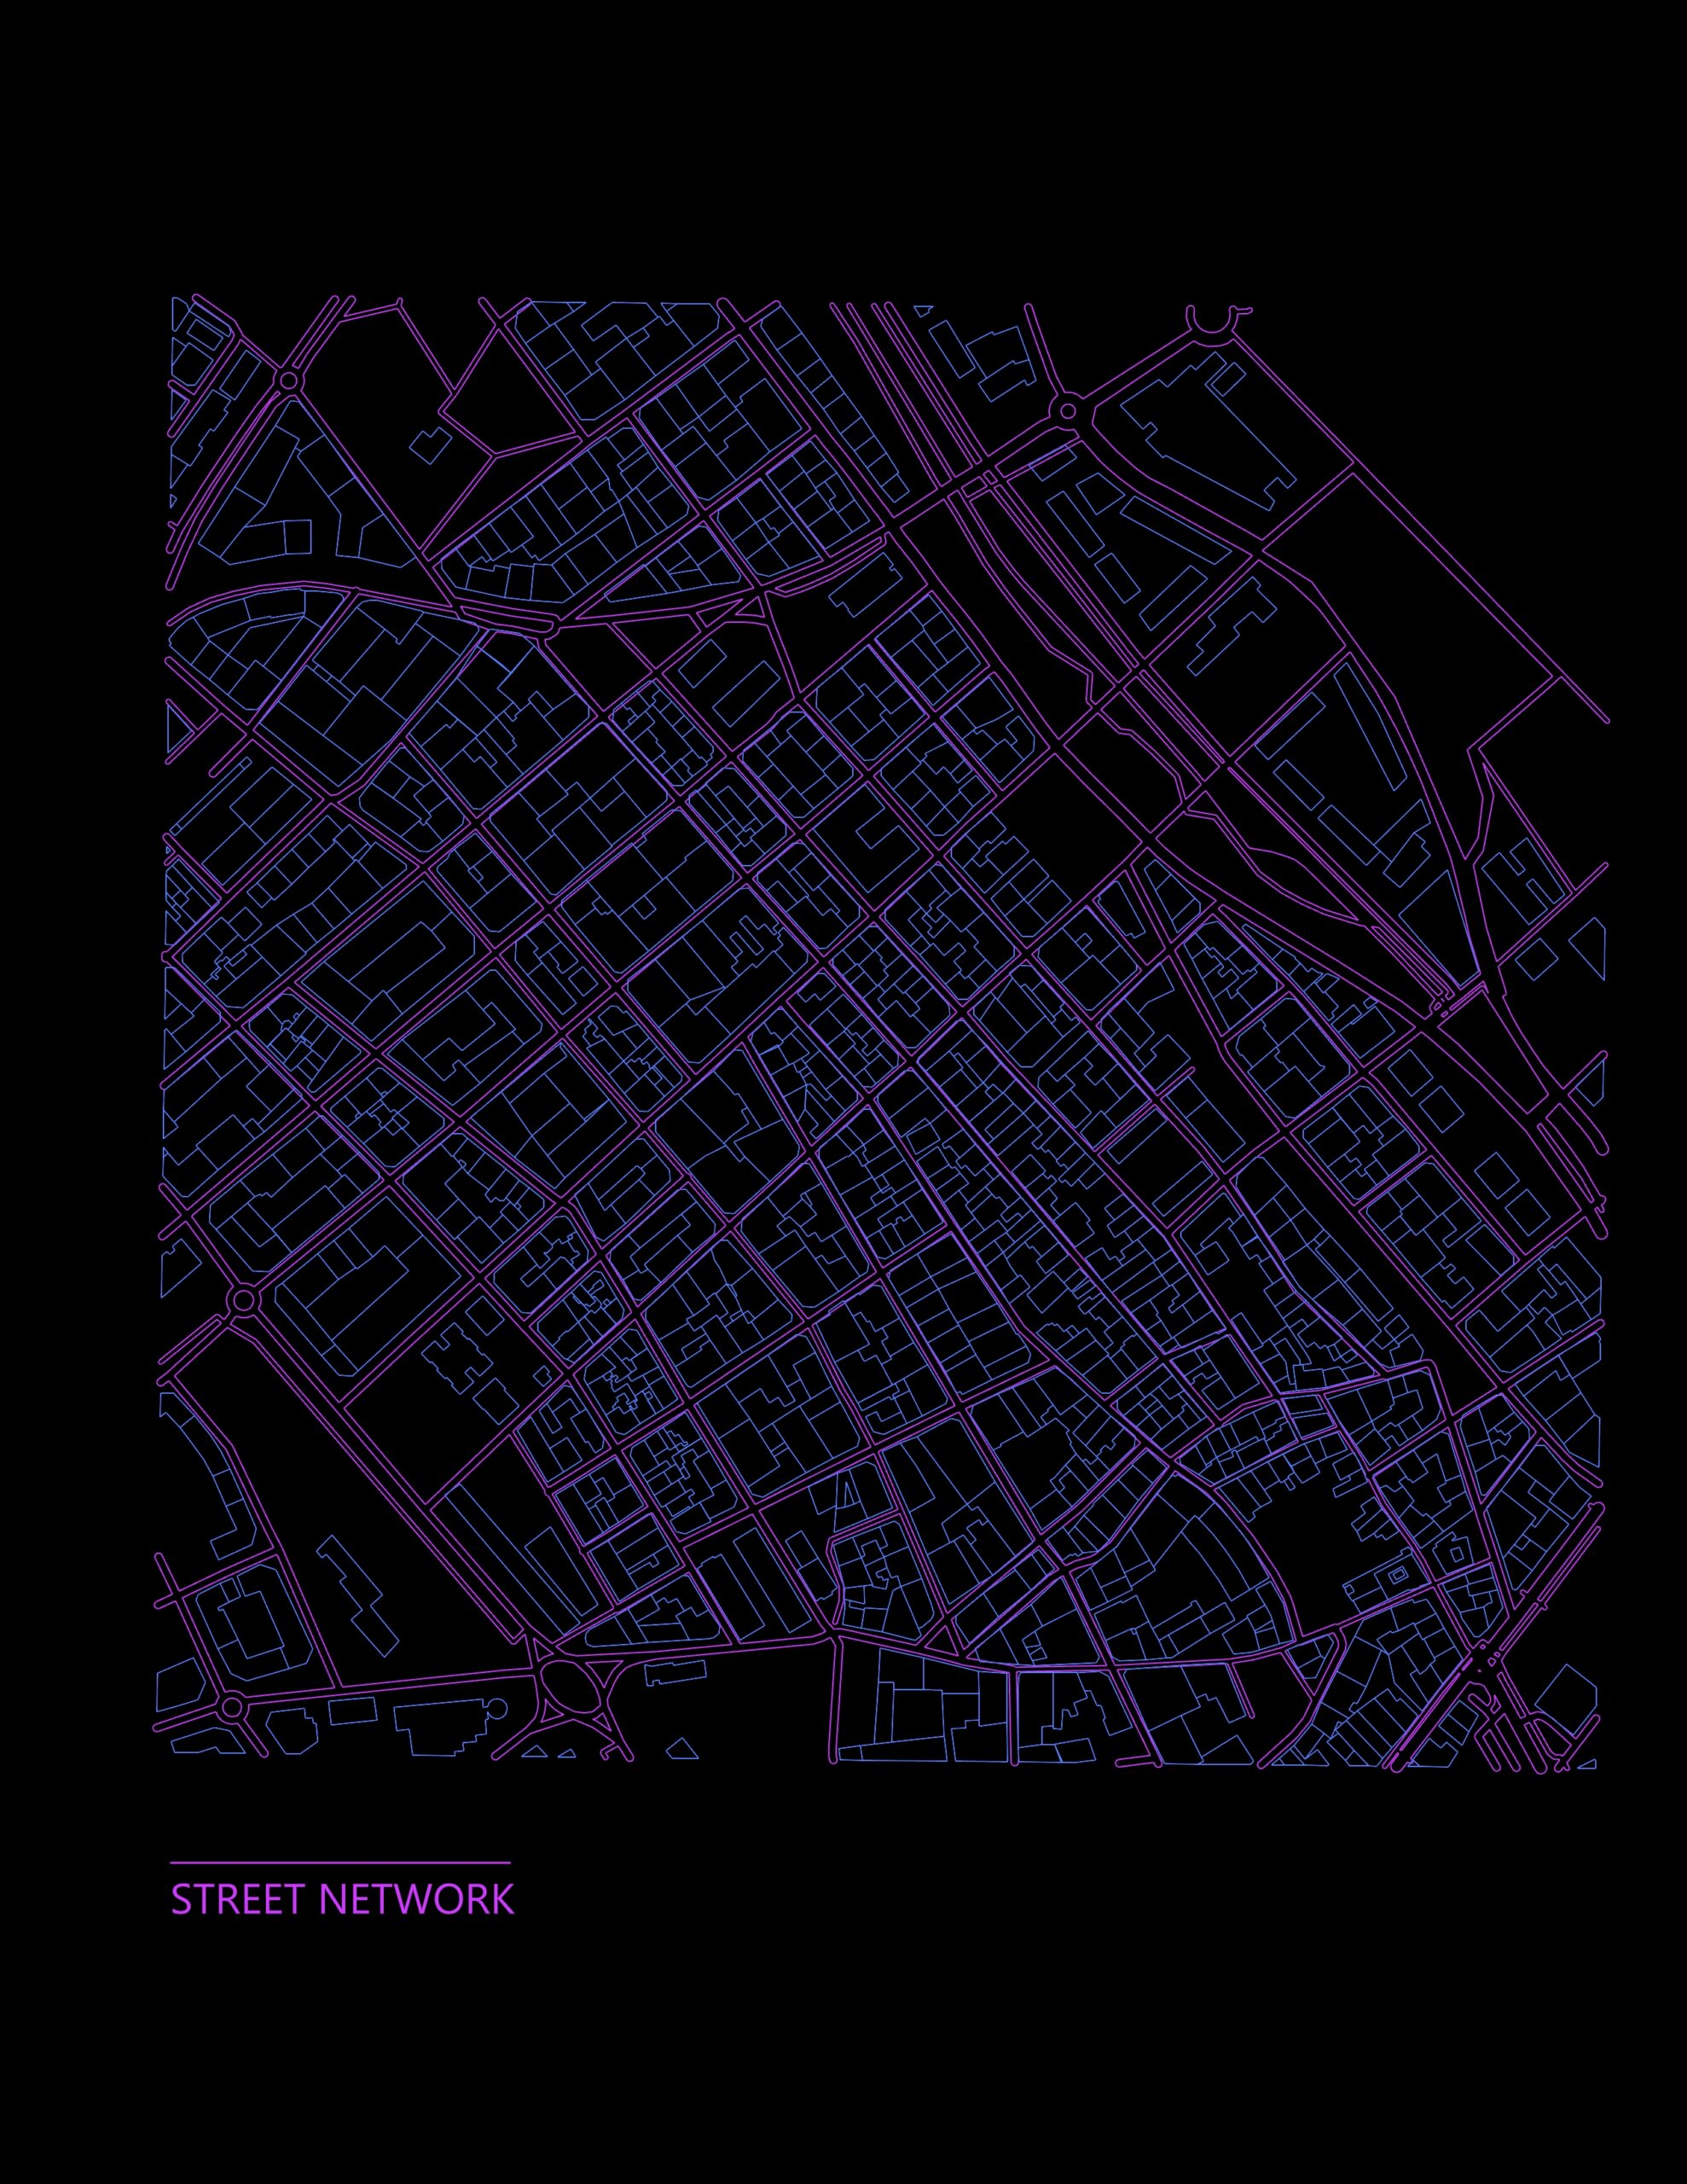
We were working on a project that had as an objective to create healthy and safe spaces for the city of Viladecans. In the following picture we can see a map with the residential area with the highest density of population in the city. In purple are the street networks and in blue the buildings in each block.
CENTRALITIES CONNECTION
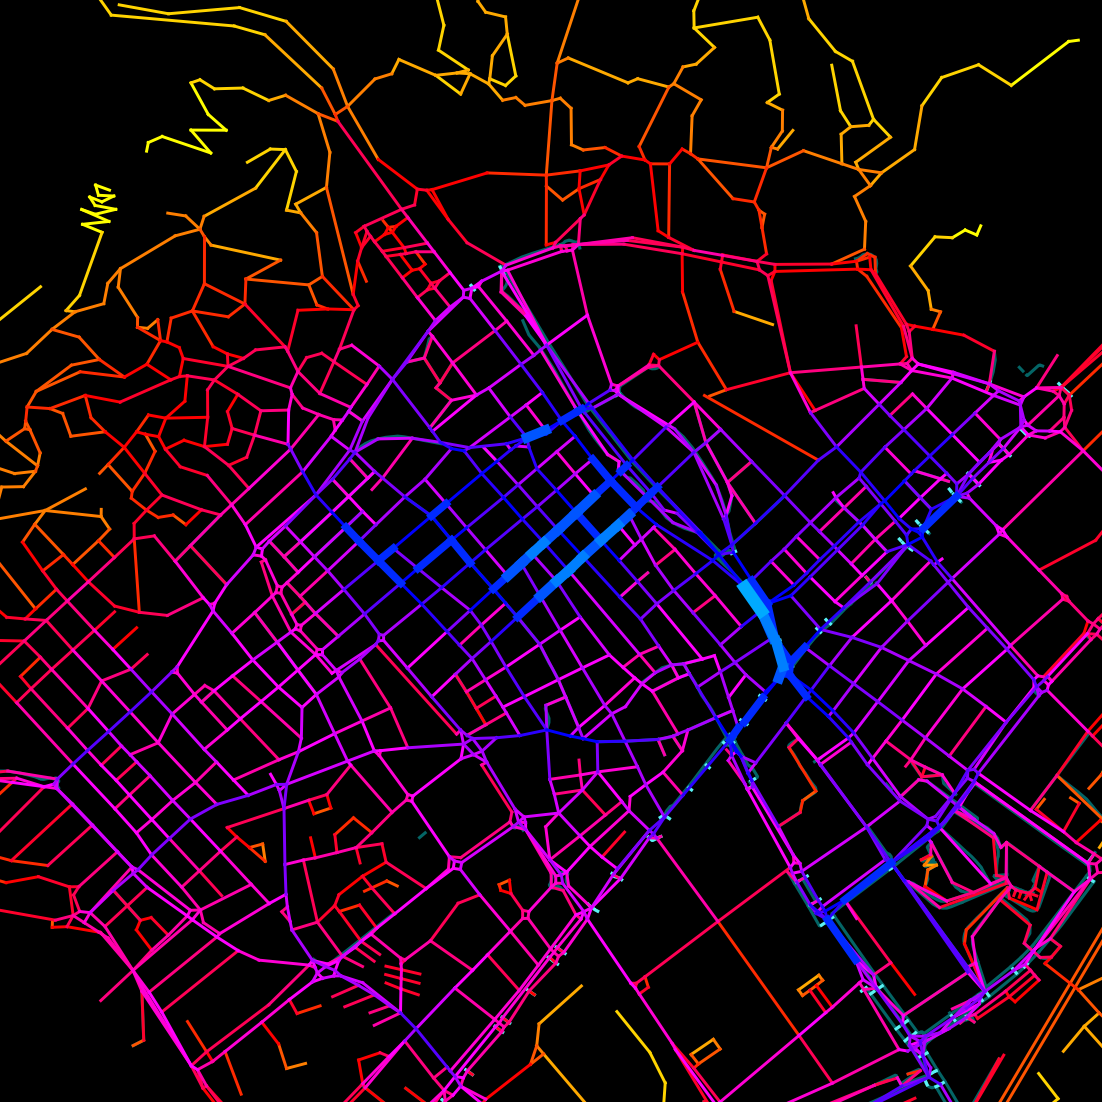
During the project we identified three big centralities that we were trying to connect in a very healthy and safe manner. We decided to identify which would be the best route to make it pedestrian. In the following maps we can observe the routes that are better connected with these 3 big centralities.
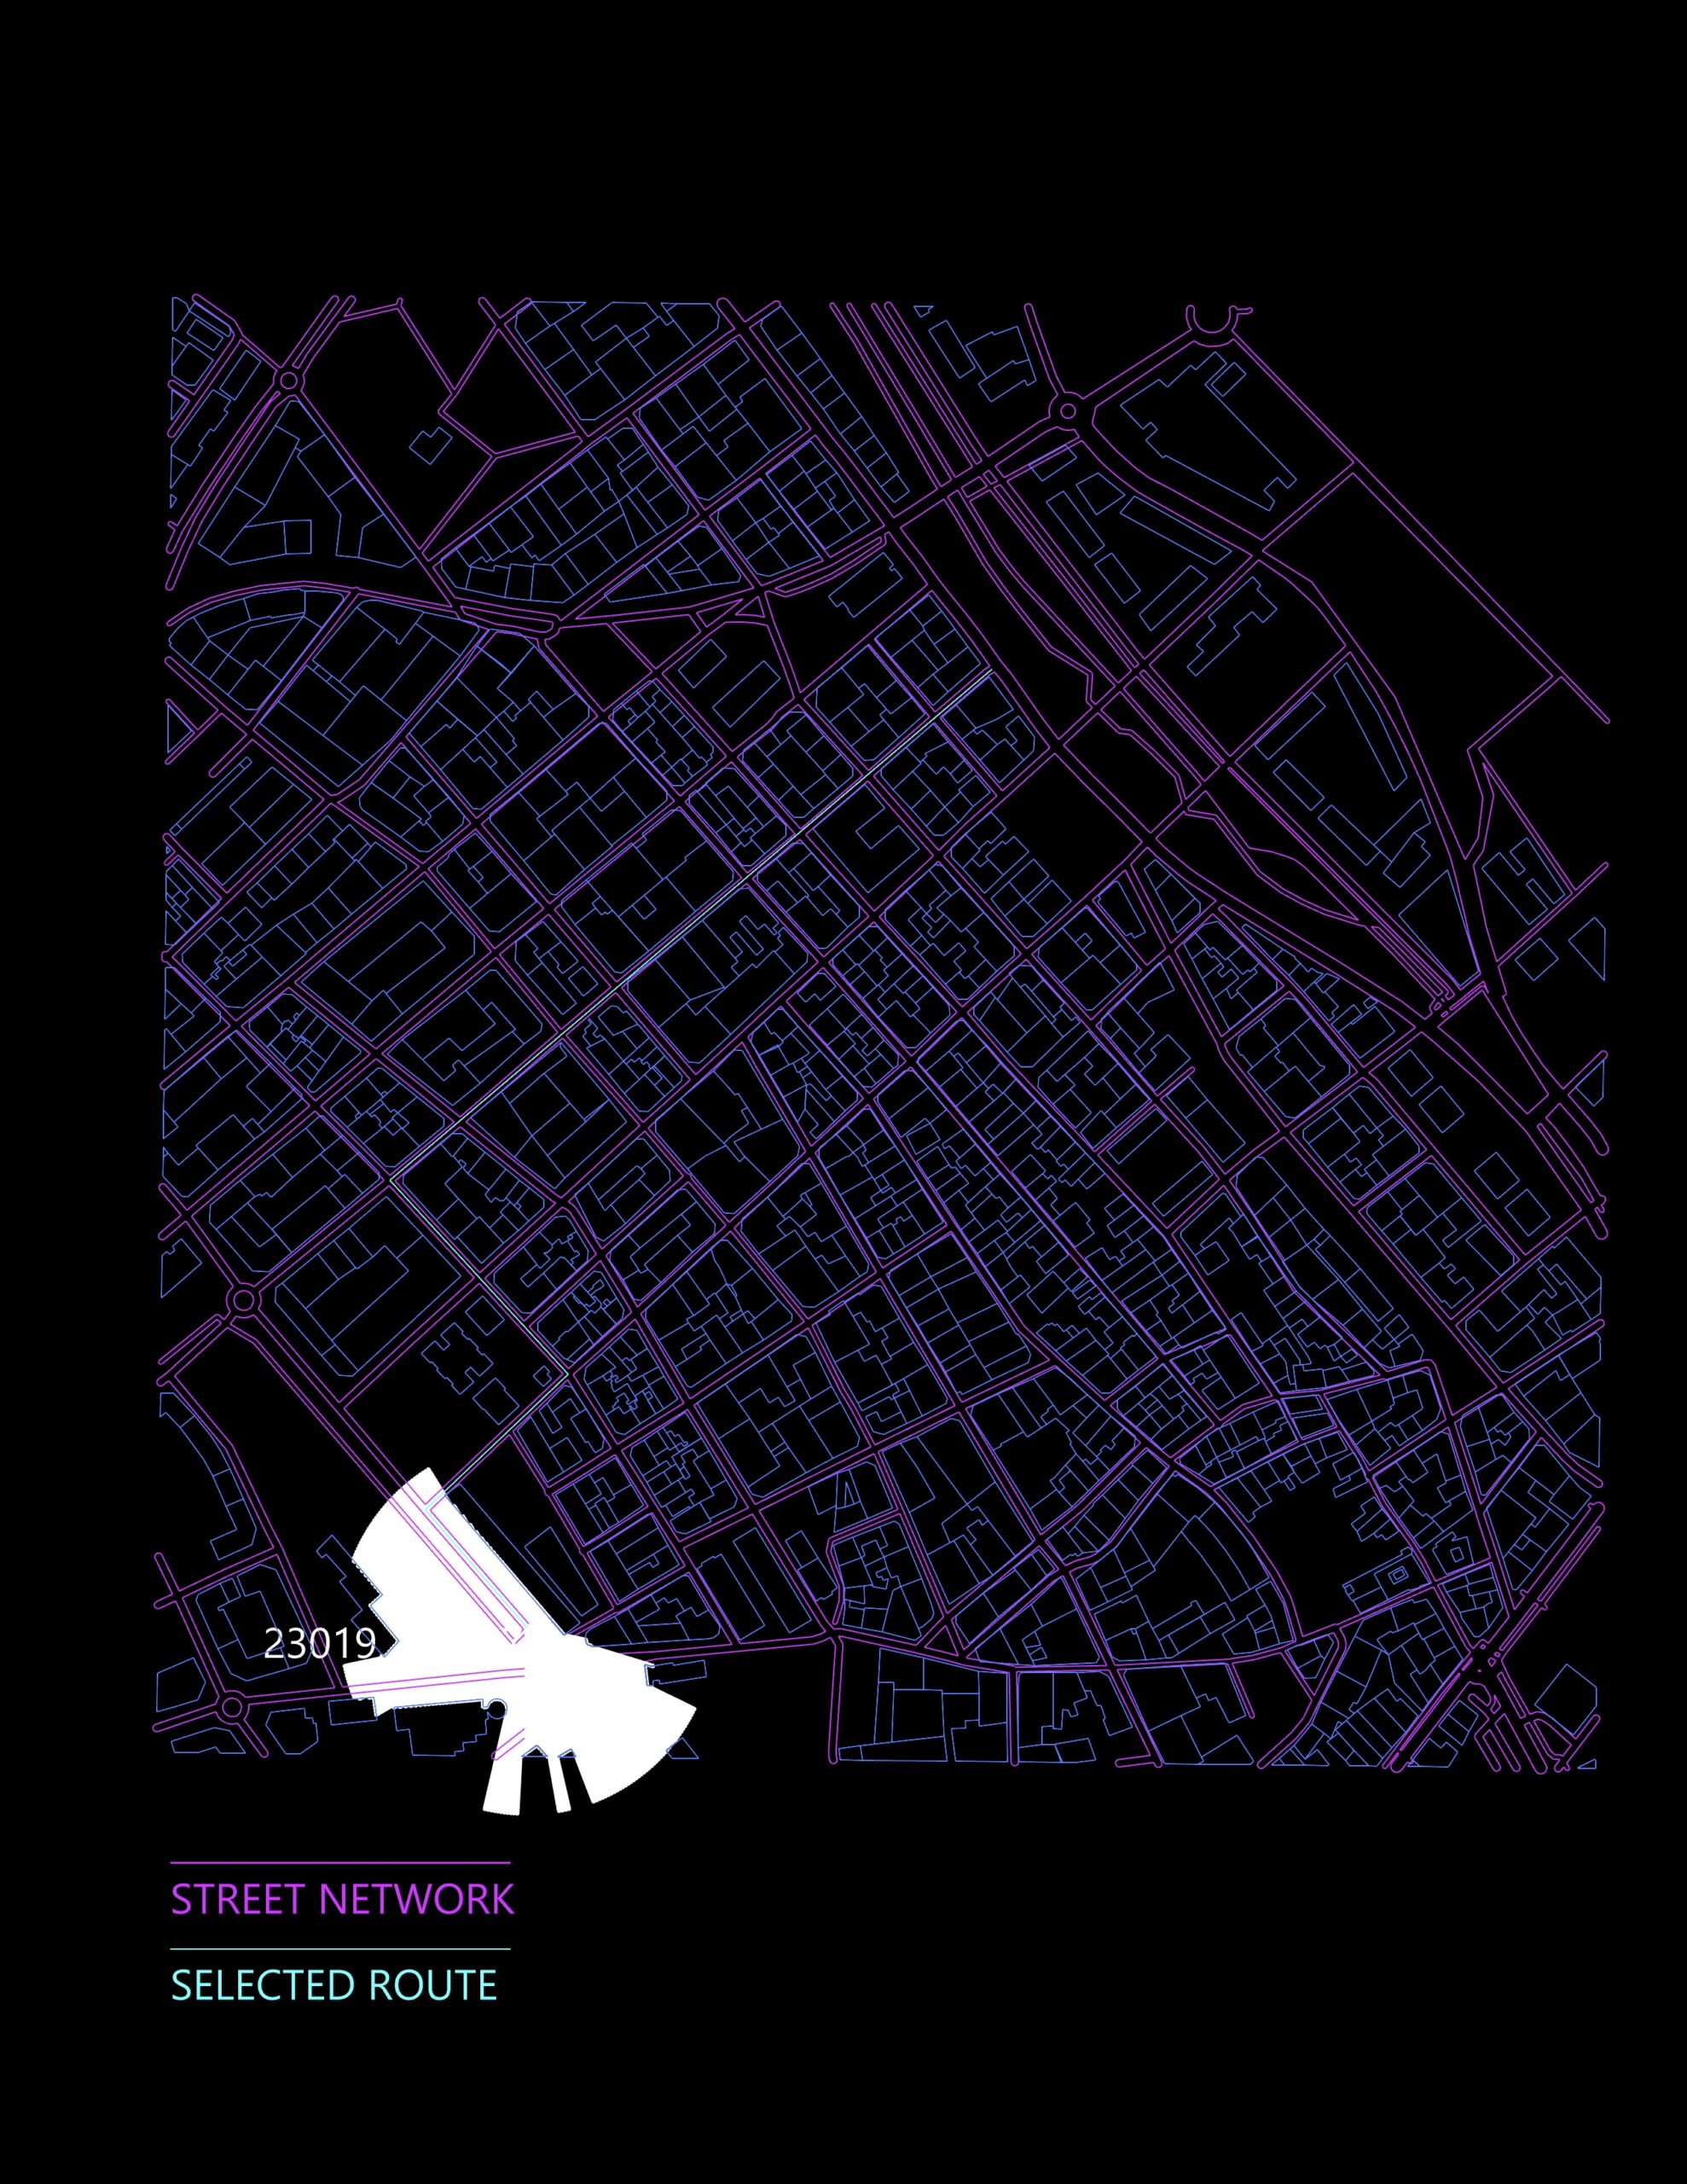
THE SELECTED ROUTE
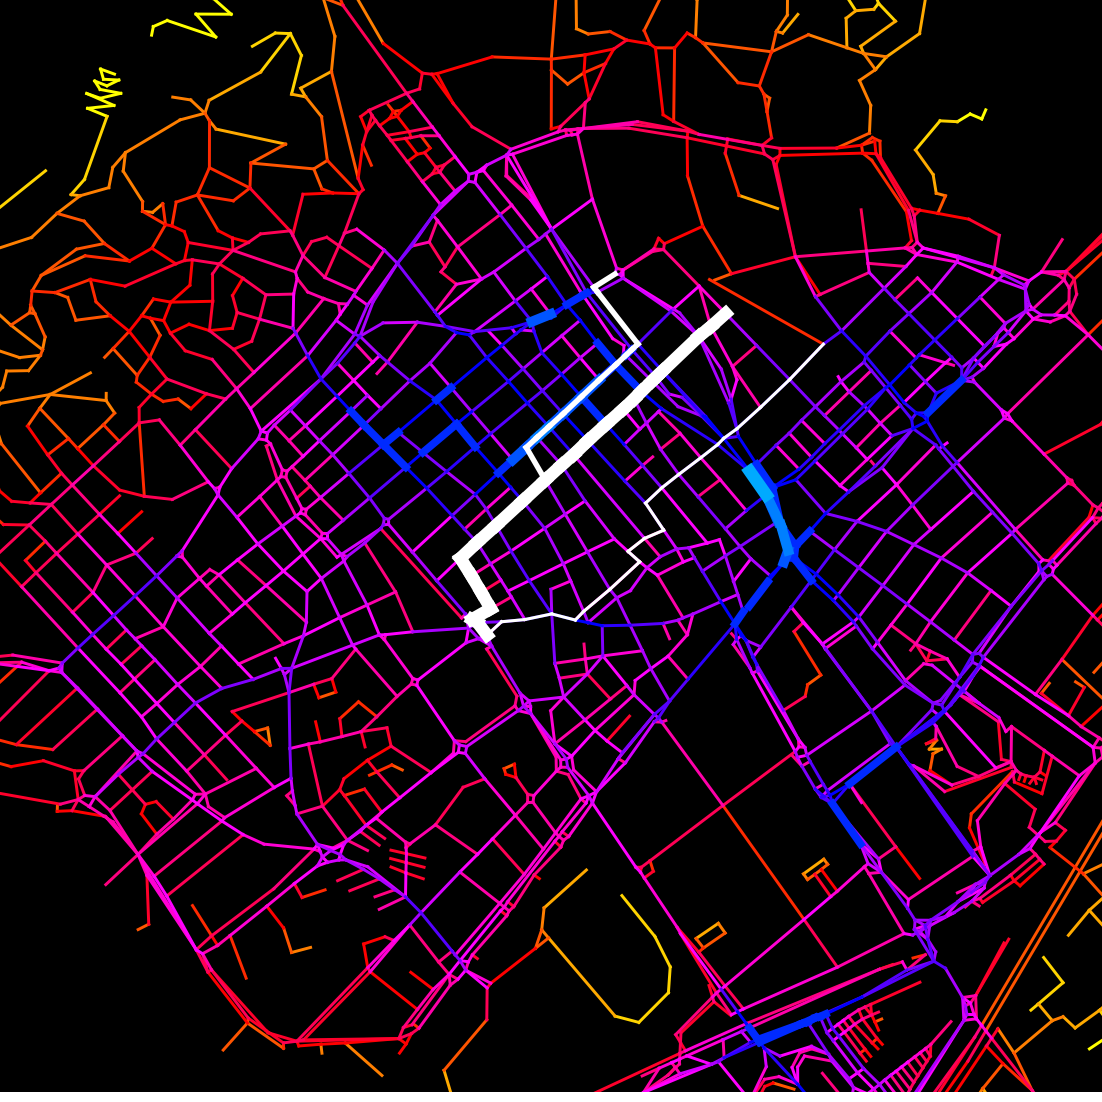
Finally we ended up choosing our final route by identifying the one that had the shortest time between two major points of interest. This route is the thickest white line shown in the following image. The other two white lines were also good options but would have resulted more time consuming for pedestrians and less efficient.
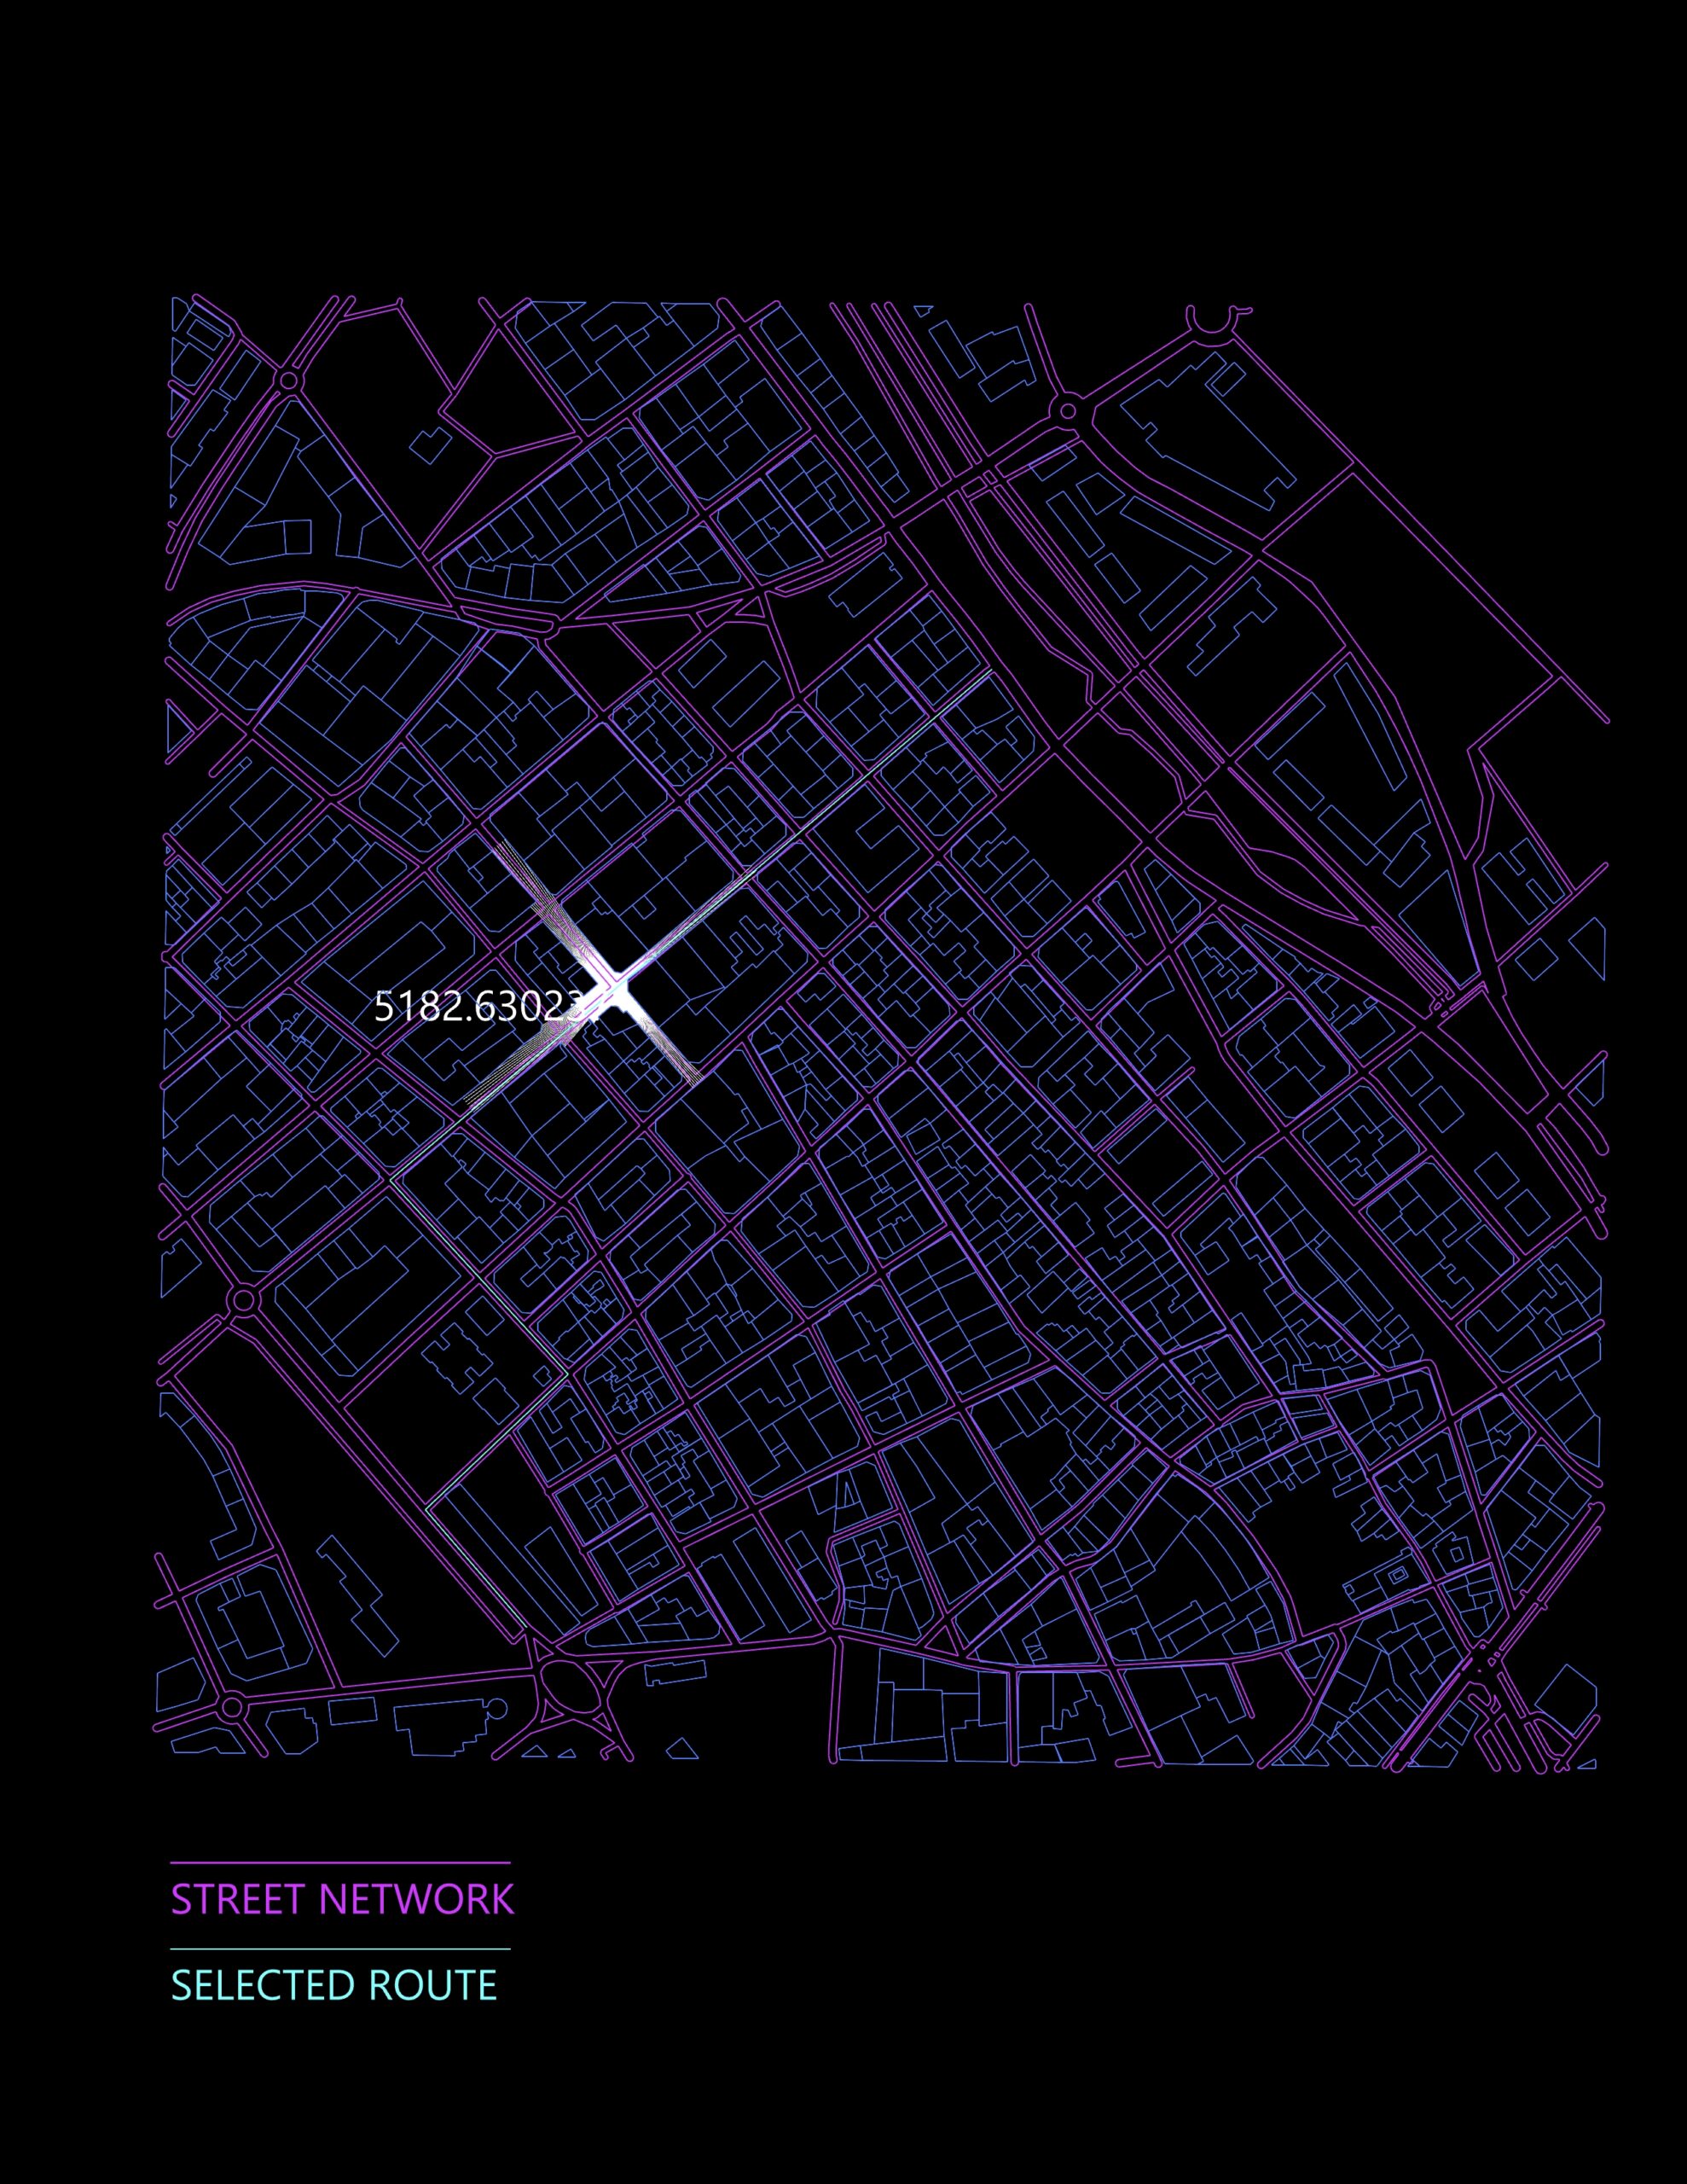
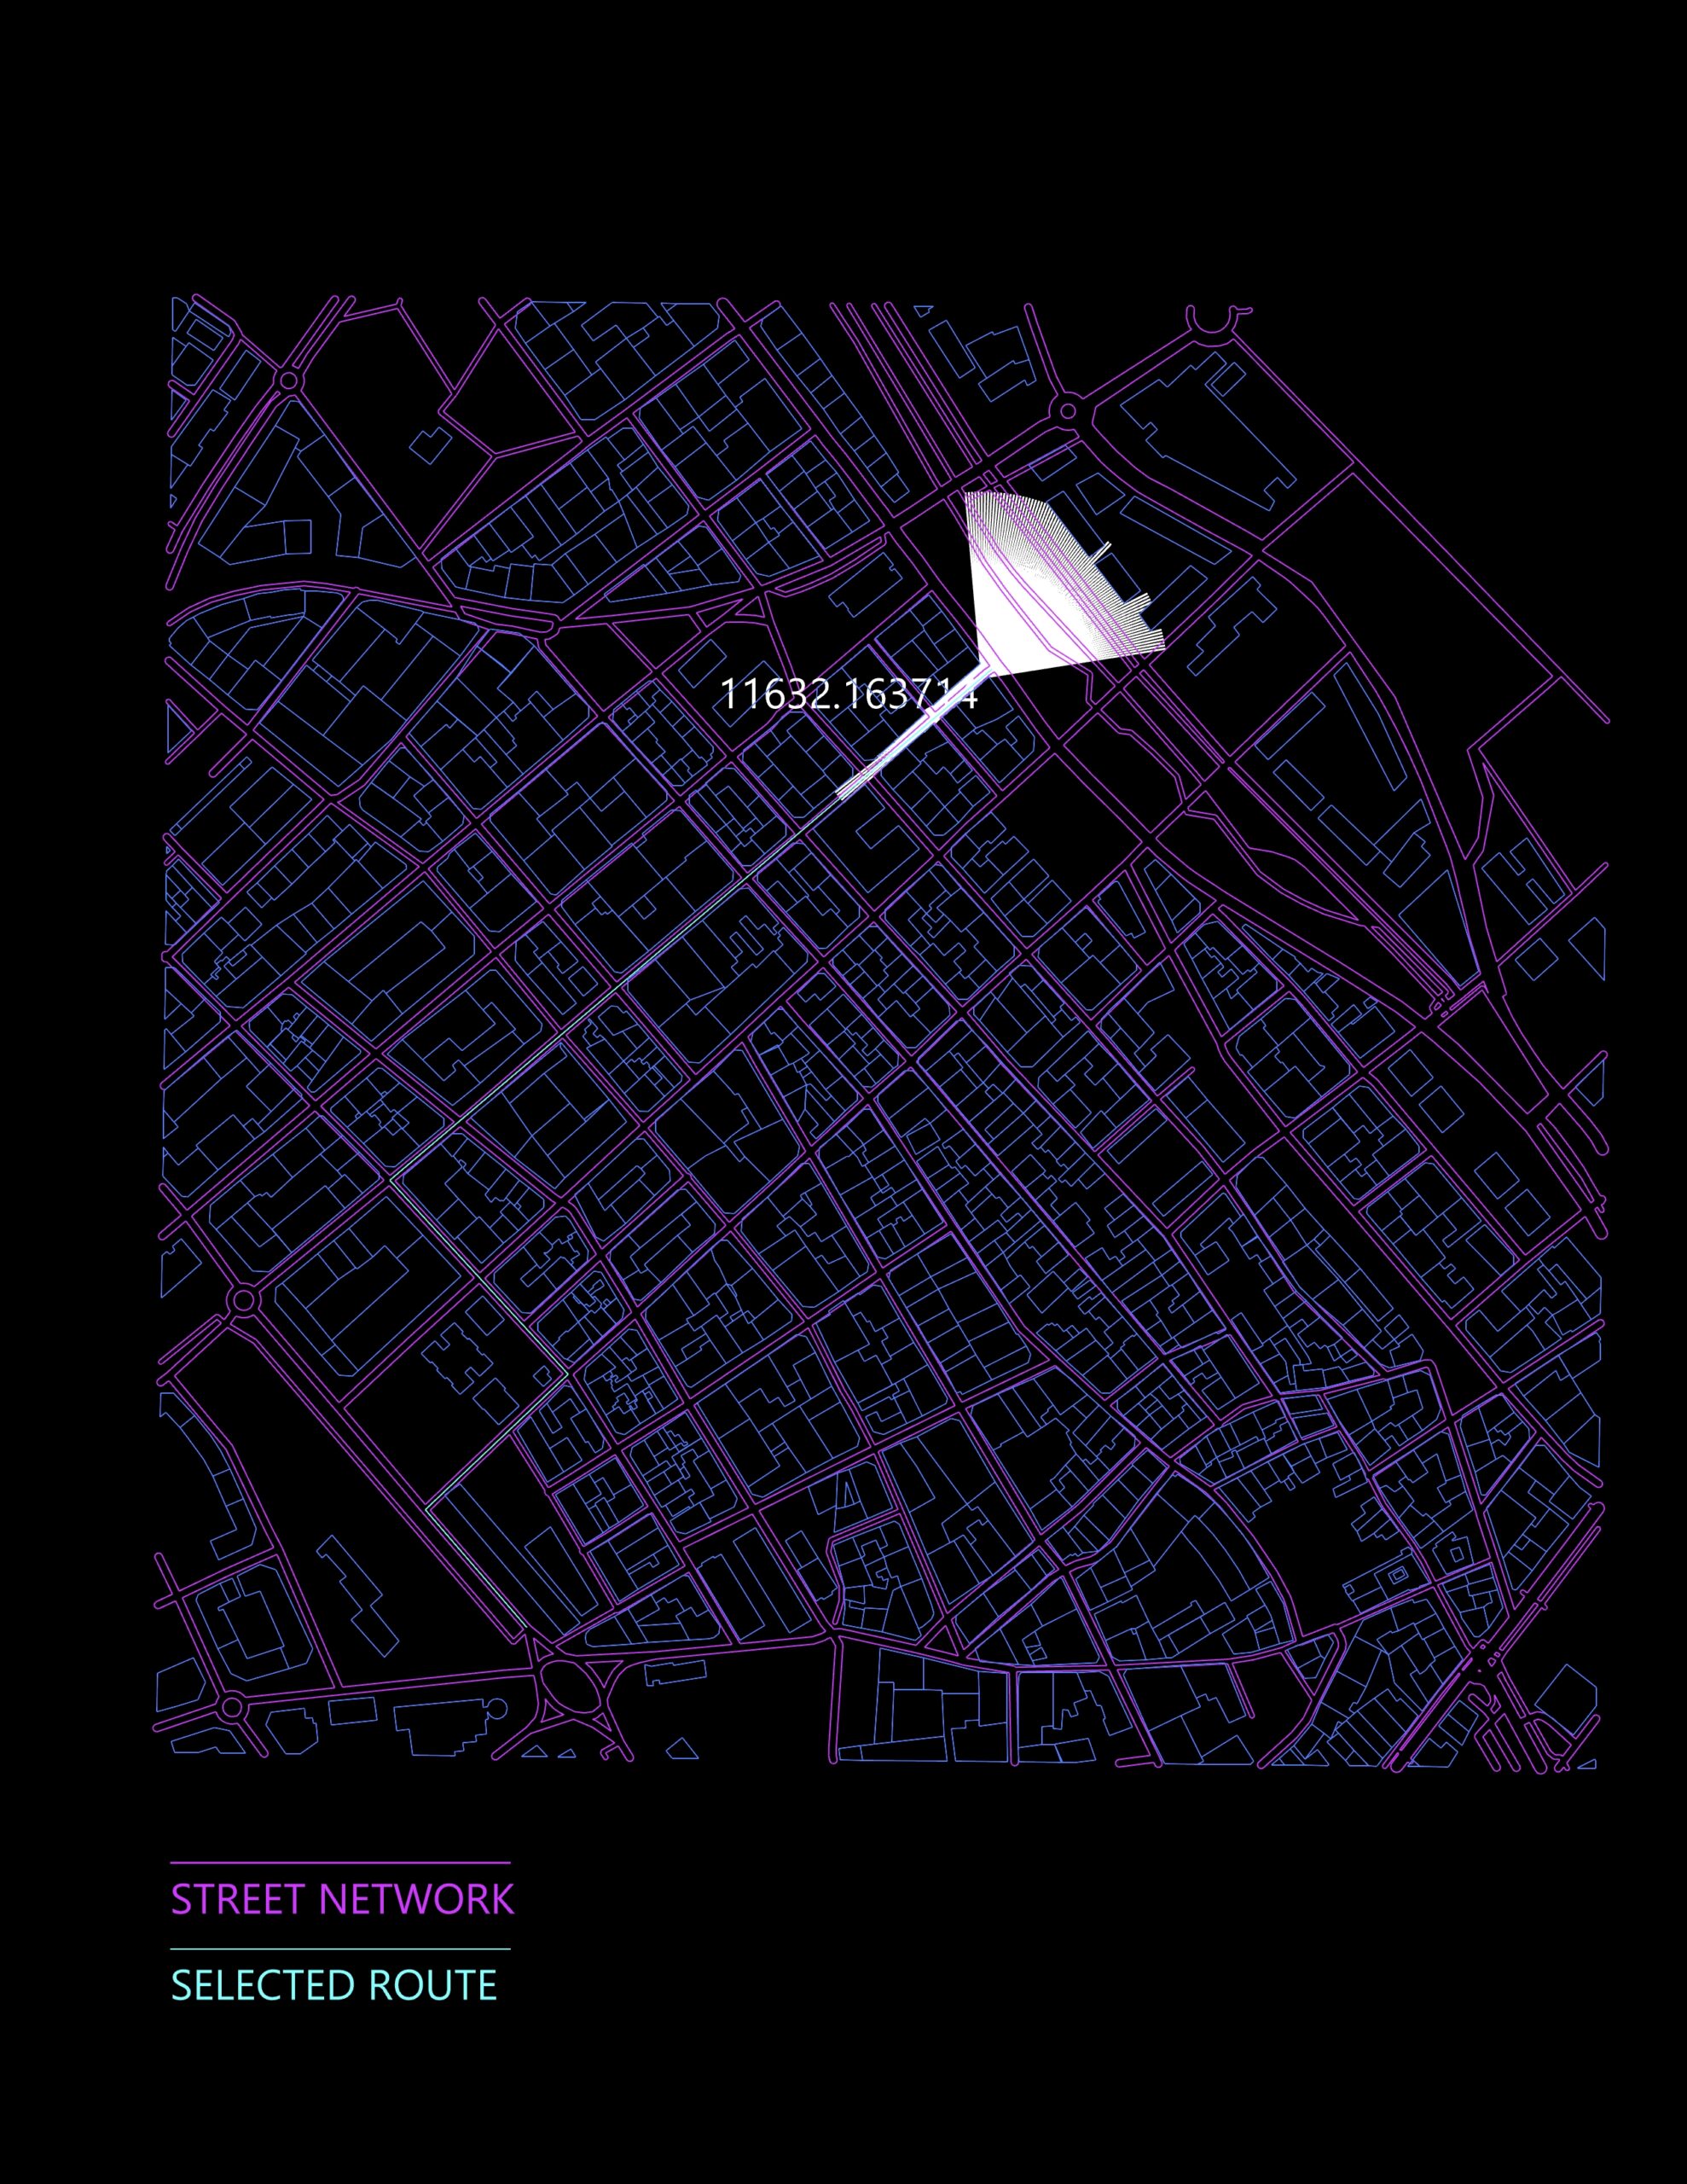
THE ANIMATION
Finally we find this animation that shows the route through the selected path. The isovist map changes according to which junctions are safe and what street typologies promote safety. This animation help us explain how we got to the conclusion that this was the best way of creating a connection between two major centralities in Viladecans prioritizing health and safety for the residents.