Mediterranean islands are crushed by tourism in July and August, and almost empty the rest of the year. So we asked what if generative AI could show people the ten months that already exist beyond those two? The goal was to make the off-season feel desirable, not as data, but as images you’d actually want to visit.
Methodology
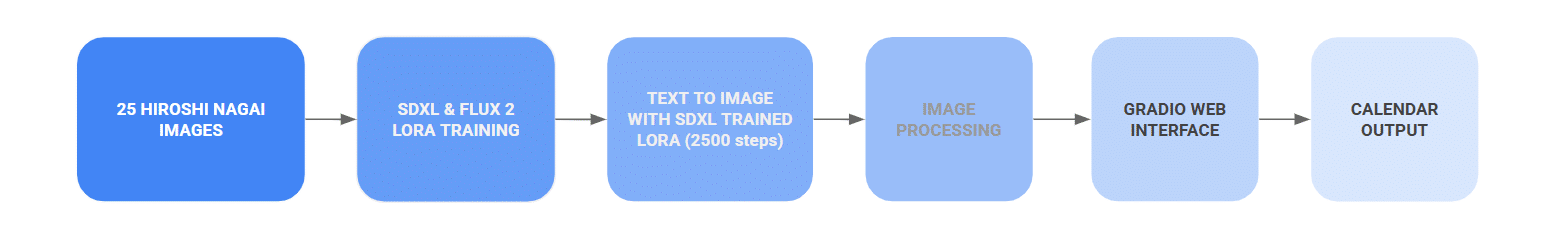
We started from a set of reference paintings, trained lora on them, generated island scenes from text prompts, processed those images, and finally delivered everything through a web interface as a calendar. In the following we will show every stage.
Lora Images
We trained a LoRA on 25 paintings by Hiroshi Nagai, the artist behind that calm, sunlit Japanese city-pop aesthetic. We trained it on both SDXL and Flux2 although we liked the SDXL results more.
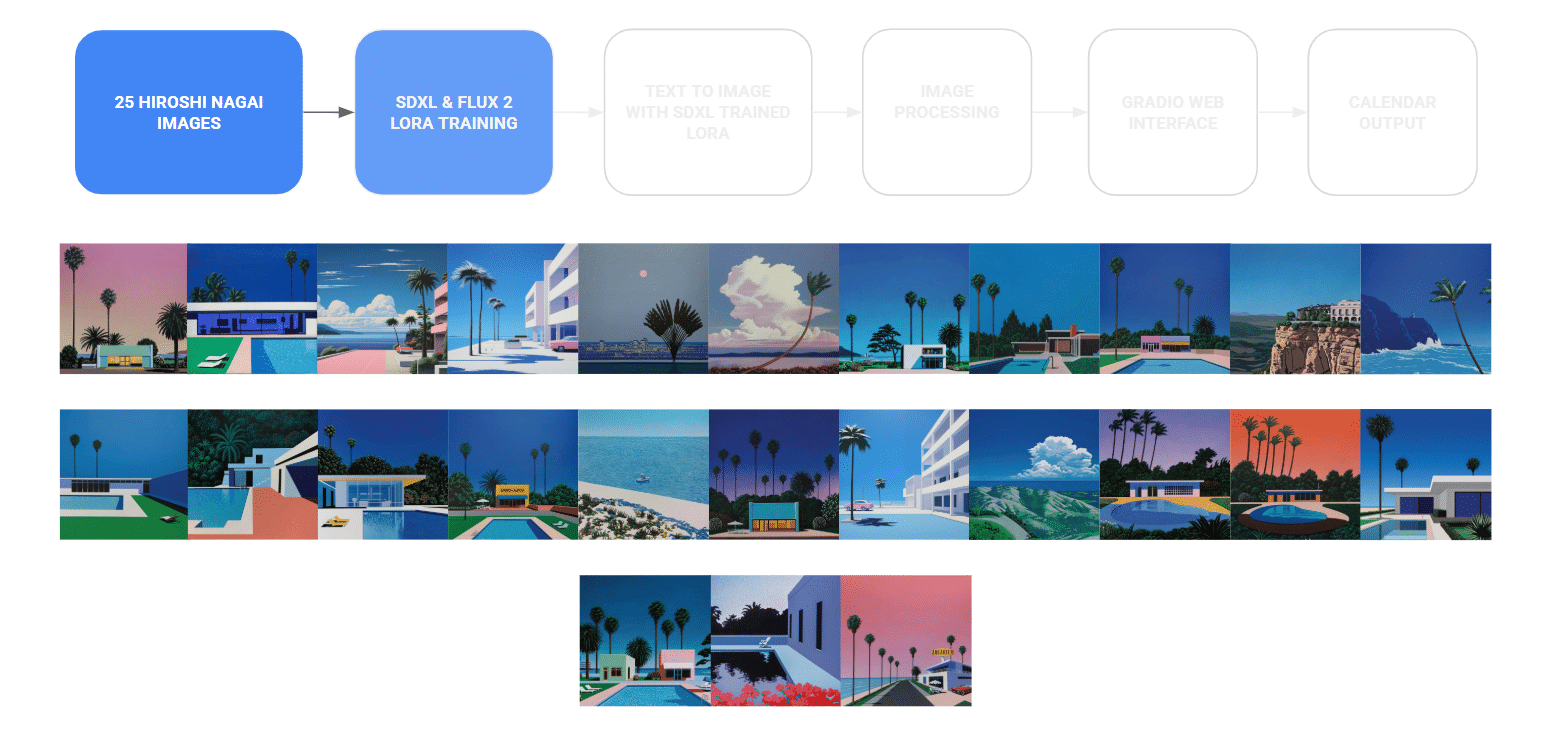
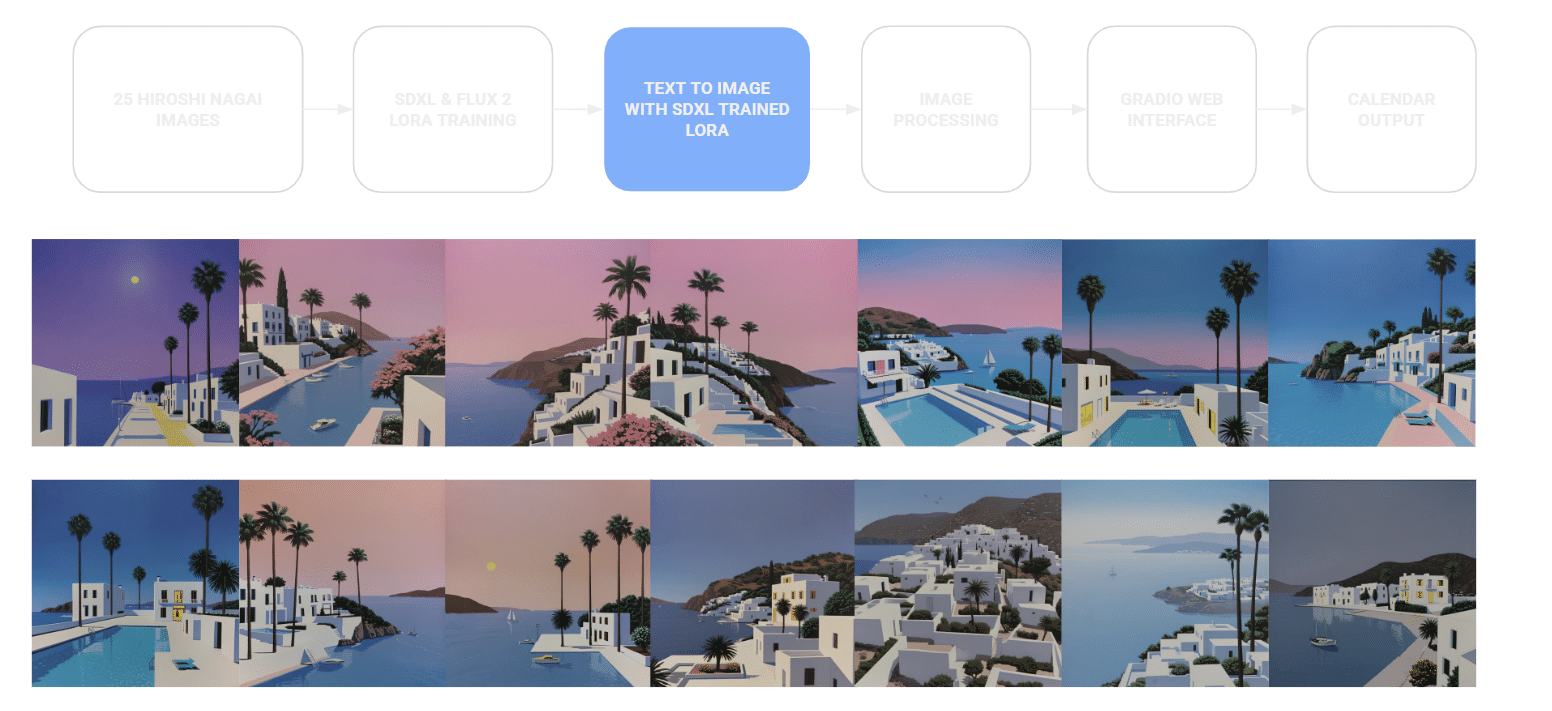
Image Generation
Once trained, the model could generate brand-new island scenes with the Hiroshi Nagai style.
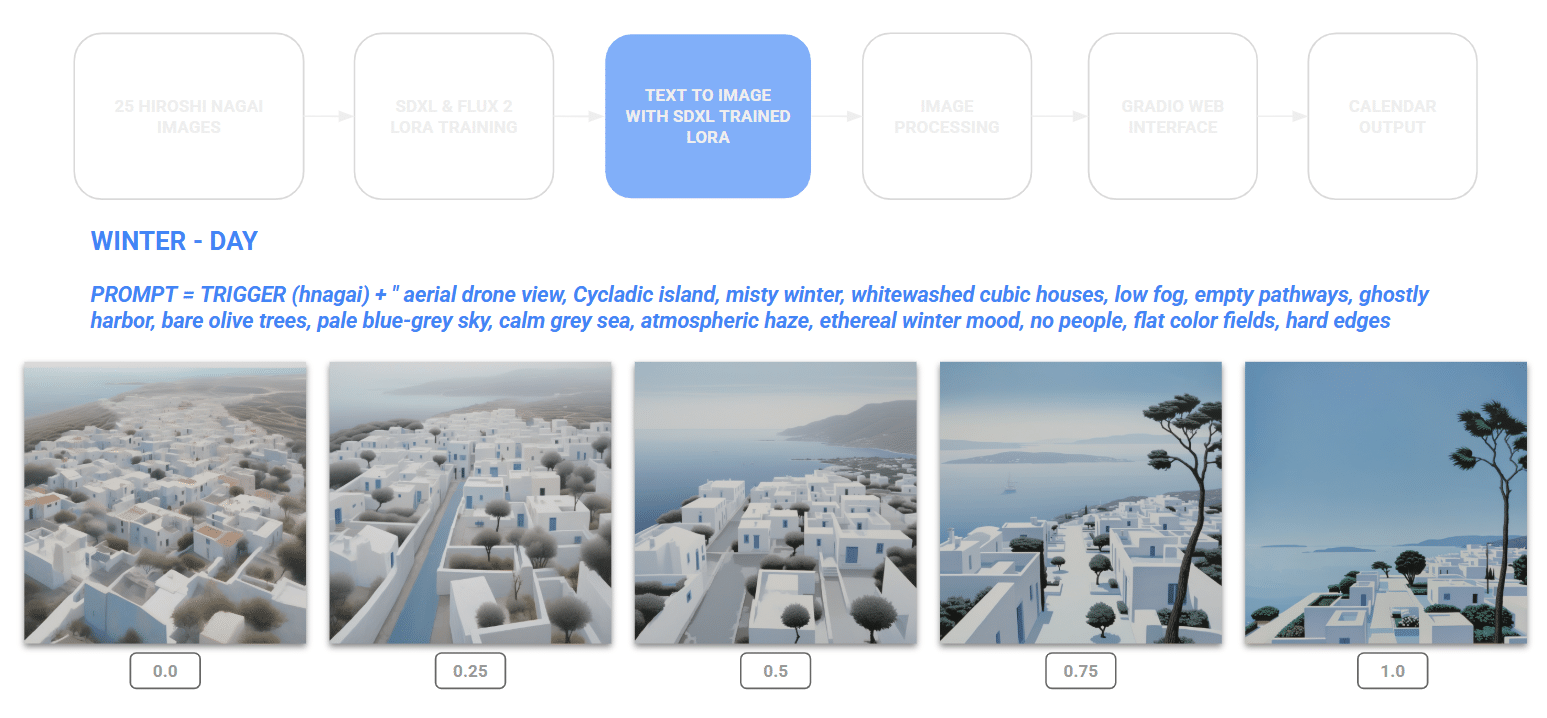
Text Prompts with Scale Variations
This row below shows the LoRA strength dial, from zero to one. On the left, almost no style. On the right, full Nagai. Around 0.75 we hit our sweet spot.
Seeds
Holding scale strength at 0.75, we then varied the random seed to get a range of compositions for the same scene — so we could pick the strongest one for each month.
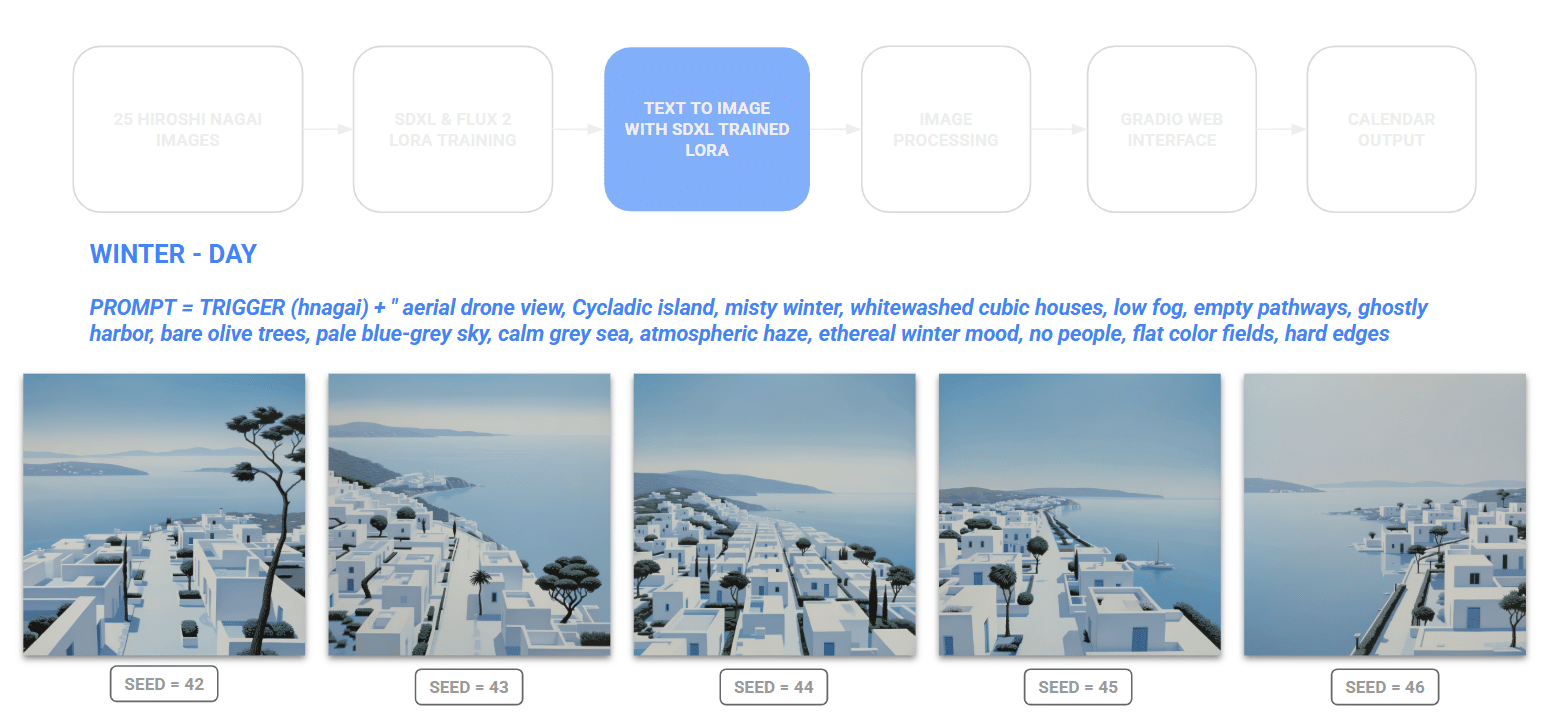
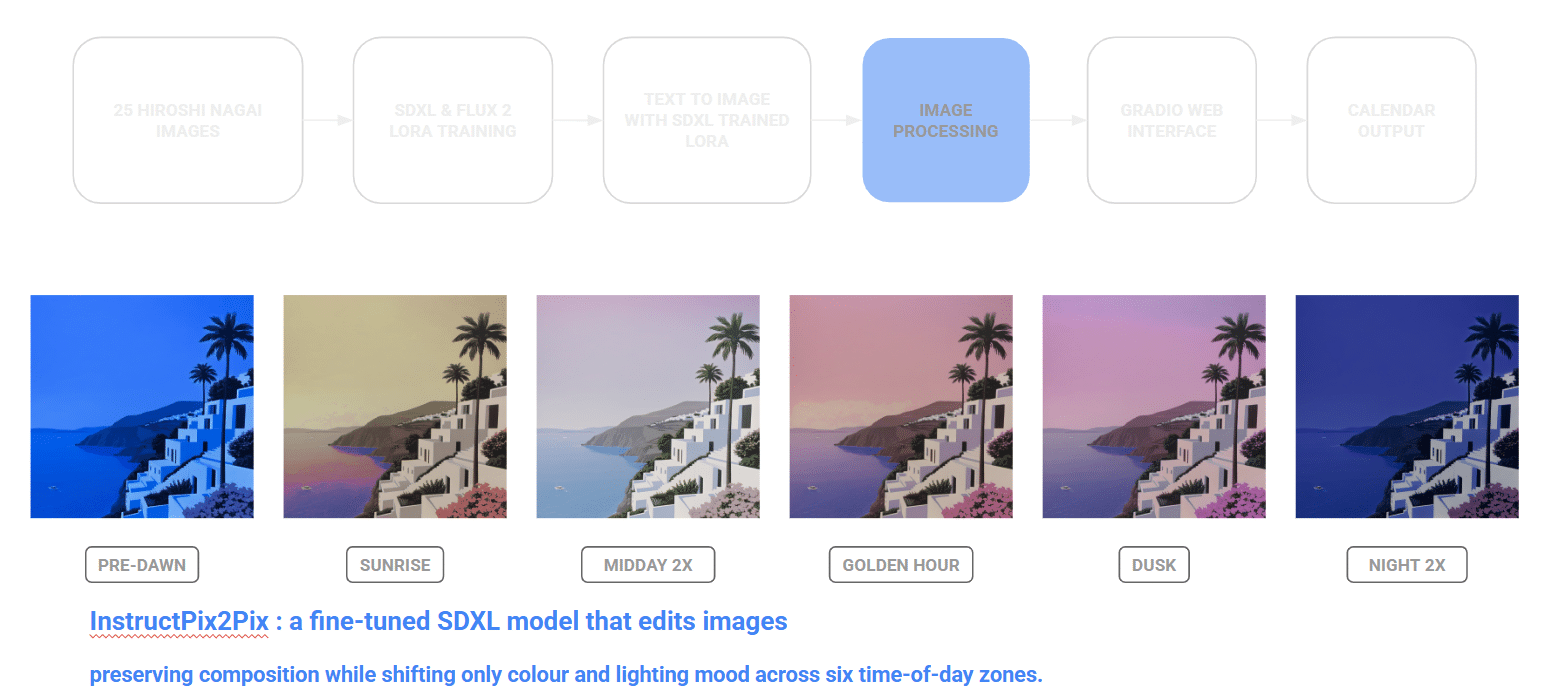
Image Processing
We used InstructPix2Pix a fine-tuned SDXL model in a pipeline to generate 6 different lighting variants of the day for every master image of the month. The model preserved composition while shifting only colour and lighting.
Crowd Generation
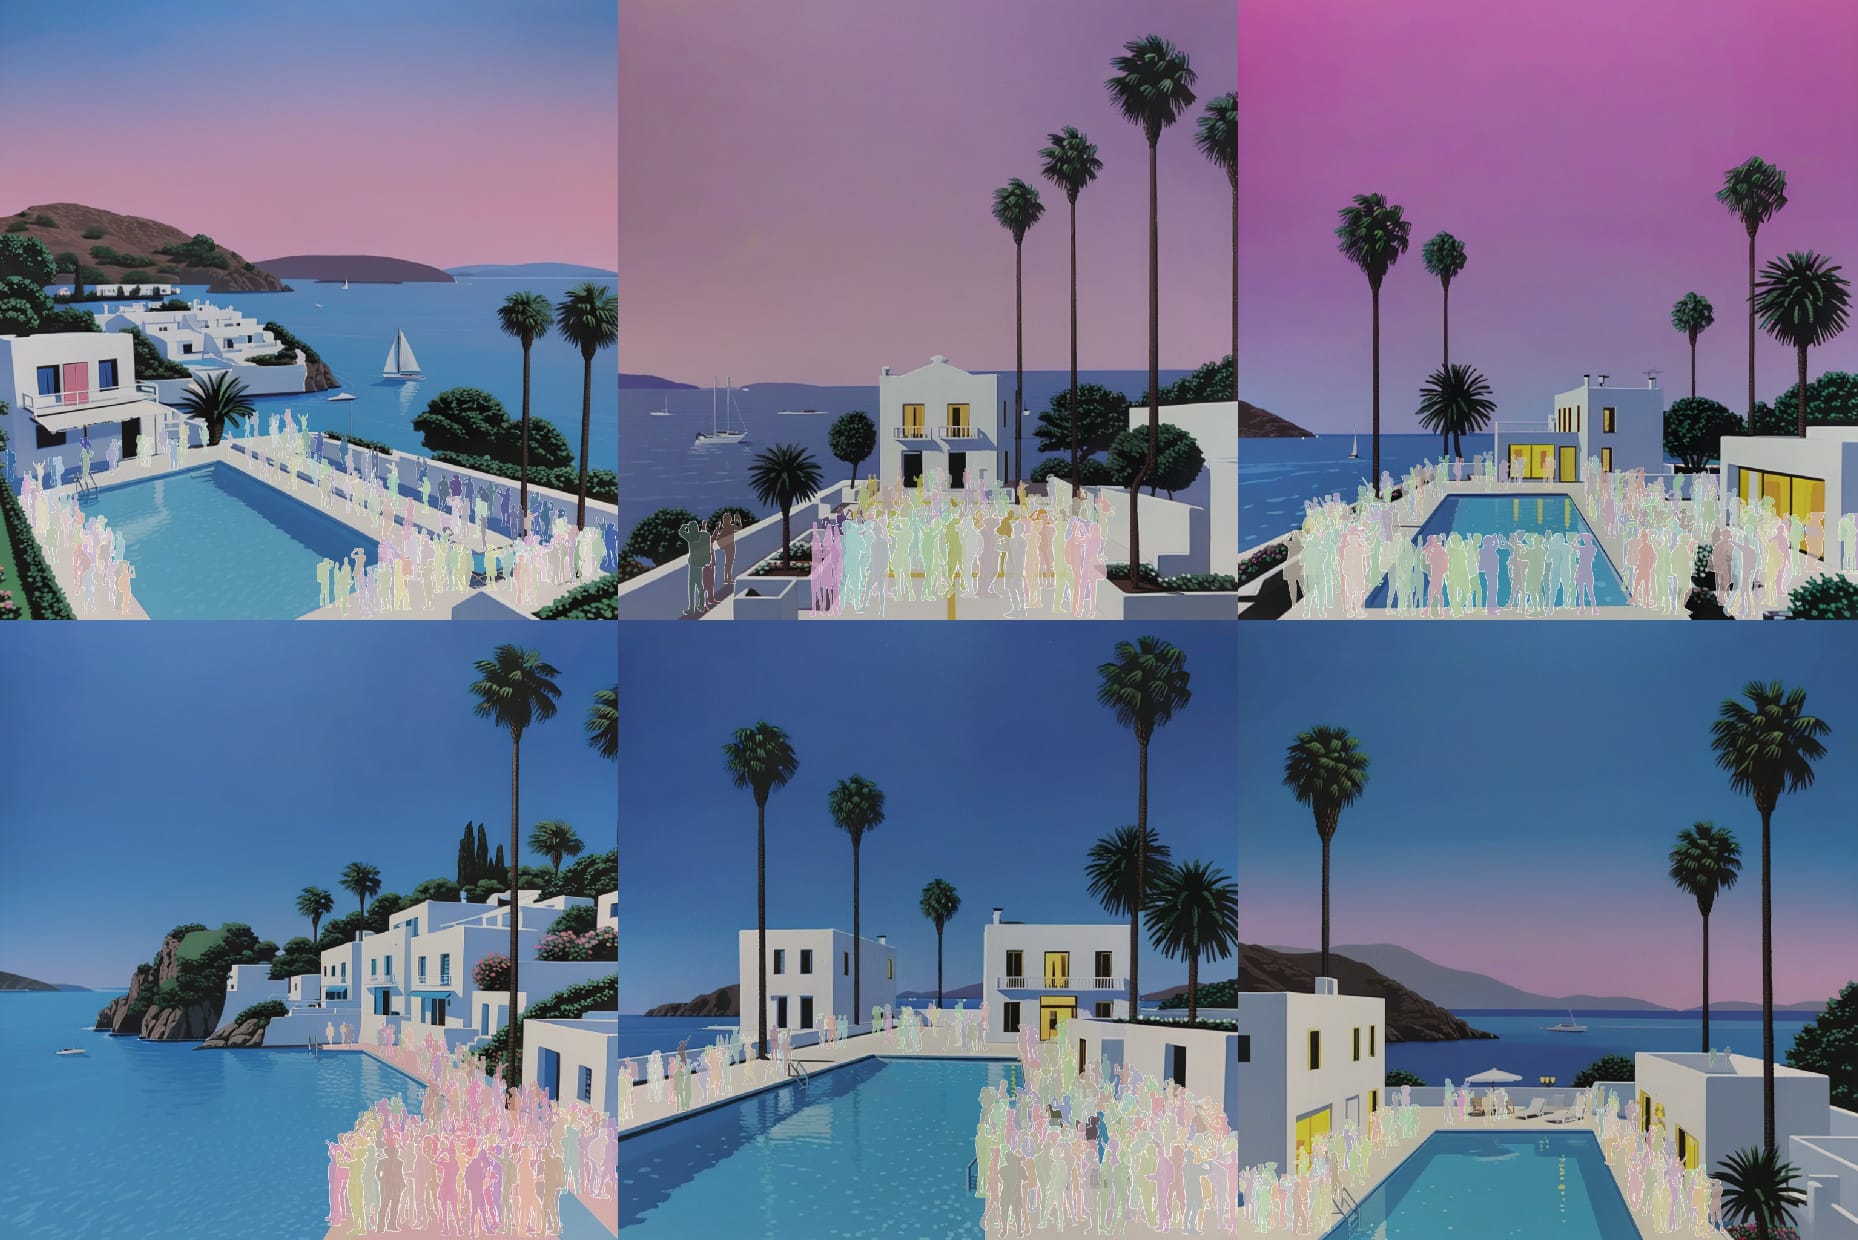
Below is a tool to extract specific settings of perspective and masks to be used in the following widget preview. The tool reads from a csv file that has recorded data of Greek tourism distribution, and we used a normalized value to populate the number of people as per each month.
Populated Images
The tool is then used to produce static images to be used inside the calendar preview and the json files are exported to populate crowds dynamically inside the widget
Widget
These are the representations in a widget form of how our calendar could be interactive according to overtourism days. More crowds pop up during summer peak months and almost empty during slow months. This also shows the beauty of in between months.
Peak Months
Slow Months
Interface
Below is our interface delivered through a Gradio web app: a full twelve-month calendar. Every month is a generated Cycladic scene in its own light and season. So instead of two months of chaos, you see a whole year of islands worth visiting . The app gives you suggestions and tips per month and has the option to download the calendar to print. It also gives you the option to generate new images for your calendar.