
Can graph machine learning read a real, complex high-rise the way it reads a clean dataset?
We try to both, understand how the building works as a circulation network, and predict what each room is from layout structure alone
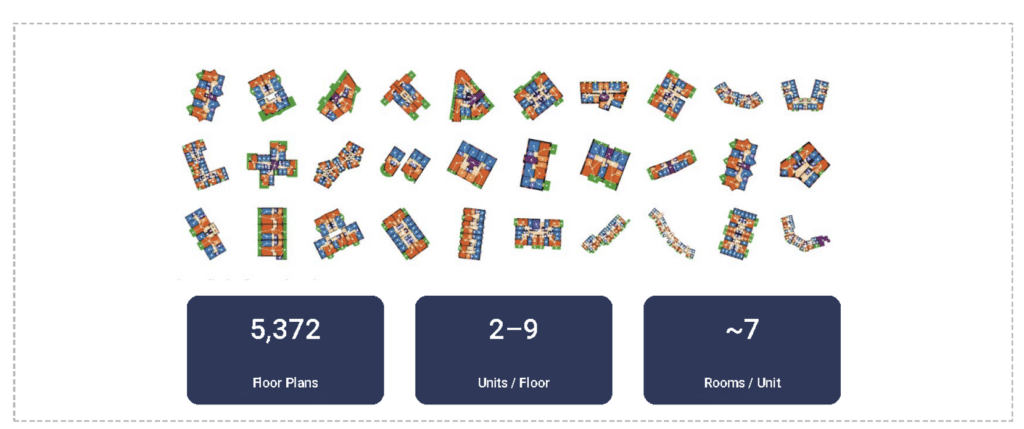
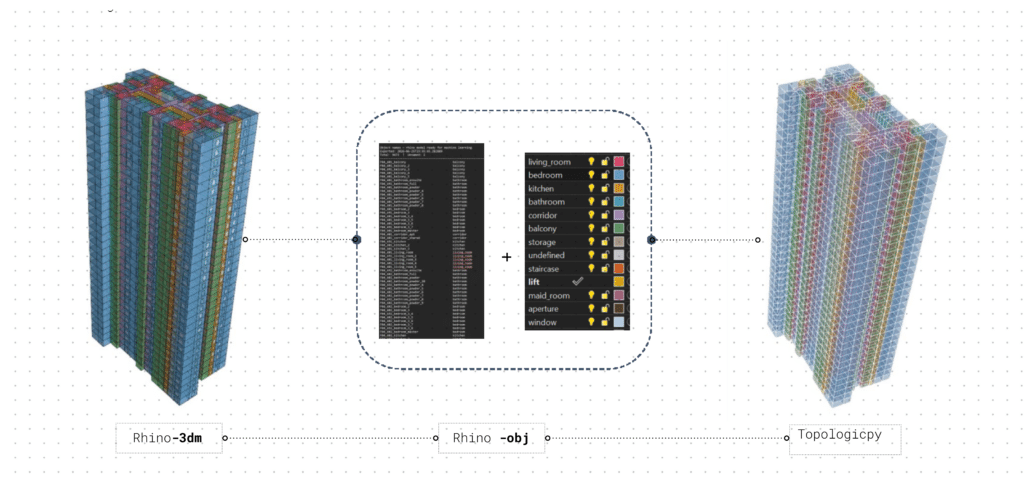
THE DATA SET
The dataset and the schema — the benchmark we force our tower into.
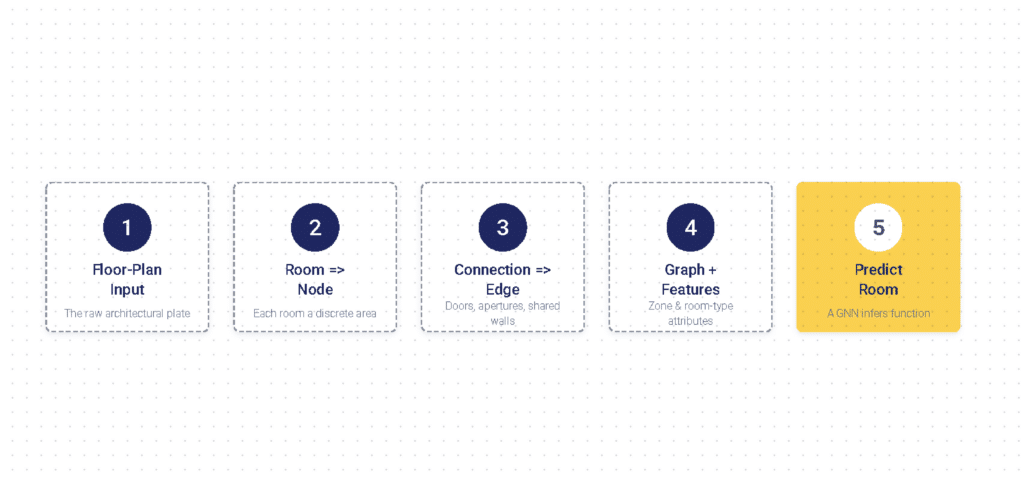
From Floor to Graph
the process
KIFAF TOWERS
Atkins Engineering, Dubai, UAE
The building, the levels we slice, and the hand-labelled ground truth.
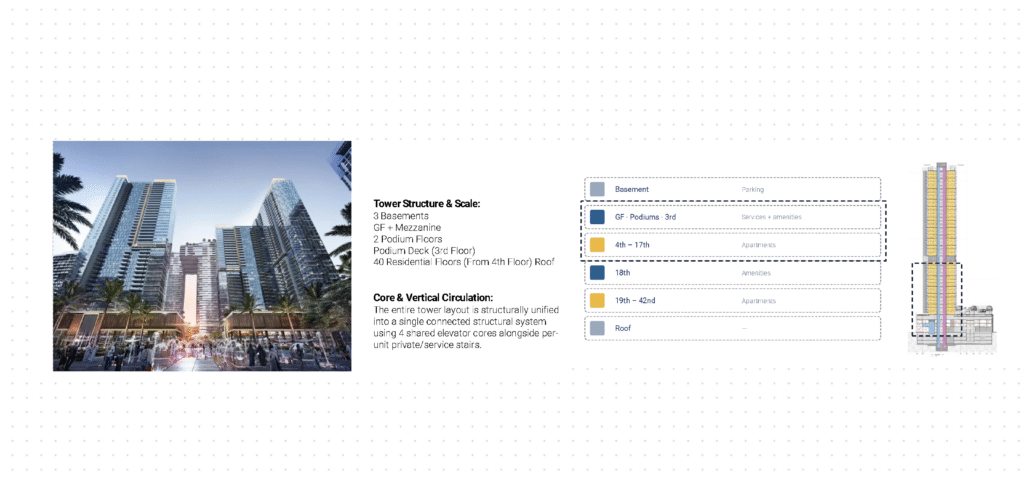
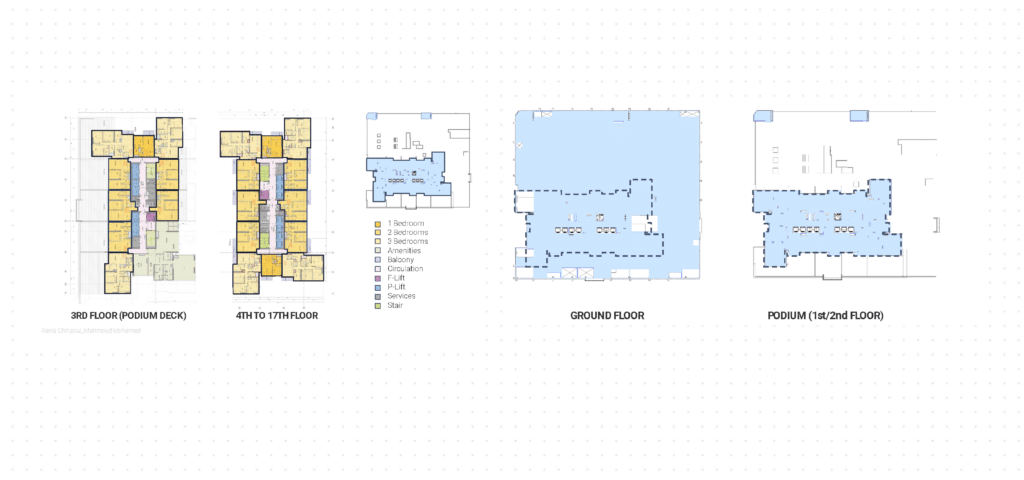
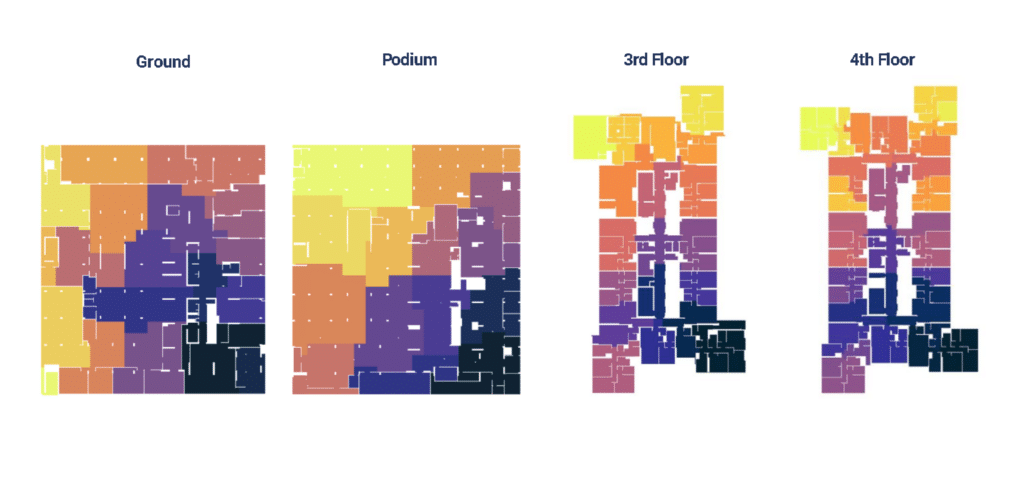
SCOPE OF SPATIAL STUDY
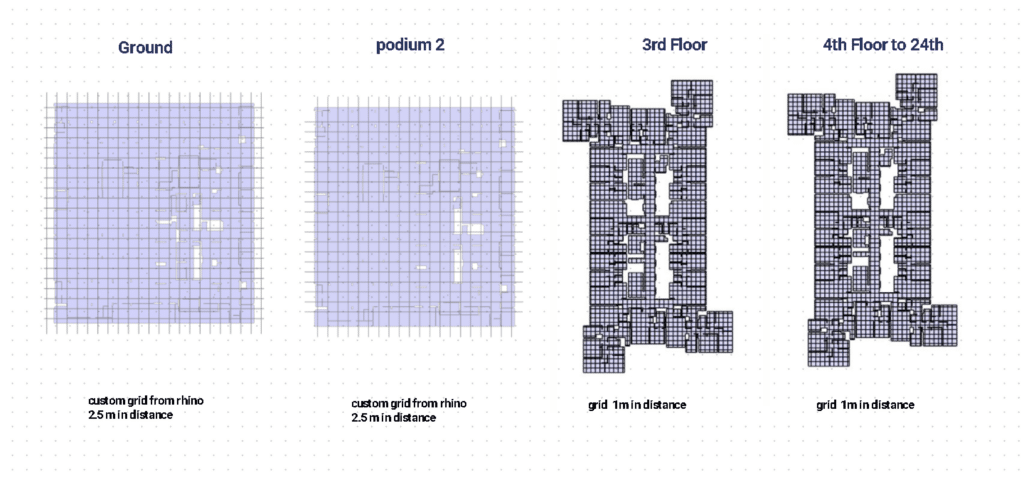
GF/ PODIUM +3rd/4th Floor- typical
GRAPH CONSTRUCTION
Space syntax in graph form — turning the feel of a plan into measurable numbers.
INITIAL SETUP: Edges, Nodes, Grid
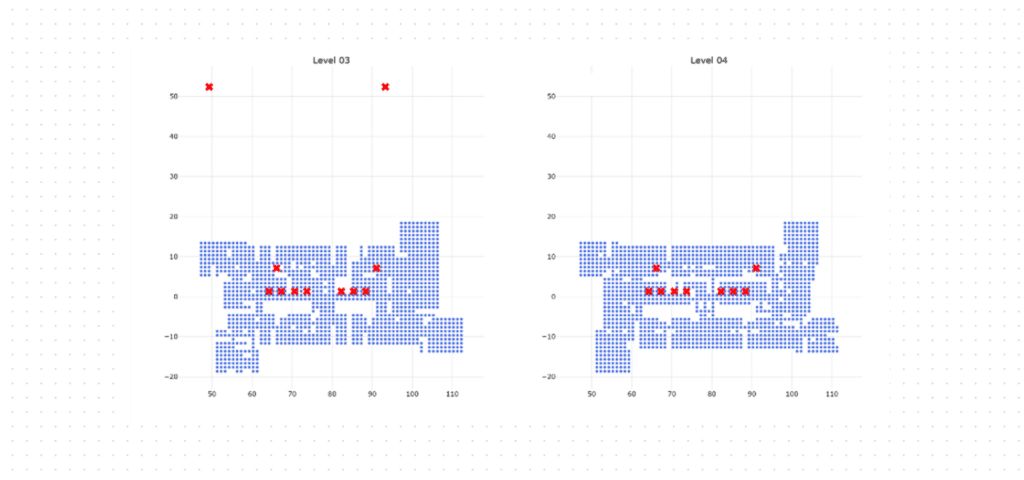
INITIAL SETUP: Stairs/Lifts
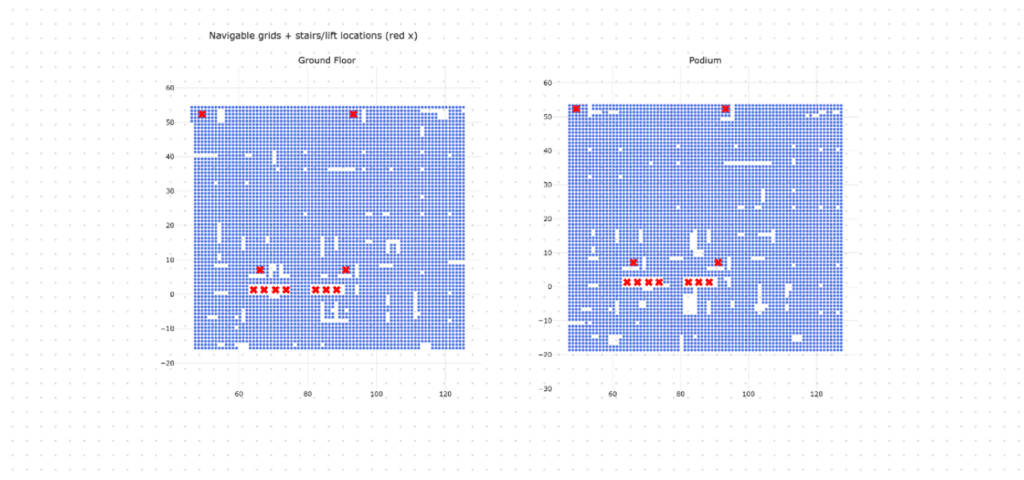
INITIAL SETUP: Stairs/Lifts
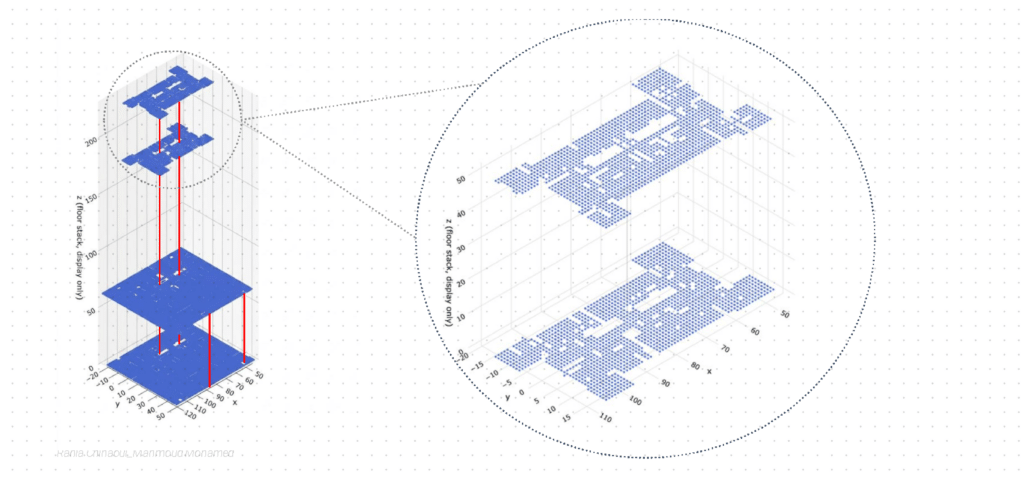
INITIAL SETUP: Combined Building Graph
SPATIAL ANALYSIS
Space syntax in graph form — turning the feel of a plan into measurable numbers.
SPATIAL GRAPH ANALYSIS: Shortest Path
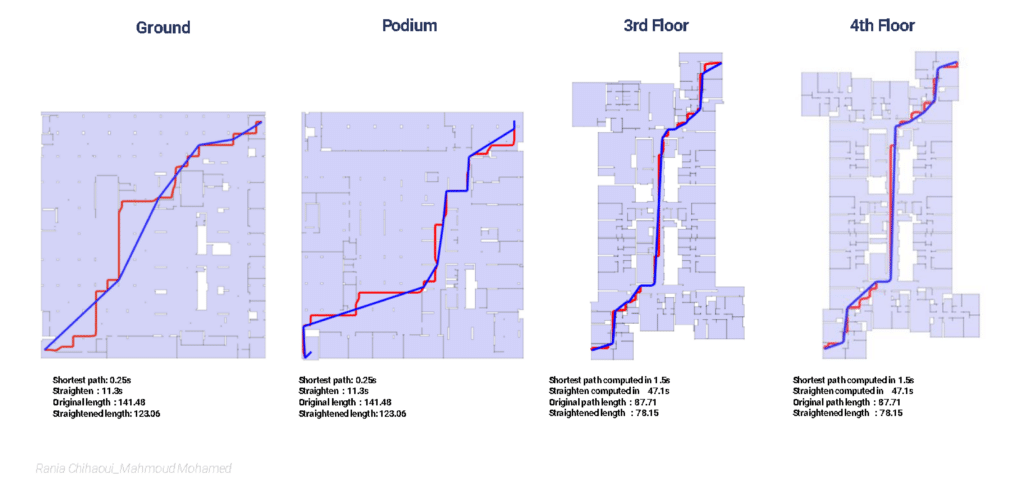
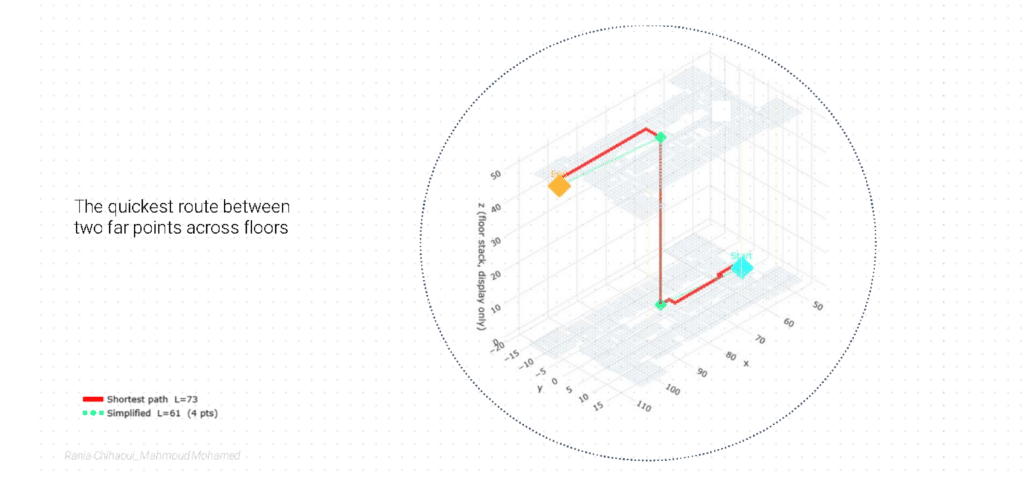
CROSS FLOOR SHORTEST PATH
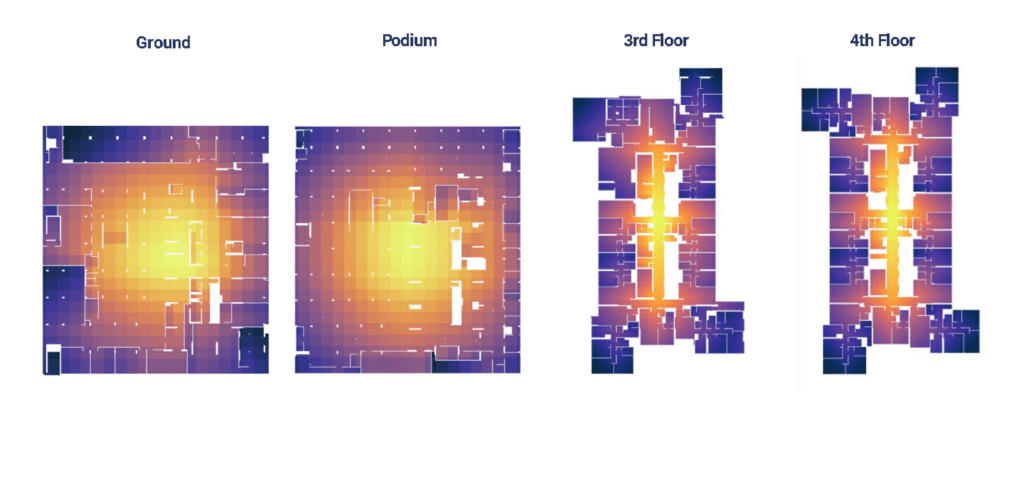
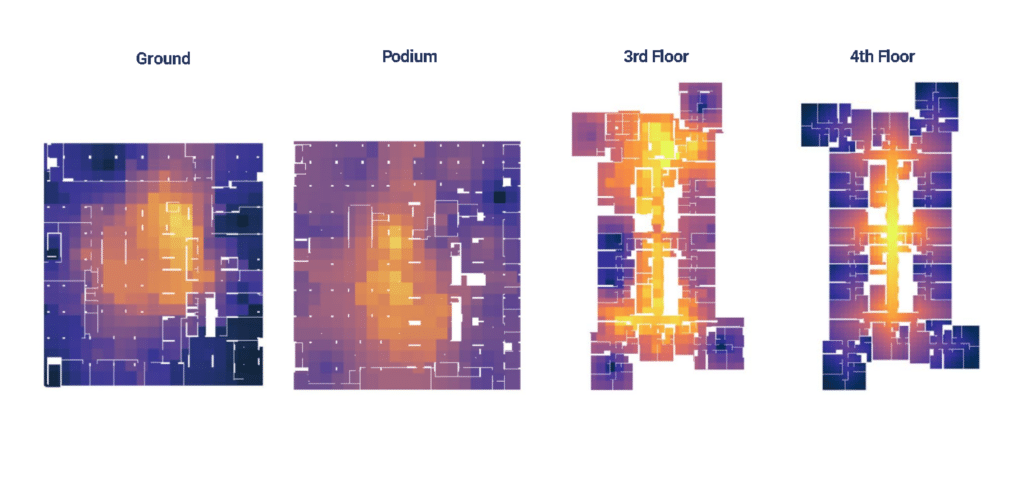
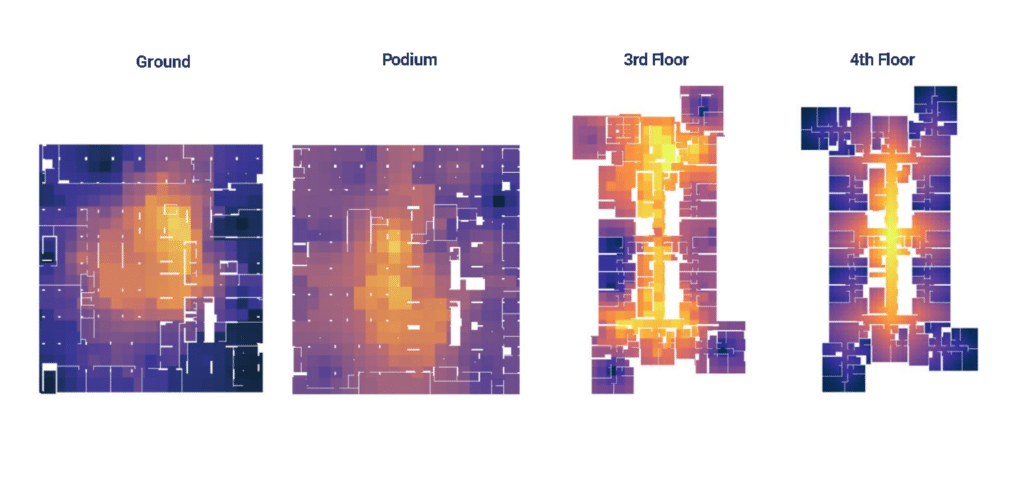
SPATIAL GRAPH ANALYSIS: Closeness Centrality
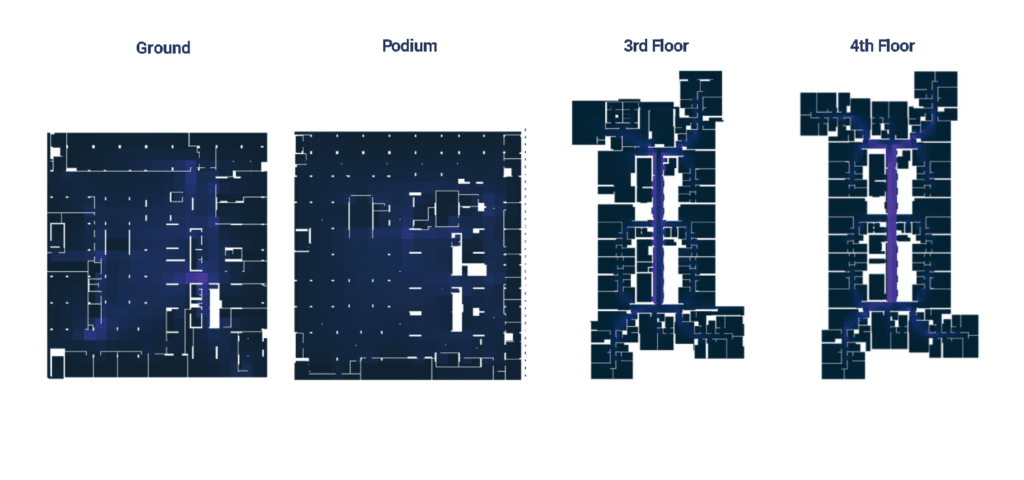
SPATIAL GRAPH ANALYSIS: Betweenness Centrality
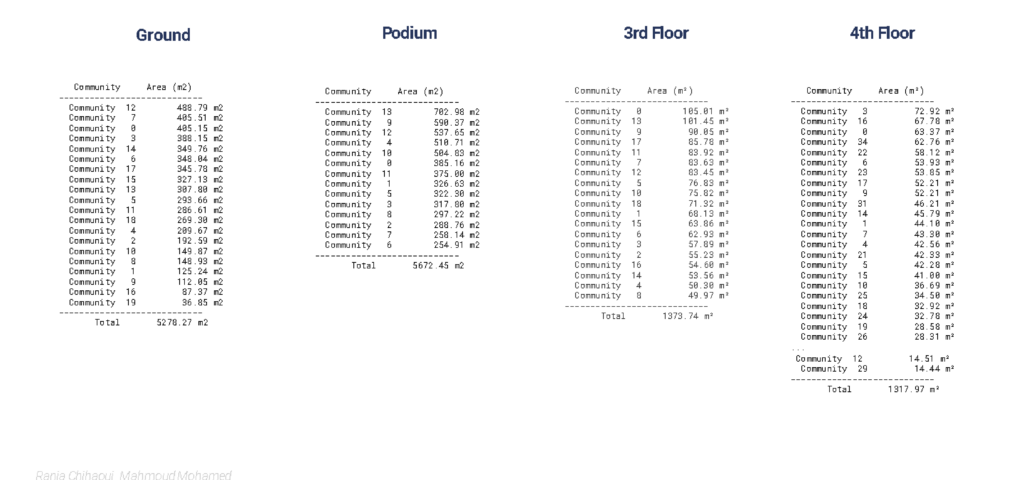
SPATIAL GRAPH ANALYSIS: Community
SPATIAL GRAPH ANALYSIS: Community –Areas
SPATIAL GRAPH ANALYSIS: Degree centralities
SPATIAL GRAPH ANALYSIS: Degree centralities
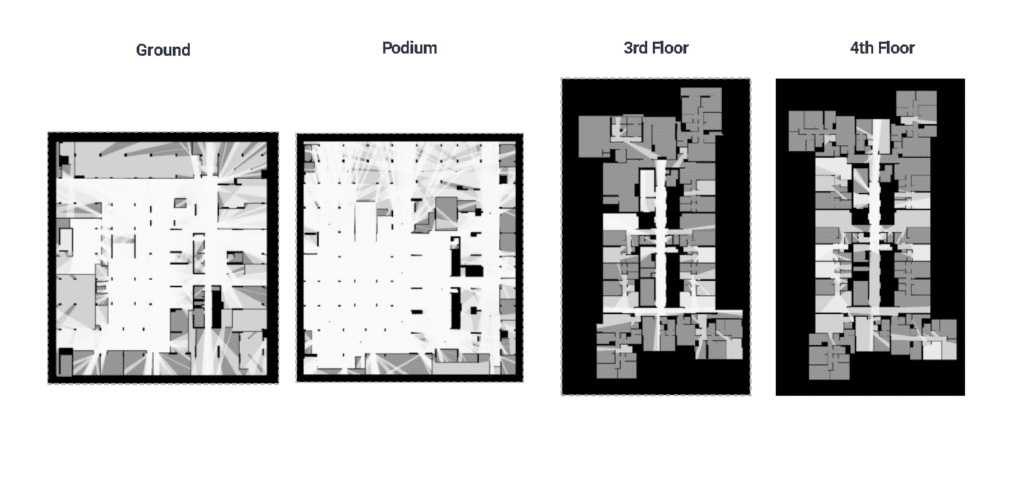
SPATIAL GRAPH ANALYSIS: Visibility Heatmap
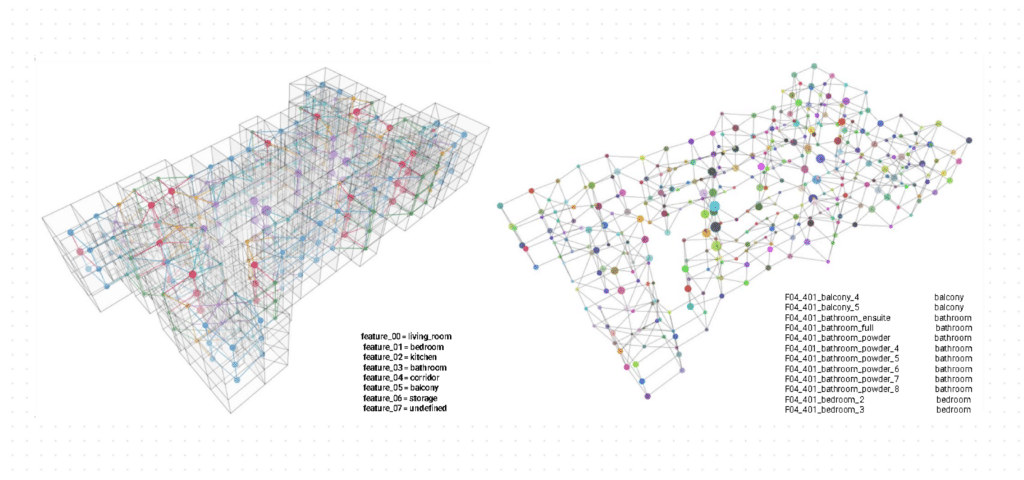
NODE CLASSIFICATION
Train a GNN to name each room from its features and its neighbours — then test on held-out rooms
BEHIND THE SCENE: rhino to TopologicPy
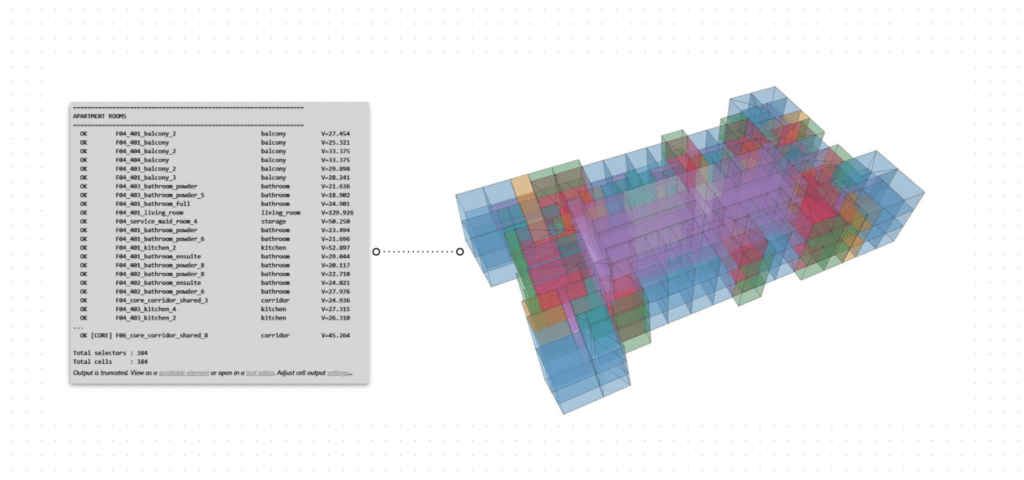
BUILDING THE CELL COMPLEX: Three Identical Floors
PERFORMING ADJACENCY GRAPH: Three Identical Levels
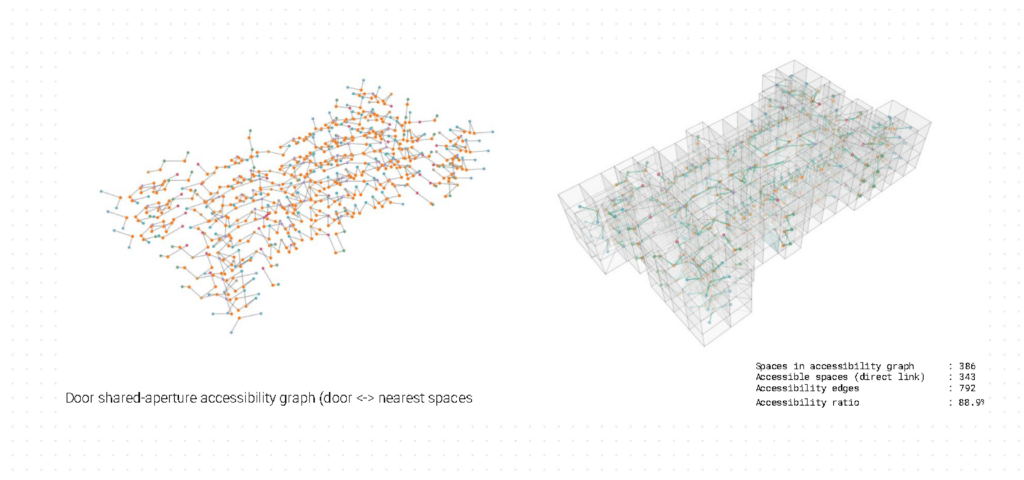
ACCESSIBILITY GRAPH
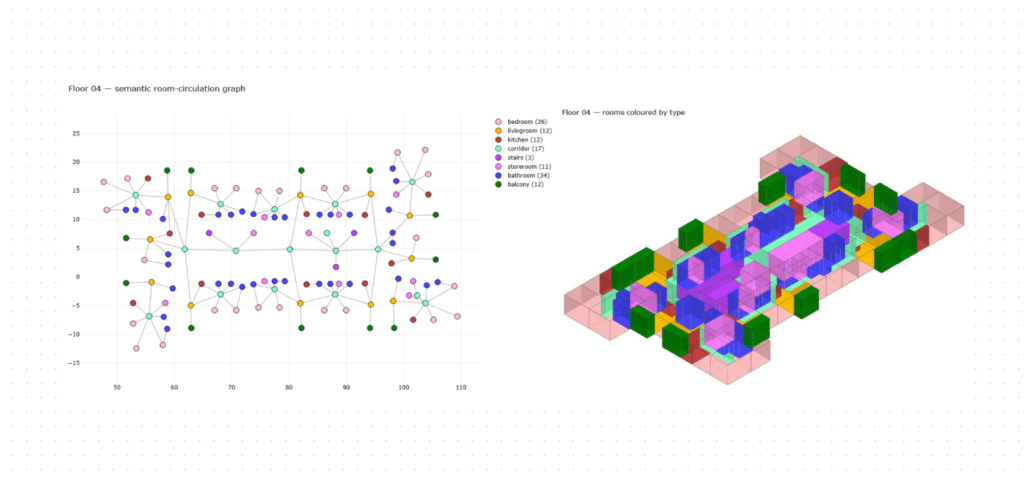
BUILDING THE CELL COMPLEX: One Floor

BUILDING THE CELL COMPLEX: One Floor
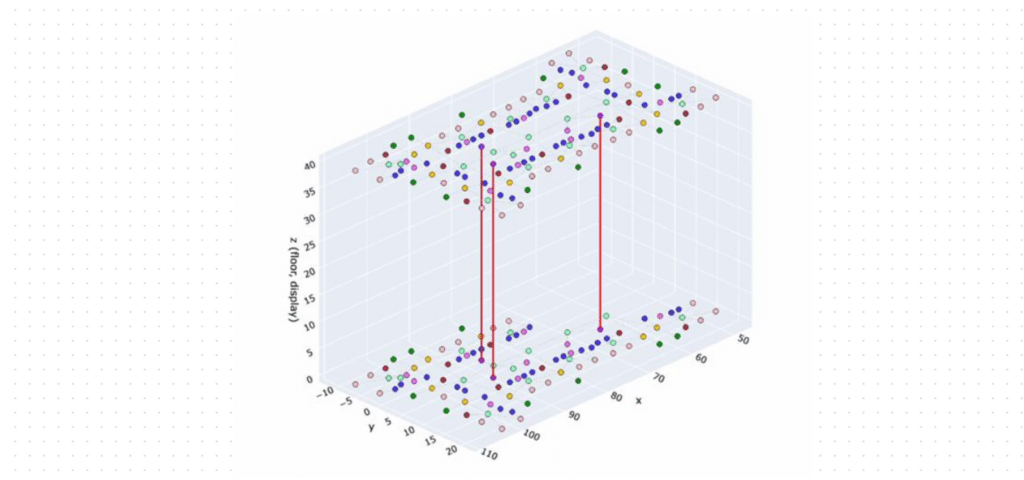
PERFORMING ADJACENCY GRAPH: Connected Levels
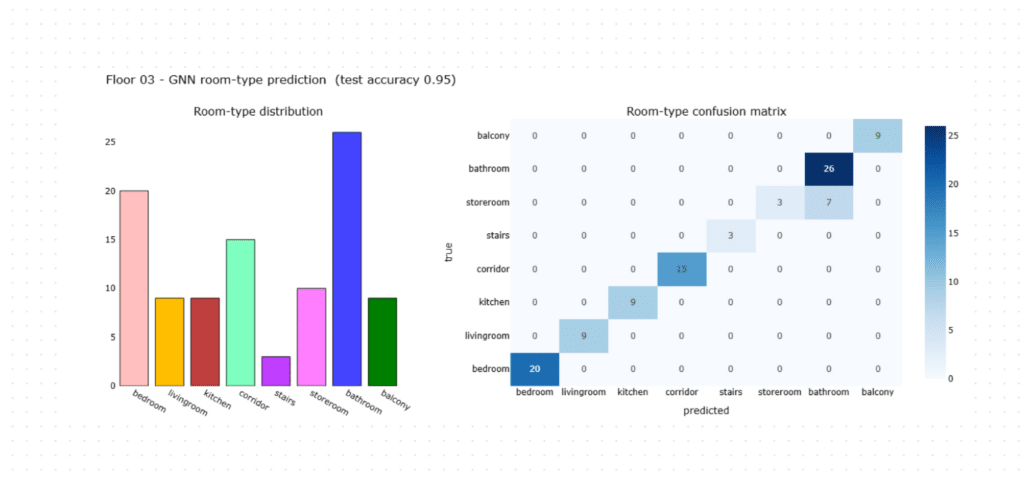
ROOM PREDICTION
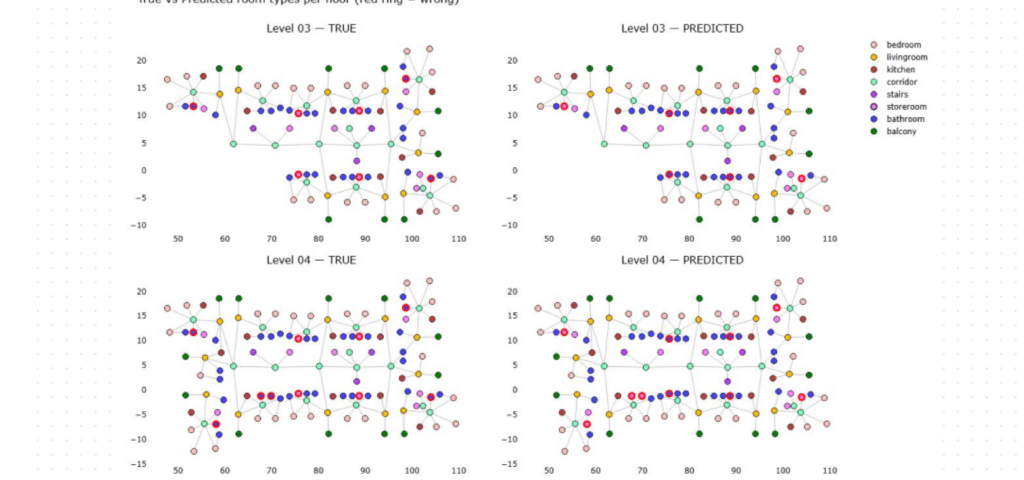
ROOM PREDICTION SUMMARY-3rd floor
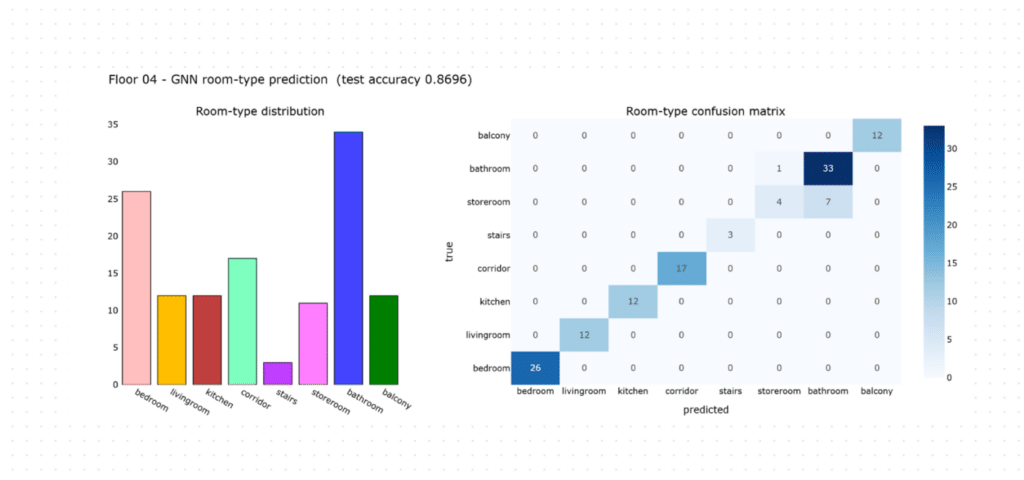
ROOM PREDICTION SUMMARY-4th Floor
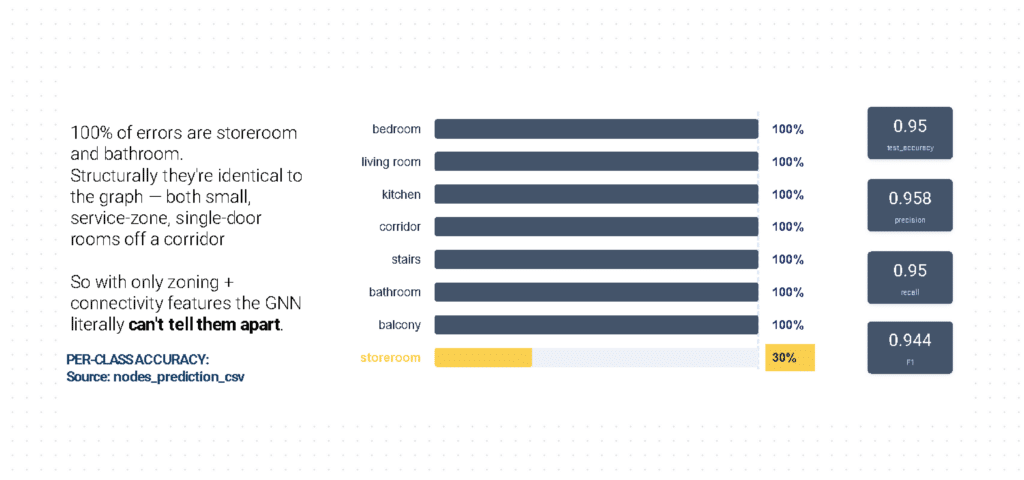
ROOM PREDICTION COMMUN ERROR
CONCLUSIONS
Can graph ML read a real, complex high-rise like a clean dataset? Mostly yes
We read Kifaf Towers two ways:
As a circulation network — closeness, betweenness and isovists pinpoint the corridors and cores that move people through each floor. Useful for wayfinding and evacuation.
As a room graph — a GNN names rooms from layout alone (~87% on L04, 95% on L03). A messy Rhino model can be auto-labelled like curated research data.
