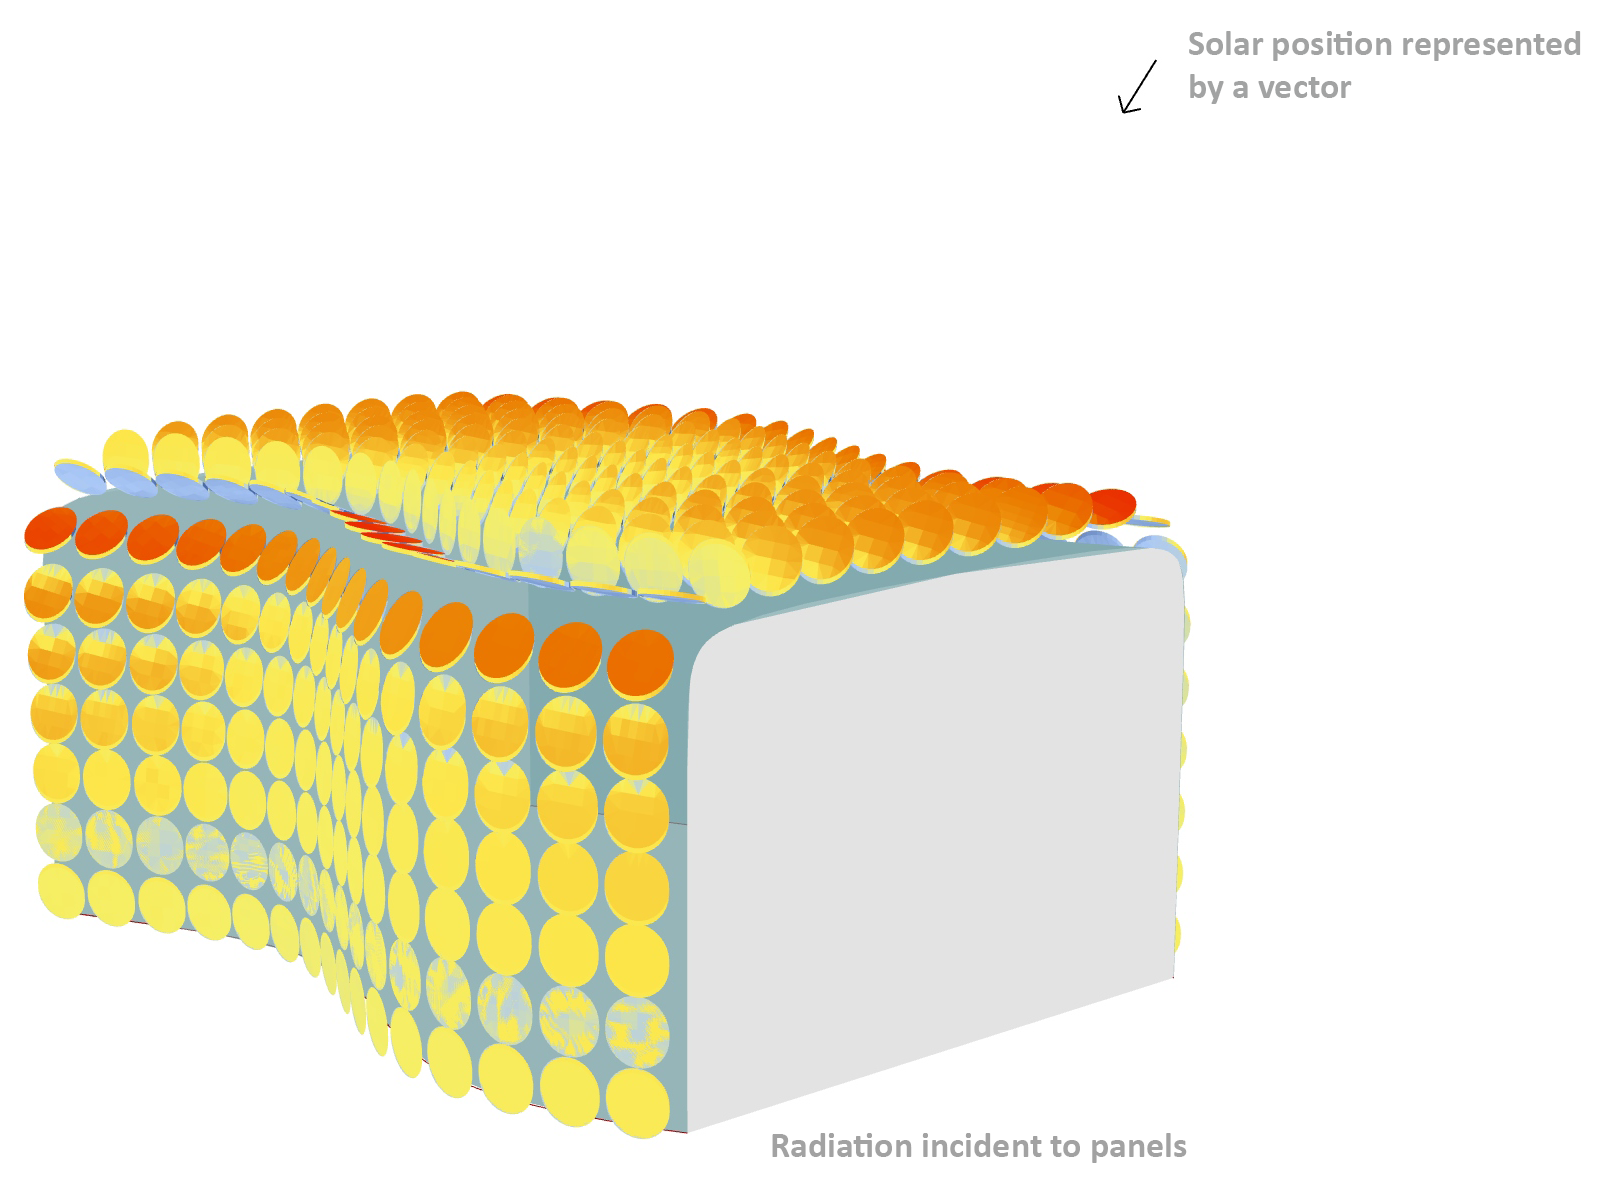
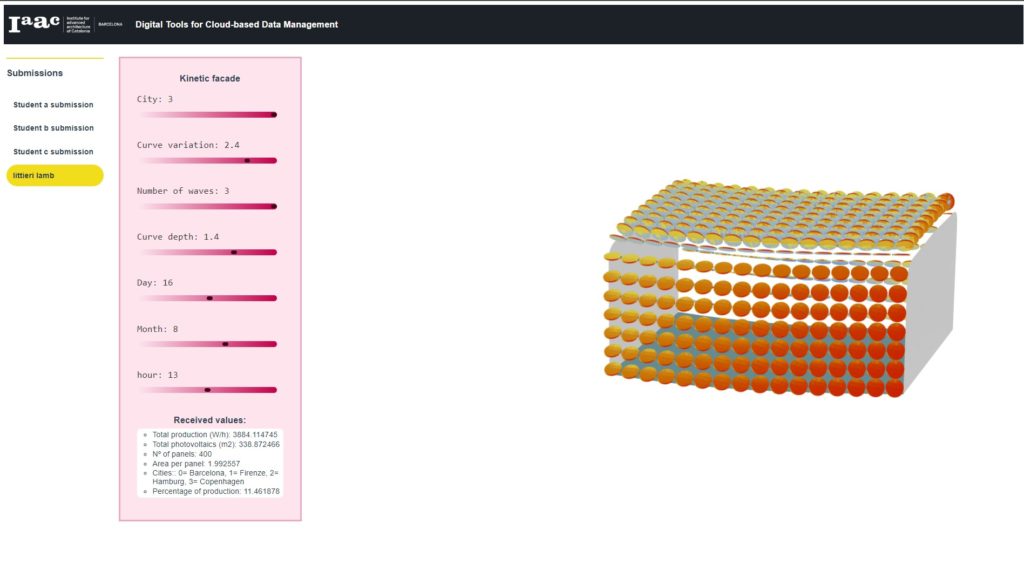
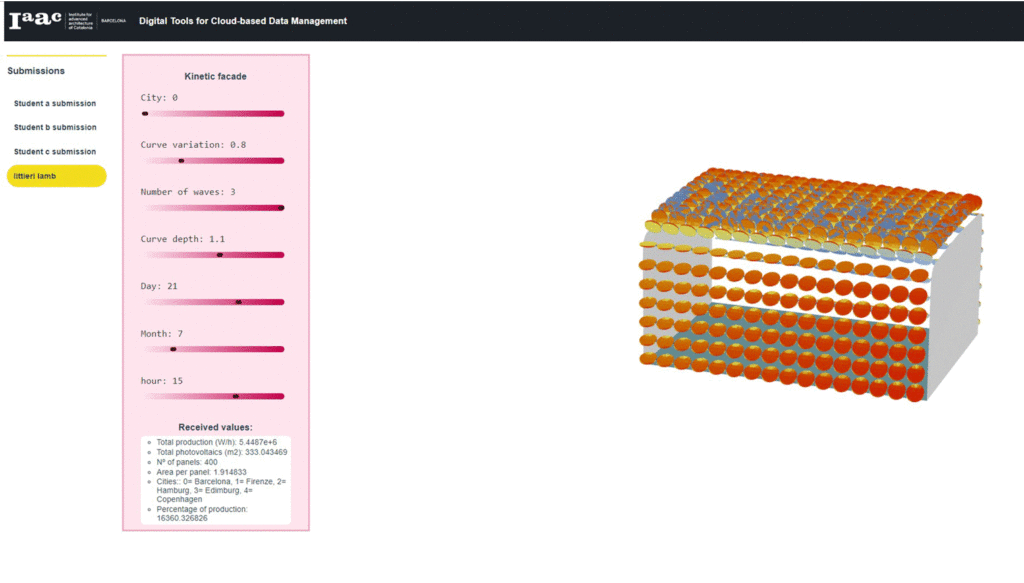
This sample was produced using Grasshopper, Rhino compute and visual studio (vue.js and css)
Concept: The UI is display for analysis of incident radiation quantifying potential for energy production through photovoltaic panels, testing different locations and using a solar vector as attraction point to move the panels along the sun trajectory to optimize the positioning.

This UI is divided in 2 vertical section: the left is set for the title, brief instructions, slider inputs and quantitative inputs, while the right side is set for geometrical visualization of outputs. The iterations set by the first slider refer to location (see UI instructions). The following 3 sliders refer to form iterations in size, curvature and depth of curvature, while the last 3 sliders correspond to sun vector regarding day, month and hour in direct relation to the location set in the first slider. Outputs express the potential of this setup through photovoltaic capacity, total area of panelization, and percentage of panelization area producing energy at the specific time and location, as the number of panels and area of one standard panel.


Future development: Future steps should enlarge the set of locations, variety of panels and allow the input of conceptual geometry by the user.

