
Undertaken by: Avi Sharma
Hypothesis :
Exposure to Music correlates with variations in Mental Health among people.
We all know that listening to music can evoke various emotions, depending on the song. What I am exploring is the idea that exposure to music, in general, can play a role in shaping your overall mental health and engagement with certain behaviors.
Step 1: Establishing a Basemap for Analysis:
To undertake this research, I have selected New York City as my study locale, as it is often—and correctly—associated with music and creative arts.
I started with a neighbourhood level map of the New York City. However, the data used for the Mental Health statistics is distributed in a different segregation of zones. These zones were represented by UHF Codes which is a group one or more zipcodes.
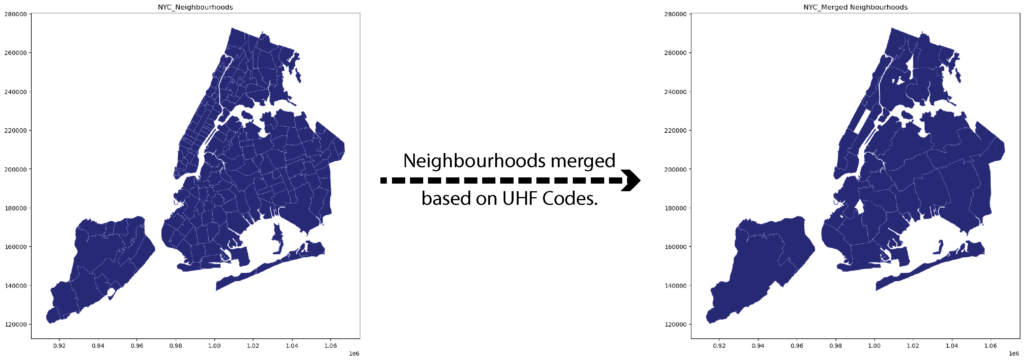
So, in order to proceed the study I merged the neighbourhoods based on UHF codes with their zipcode identifications being the merging key.
Step 2: Adding data about Mental Health to the Map.
1. Mental Health Statistics:
To explore the statistics related to mental health conditions, I used a dataset based on a survey conducted by the Department of Health and Mental Hygiene. The dataset explores the prevalence of depression in NYC from 2018.
2. Mental Health Indicators:
In many cases, depression statistics may not account for a large group of people due to various factors, such as denial or lack of diagnosis. To address these potential inaccuracies and broaden the search criteria, I also looked into behavioral indicators of mental health.
The dataset examined includes information on binge drinking, which is defined in the dataset as ‘consuming five or more drinks on one occasion for men, and four or more drinks on one occasion for women, in the past 30 days.
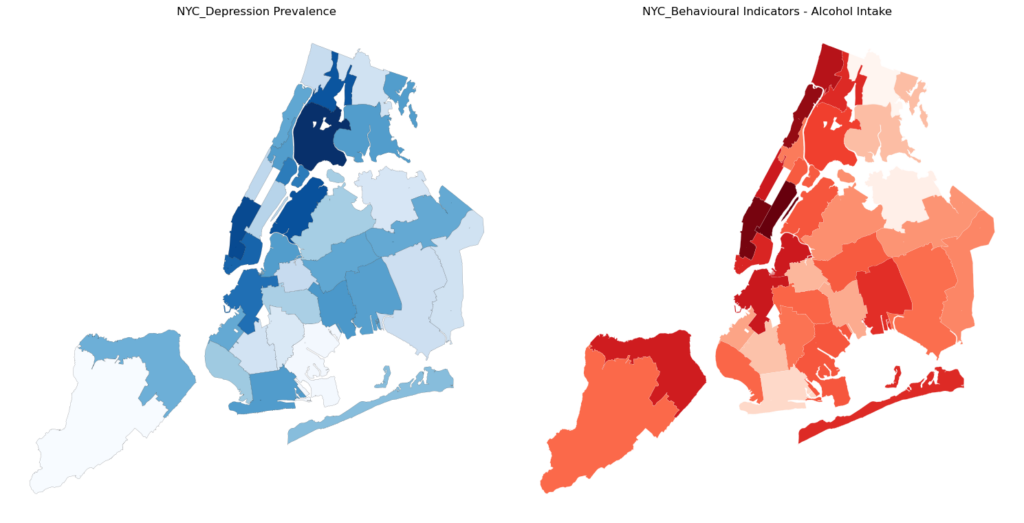
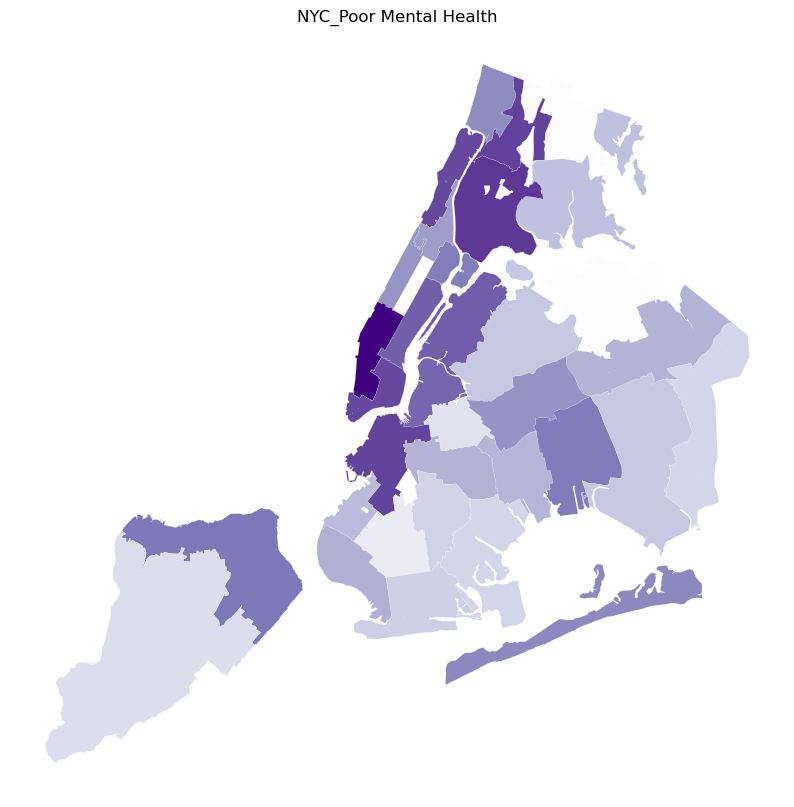
Here, we see the two maps highlighting various neighbourhoods based on the characteristics shown. However, while the maps display separate statistics, they collectively illustrate the prevalence of poor mental health across the population. For the purpose of this study, these insights can be merged into a single map for a more comprehensive analysis.
Step 3: Adding data for Music to the Map
Exposure to Music:
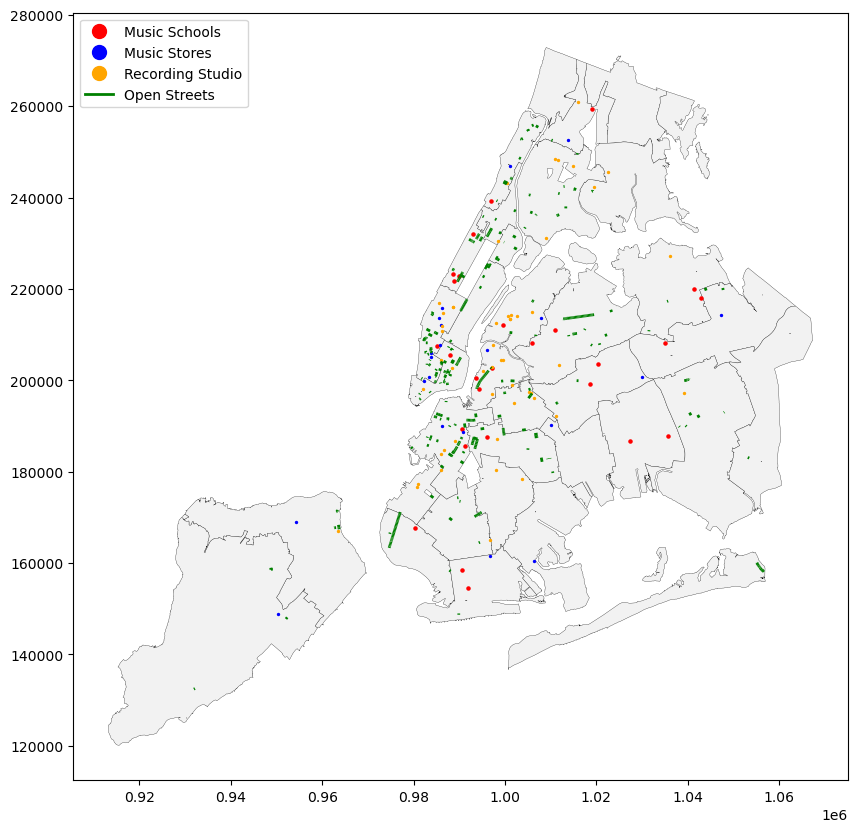
To understand people’s exposure to music in various neighbourhoods, I chose to examine datasets that quantifies the number of music-related institutions and their density across different neighbourhoods.
The institutions I looking at are:
1. Music Schools
2. Recording Studios
3. Music Stores
4. Street Performance Locations
Google Maps API
The first few datasets for the correlation were imported using the Google Maps API. So, before we delve into it lets outline how it works:
1. Google Maps API runs a code to do a keyword search, which in this case were ‘Music Schools’, ‘Recording Studios’ & ‘Music Stores’.
2. The code ran to find the locations based on keyword, finds the required location based on co-ordinates of the centre point of the city, which then takes a radius to establish a search area.
3. The API has a limit to explore only 60 results, which are then exported to a CSV.
4. Google API, is used again to add a column of ‘City’, to the created CSV, which we would use later for filtering the data. Since with a 50km radius, the result come back with some locations from outside of New York too.
Note: Although this method does not give the actual densities of various music institutions in different neighbourhoods of New York, the top 60 results of the above given keywords should be reflective of these densities and hence are used as proxies for the actual dataset.
Additionally, a dataset from NYC Open Data allowed me to map the Street Performers locations, and locations reserved from street parties.
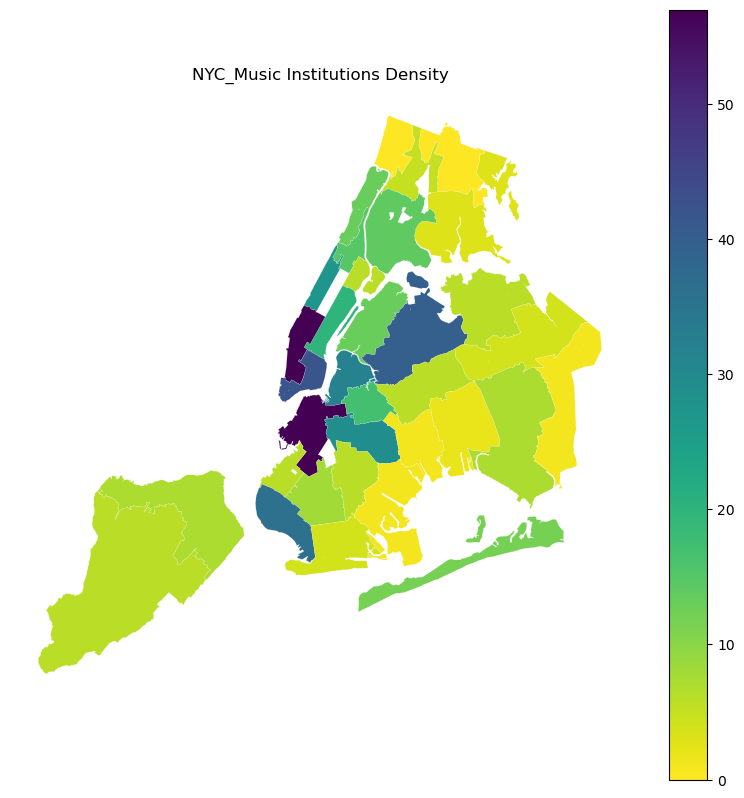
Step 4: Finding density of Music Institutions
To calculate the density of music institutions, I performed a simple ‘points per polygon’ analysis and then integrate that information into the base GeoDataframe.
Step 5: Correlating the Maps
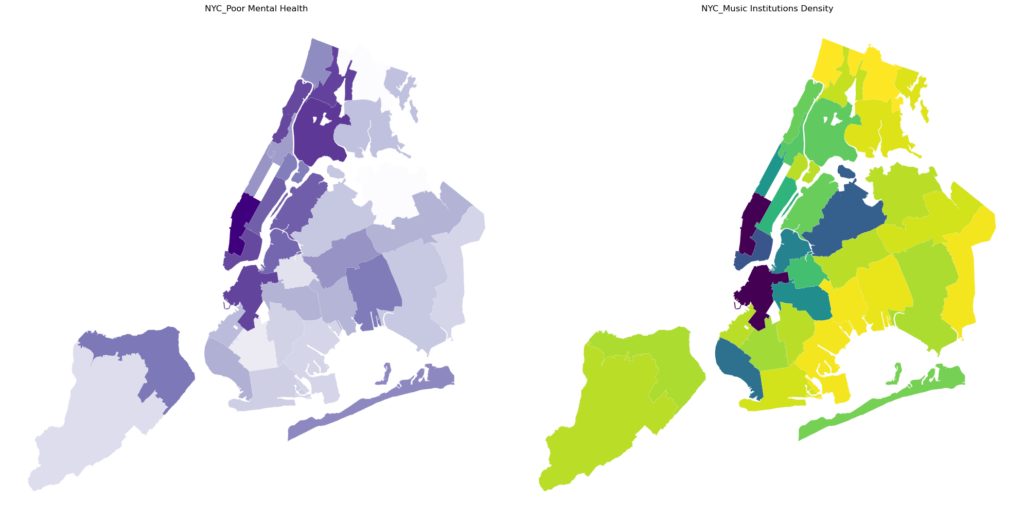
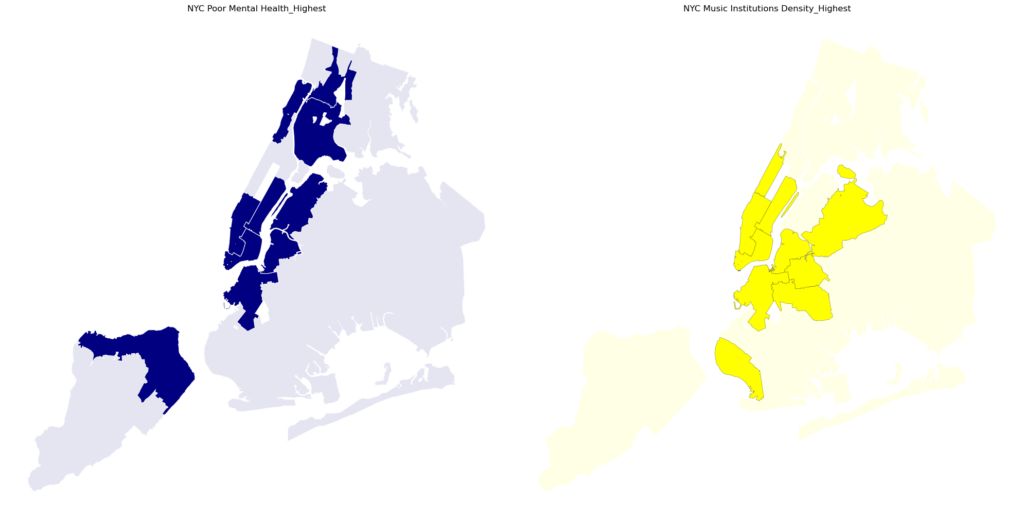
Now that we have plotted the two maps, identifying a correlation with the current color maps may be challenging. To more effectively check for a correlation, we will filter the data as follows and conduct a re-examination:
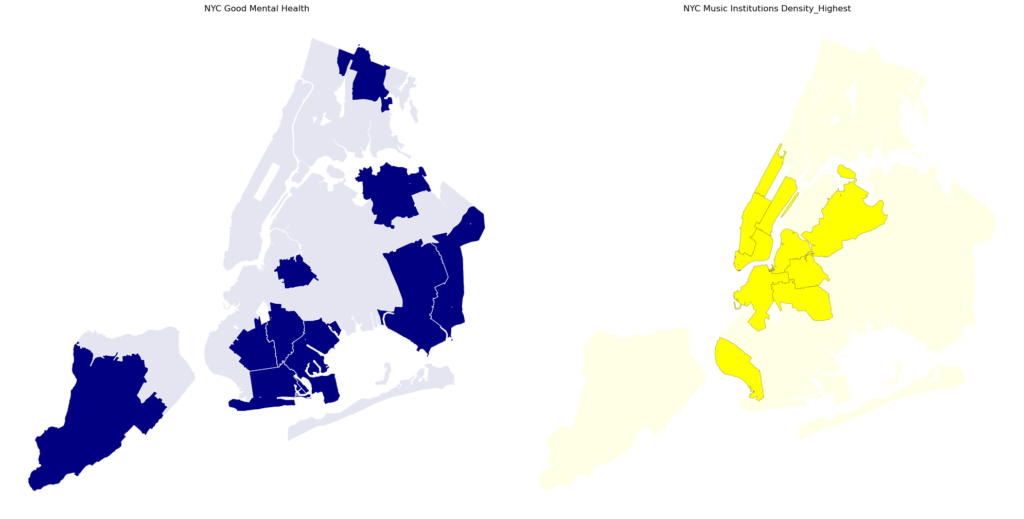
Correlation: Bottom 10 Poor Mental Health (Good Mental Health) – Top 10 Density of Music Institutions
Based on the maps plotted, it appears that, the distributions are almost avoiding each other. This observation may suggest that the opposite of the initially hypothesized correlation could be true. Let’s investigate this further.
The analysis of the two maps does reveal as a correlation as predicted. 5 out of 10 neighbourhoods seem to show correlation, which is a more significant finding compared to the analysis where we compared 10 neighbourhoods in the reversed correlation scenario.
Further, to make sure the corelation seen above is true and not a matter of chance, I will plot the above maps again but with only showing the top 5 regions in both the maps.
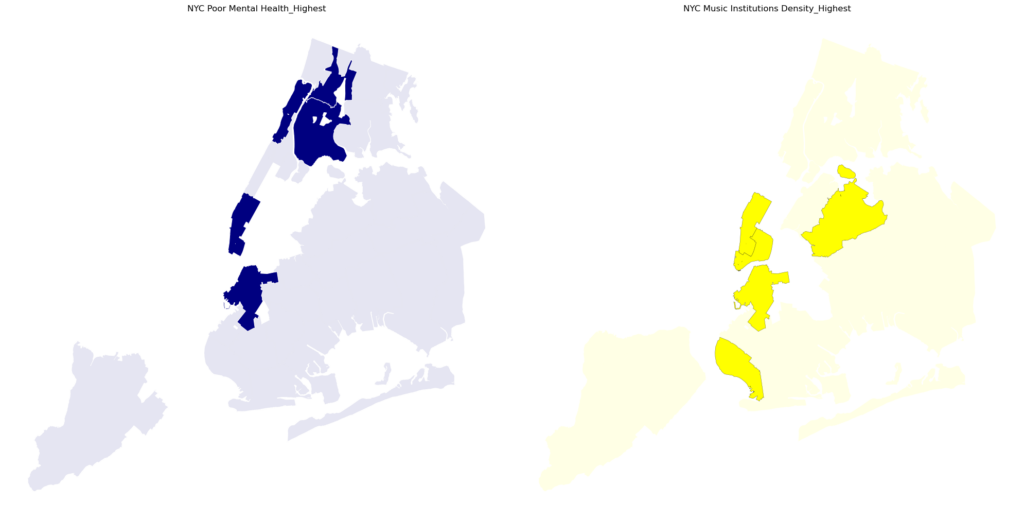
At this point we see that out of the top 5 regions in both the maps, 2 out of 5 regions that show up are the same and, the percentage of regions corelating actually came down from 50% to 40%.
Conclusions:
So, due to the ambiguity of the results seen, I would conclude my study by these four separate statements;
1. The density of music institutions may lead to increased movement and stress in the environment, negatively impacting people’s mental health rather than improving it. However, this assertion might be speculative, considering the limited similarities observed in the maps.
2. The density of music institutions may not have any significant impact on mental health, and any observed correlation could be spurious. Yet, the evidence of a correlation is too minimal to even categorize it as such.
3. The dataset used to study the correlation might be incomplete, suggesting that the research should be conducted again with more comprehensive data covering the entire city.
4. The research is inconclusive, indicating that further study is necessary to draw any definitive conclusions.
Sources:
1. Mental Health Issues & Indicators
https://a816-health.nyc.gov/hdi/epiquery/indicators ‘Mental Health Datasets’
2. UHF Codes to merge neighbourhoods for Basemap
https://data.cityofnewyork.us/City-Government/2010-Neighborhood-Tabulation-Areas-NTAs-/cpf4-rkhq
3. Music Schools, Recording Studios & Music Stores – Google Maps API
4. Street Performance Locations
https://data.cityofnewyork.us/Health/Open-Streets-Locations-Map/6vys-sfk5
