The aim of the project is to predict trip duration, using 2016 NYC YELLOW CAB TRIP DATA.
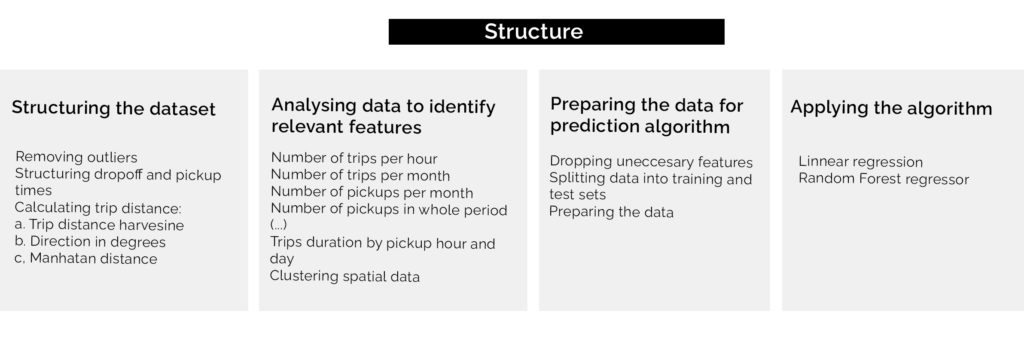
Structuring the dataset
The analysis begins with outlier identification. The passenger_count variable has two outliers: 0 and 9, which compared to the amount of people allowed by the NY Limousine law, is impossible. Also, there were some pickup and dropoff locations that were outside NY boundary. And lastly, A max trip_duration of 3526282.00 sec (~ 980 hours) was also identfied as an oulier. The specific values used in your code to remove coordinate outliers are based on the geographic bounds of New York City, which is where the taxi trips in the dataset are assumed to have taken place. The longitude range -73.75 to -74.03 and the latitude range 40.63 to 40.85 cover the geographic area of New York City, and filtering out any data points outside of this range helps to remove any potential outliers that may be caused by errors in the data or trips that occurred outside of the city.
First, we have to convert pickup_datetime and dropoff_datetime to datetime objects and create new features for the dataset. As a second step, the distance between pickup and drop off locations will be calculated. Since there is no data available on the route, 3 distance calculations are taken into consideration: a. Trip distance haversine (used for calculating the great circle distance between two points on the earth (specified in decimal degrees) b. Trip direction c. Manhattan distance
Analyzing data to identify relevant features
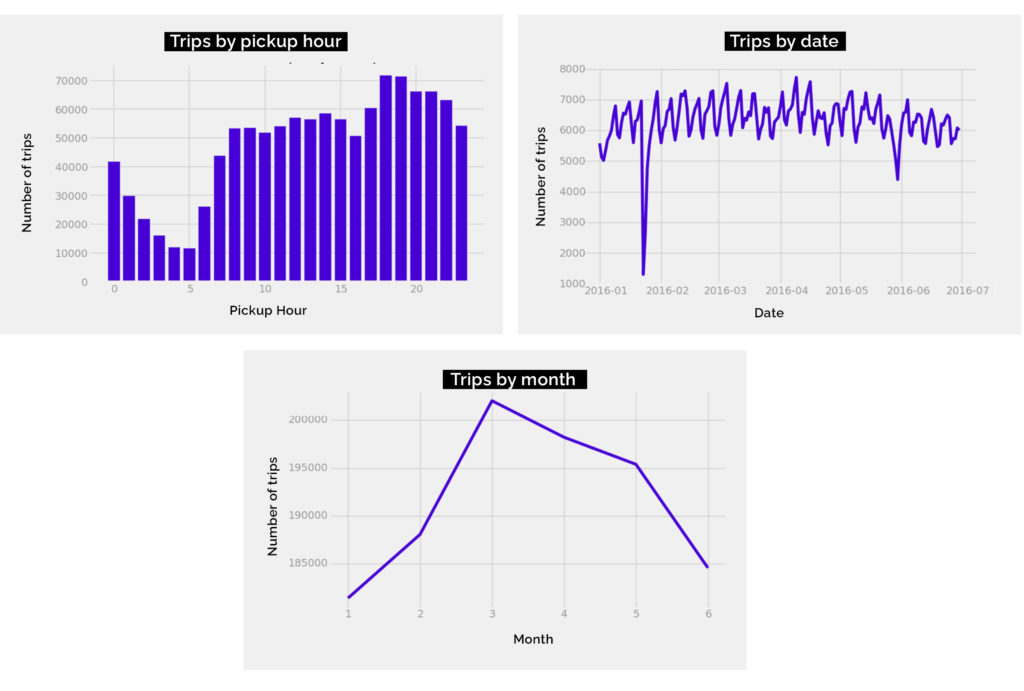
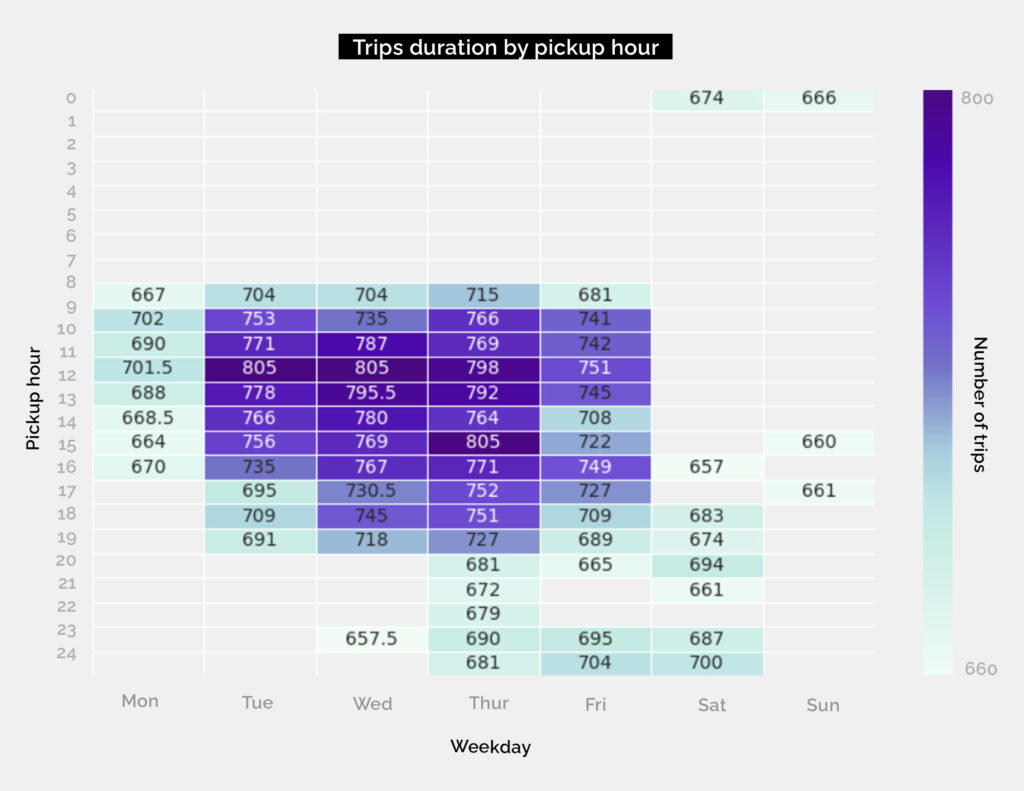
To sum up the analysis we can see that the most important features are pickup hour, in the weekends there is a very big drop of number of taxi rides. The chart with number per pickups per whole period indicates 1 outlier, that probably might have happened because of some external reasons. If there was a need to investigate it further, additional datasets, such as weather data, would be uploaded.
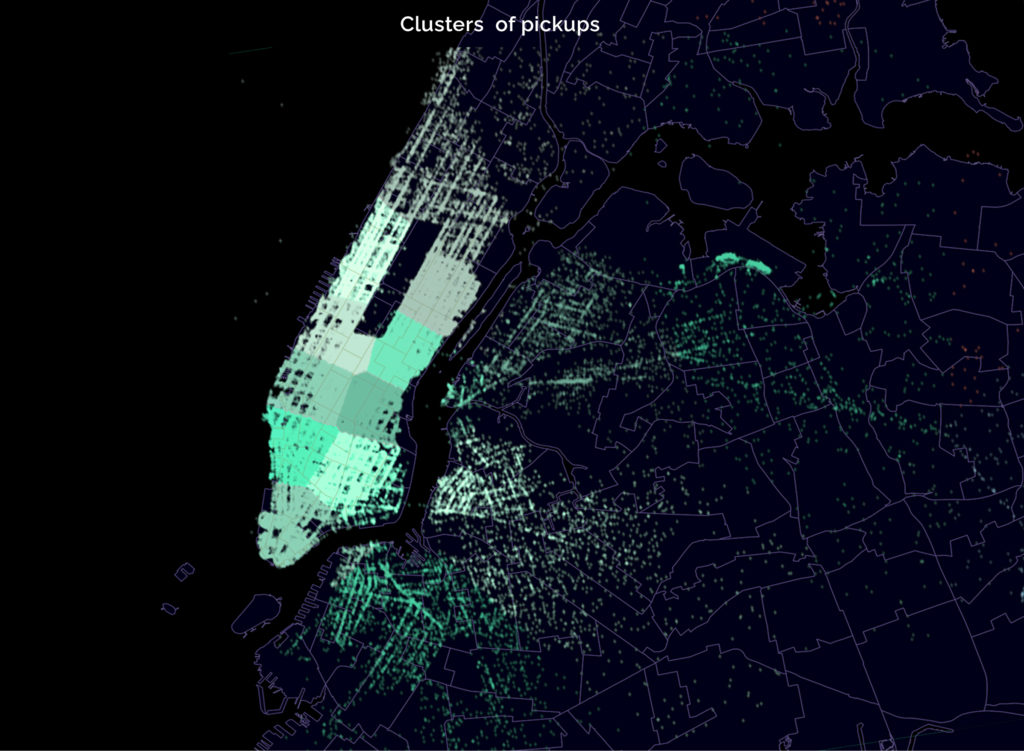
Next, the spatial data clustering is being carried out, raising a hypothesis that it will influence the prediction. Unfortunately, it does not do it very well, so in the end it is not included to the prediction.
Applying the algorithm
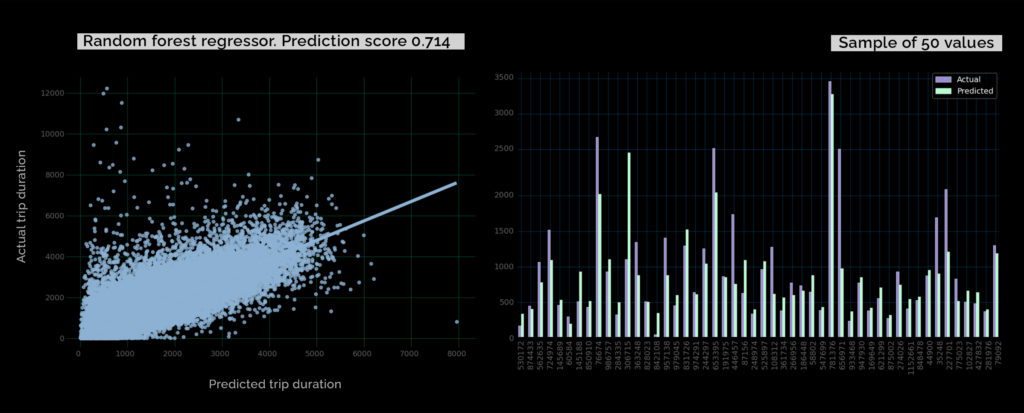
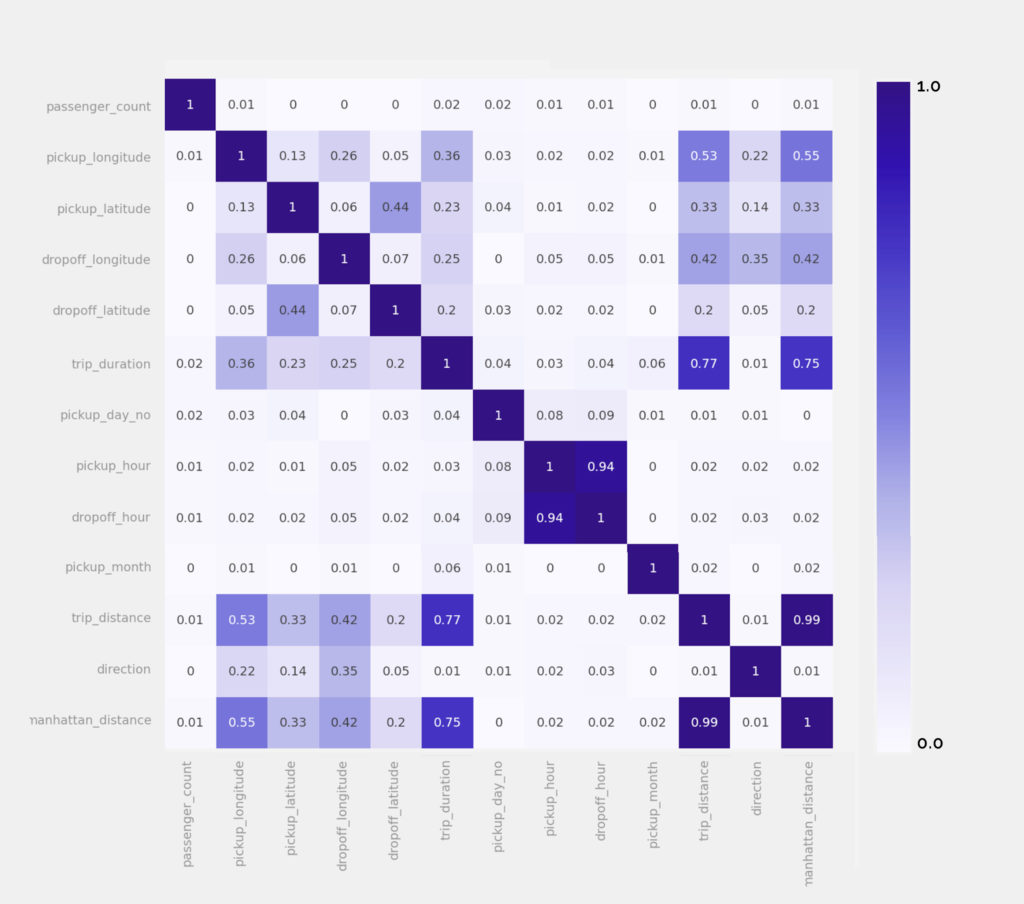
For the final prediction only specific features were chosen: passenger count, trip duration, pickup day number, pickup hour, drop off hour, pickup month, trip distance, direction and Manhattan distance. R2 score of linear regression model was 0.6014. Therefore Random forest regressor was applied, which improved the prediction precission.