INTRODUCTION
The development of smart cities has become an integral part of modern urban planning as a result of rapid urbanization and technological advances. This thesis examines the rapidly growing field of artificial intelligence (AI) as well as how it can revolutionize urban analysis across a wide variety of industries. In particular, I will focus on the real estate industry, which is of particular importance when it comes to developing smart cities. In Mexico’s real estate industry, which traditionally relies on conventional data analysis methods to analyse data, there are often incomplete or ambiguous datasets, particularly in the emerging markets. In the absence of high data quality and comprehensiveness, it is difficult to make informed decisions, evaluate potential investments, and plan for the future. Even though Mexico is at the forefront of smart city initiatives, data collection and specificity remain challenges.
In this paper, we examine how artificial intelligence can be used to enhance existing datasets that are often incomplete or lacking in specificity. In comparison to other developed countries, Mexico is just beginning to embrace smart city concepts. In order to succeed with smart city initiatives, Mexico must establish a data infrastructure. AI is posited to greatly improve decision-making processes in Mexico through advanced data analysis and predictive modelling.
The research is structured around a case study approach, focused on Mexico City. Having this context provides a wealth of opportunities for examining how artificial intelligence can be applied to urban analysis and real estate development. As the name suggests, the study aims to answer several pertinent questions and hypotheses regarding the possibility of adapting AI algorithms, which have been developed for well-documented urban areas, to regions that have less comprehensive data.
Research Questions and Hypotheses
This study is guided by several key questions and hypotheses:
AI Data Enhancement Can AI algorithms, successfully applied in urban areas globally, be adapted to regions with sparse data?
Node Prediction and Dataset Completion Is it possible to use AI, specifically Graph Neural Networks (GNN), to predict node classification and complete datasets in the context of real estate?
AI in Smart City Initiatives How can AI help governments and developers in emerging markets develop smart cities?
Predictive Accuracy Can artificial intelligence analyse and classify regions based on a few characteristics in a city?
Smart cities: what are they?
The concept of smart cities is one of the most exciting promises of the future, since it proposes facing the most pressing challenges of large cities using technology. In order to build them, you need a comprehensive digital ecosystem able to link data to solve common problems immediately.
According to a study by the consulting firm McKinsey, smart city solutions can accelerate emergency response, 35%; reduce travel time daily, 20%; reduce the burden on the health sector due to diseases, 15%; and reduce greenhouse gas emissions by another 15%.
Objectives
Develop a methodology for improving urban analysis workflow significantly. As a result, incomplete datasets pose a number of challenges, as well as the expertise required to process them effectively. Instead of relying on third-party data collection and completion, developers can maximize partial data collected. Urban development analysis is streamlined through this proactive approach.
Leverage artificial intelligence, particularly in predicting node classification, as a means to fill the gaps in incomplete datasets. This approach is expected to transform the way data is utilized in urban analysis, shifting from a passive to a more dynamic and predictive model.
Adaptation and Customization of AI Models. Once the effectiveness of AI in predicting node classification is established, the next step will be to adapt and tailor AI algorithms and scripts to various datasets. This customization is crucial for ensuring that the AI models are not only effective in the context of Mexico City but also versatile enough to be applicable in different urban settings with varying data challenges.
Evaluate the accuracy and reliability of the AI models employed. This will involve comparing the AI-generated predictions and classifications with actual outcomes and data, ensuring that the AI tools developed are both practical and reliable for real-world applications in urban analysis and real estate development.
WORKFLOW
A key component of real estate development projects is data collection, preprocessing, visualization, and Graph Neural Networks (GNN). To assemble a comprehensive dataset, data is meticulously collected. Mexico City’s open data, along with the INEGI database, is a prime example of such a source. For informed AI analysis of the real estate sector, these repositories are crucial.
After data collection, data preprocessing and visualization are crucial. The data preprocessing process involves cleaning, structuring, and transforming the raw data to ensure its quality and compatibility with AI. Moreover, data visualization is crucial at this stage as it directly impacts the accuracy and efficiency of the AI models that will be used later. Data visualization makes it easier to spot patterns, outliers, or inconsistencies. It serves as a verification tool to ensure the data is accurate.
It marks a significant advance to apply Graph Neural Networks. The GNN is particularly adept at managing graph-structured data, which makes it ideal for real estate development projects that involve various data points connected by relationships. To predict edge classification, GNNs are employed. Through the identification and classification of relationships between different nodes (like properties, locations, and development projects), this capability enriches the dataset. GNNs also help assess the viability, profitability, and overall potential of real estate development projects.
The robust framework is built by integrating data from sources such as the INEGI database and Mexico City’s open data, preprocessing, visualizing, and applying Graph Neural Networks. This framework is vital in harnessing AI’s power to revolutionize real estate development, offering insights that are more accurate, predictive, and valuable for decision-making.
3.1 Data Colletion
3.1.0 OSMX – Library
OSM Express is a fast storage format for OpenStreetMap that powers Protomaps tools. It’s designed as a low level building block specific to the OSM data model; common access patterns such as random lookups by ID, in-place minutely updates, and spatial queries are efficient and simple to manage in production applications.
Features
Random access: Look up nodes, ways and relations and their metadata by ID; fetch member elements of ways and relations to construct geometries.
Spatial indexing: Nodes are bucketed into S2 Geometry cells. Access a region by providing a cell covering; works for non rectangular regions.
Scalable: OSM Express works the same way for OSM data of any size, from a small city to the entire planet. The entire planet can be worked with efficiently on typical hardware such as a laptop computer.
In-place updates: Included are scripts to download minutely changesets from planet.openstreetmap.org and apply them to an .osmx database.
Concurrent access: Multiple processes can open the database file for reading simultaneously. No running server process is required. Writing minutely updates doesn’t block reader access. Reads and writes are transactional.
Portable: An .osmx file can be read and written to from either C++ or Python.
911 Calls Dataset
With the 9-1-1 emergency number, citizens can receive assistance in cases of crime, emergencies, civic offenses, public services, and medical emergencies, in coordination with various agencies.
Currently, the CAEPCCM is managing and operating the Emergency Call Services of the extinct 066, and since January 2017, the Command, Control, Computing, Communications and Citizen Contact Center operates the unified 9-1-1 emergency telephone in Mexico City, where reports of crimes and emergencies, such as fires, robberies, car accidents, medical emergencies, among others, are received and handled immediately, 24 hours a day, 365 days a year.

Prices of properties Dataset
For each property in this data set, you will find relevant information taken from the Mexico City cadastre database, which includes information regarding the following:
Surface area of a piece of land
Surfaces used in construction
Usage in construction
Construction year of the building
Land value at unit price
Valuation of the land
It is due to the large size of the base that it is divided into municipalities.
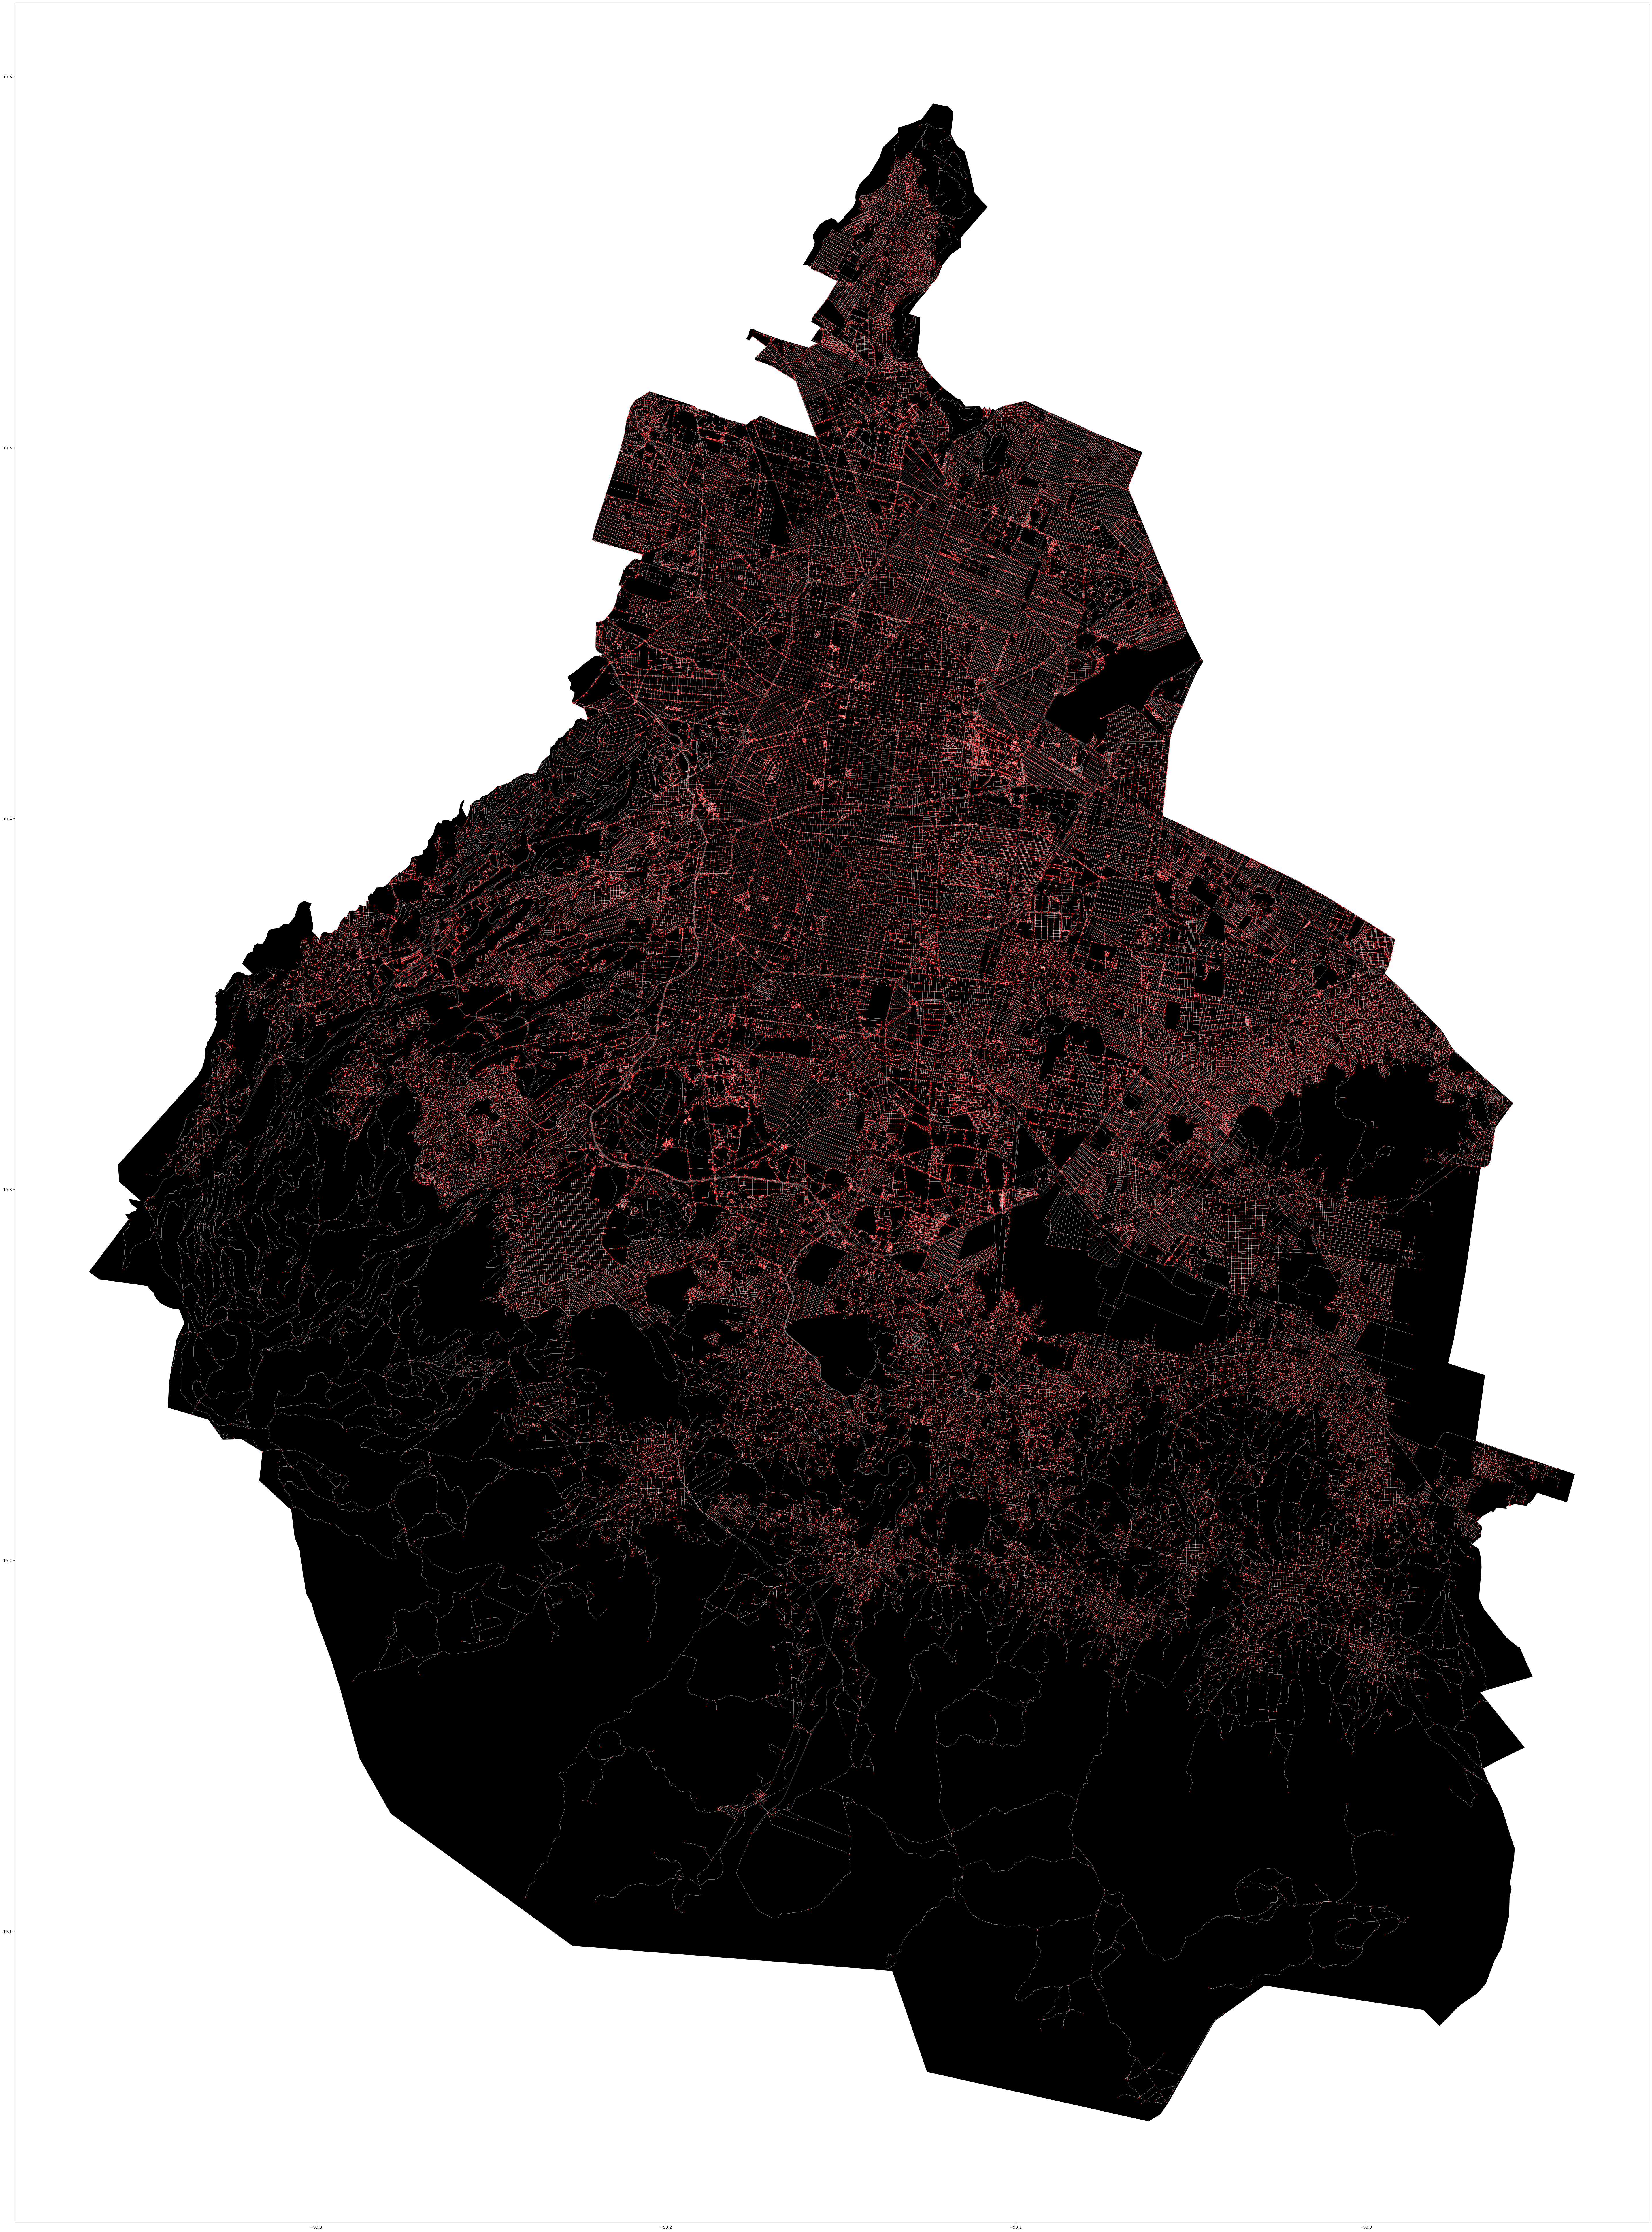
DATA VIZUALIZATION – 911 CALLS
We use the polygons that are divided by municipalities to be able to locate the nodes that are inside and assign them a value. In the training and prediction phases of the graph, this value will then be treated as an attribute. As you can see in the images, the colors are based on values:
0.0 Number of calls: ‘purple’,
1.0 Number of calls: ‘yellow’,
2.0 Number of calls: ‘green’,
3.0 Number of calls: ‘blue’,
4.0 Number of calls: ‘orange’,
5.0 Number of calls: ‘red’
This process allows us to visually identify areas in the city that require security attention. Future trends cannot be analyzed in this thesis, but they can be analyzed down the road.

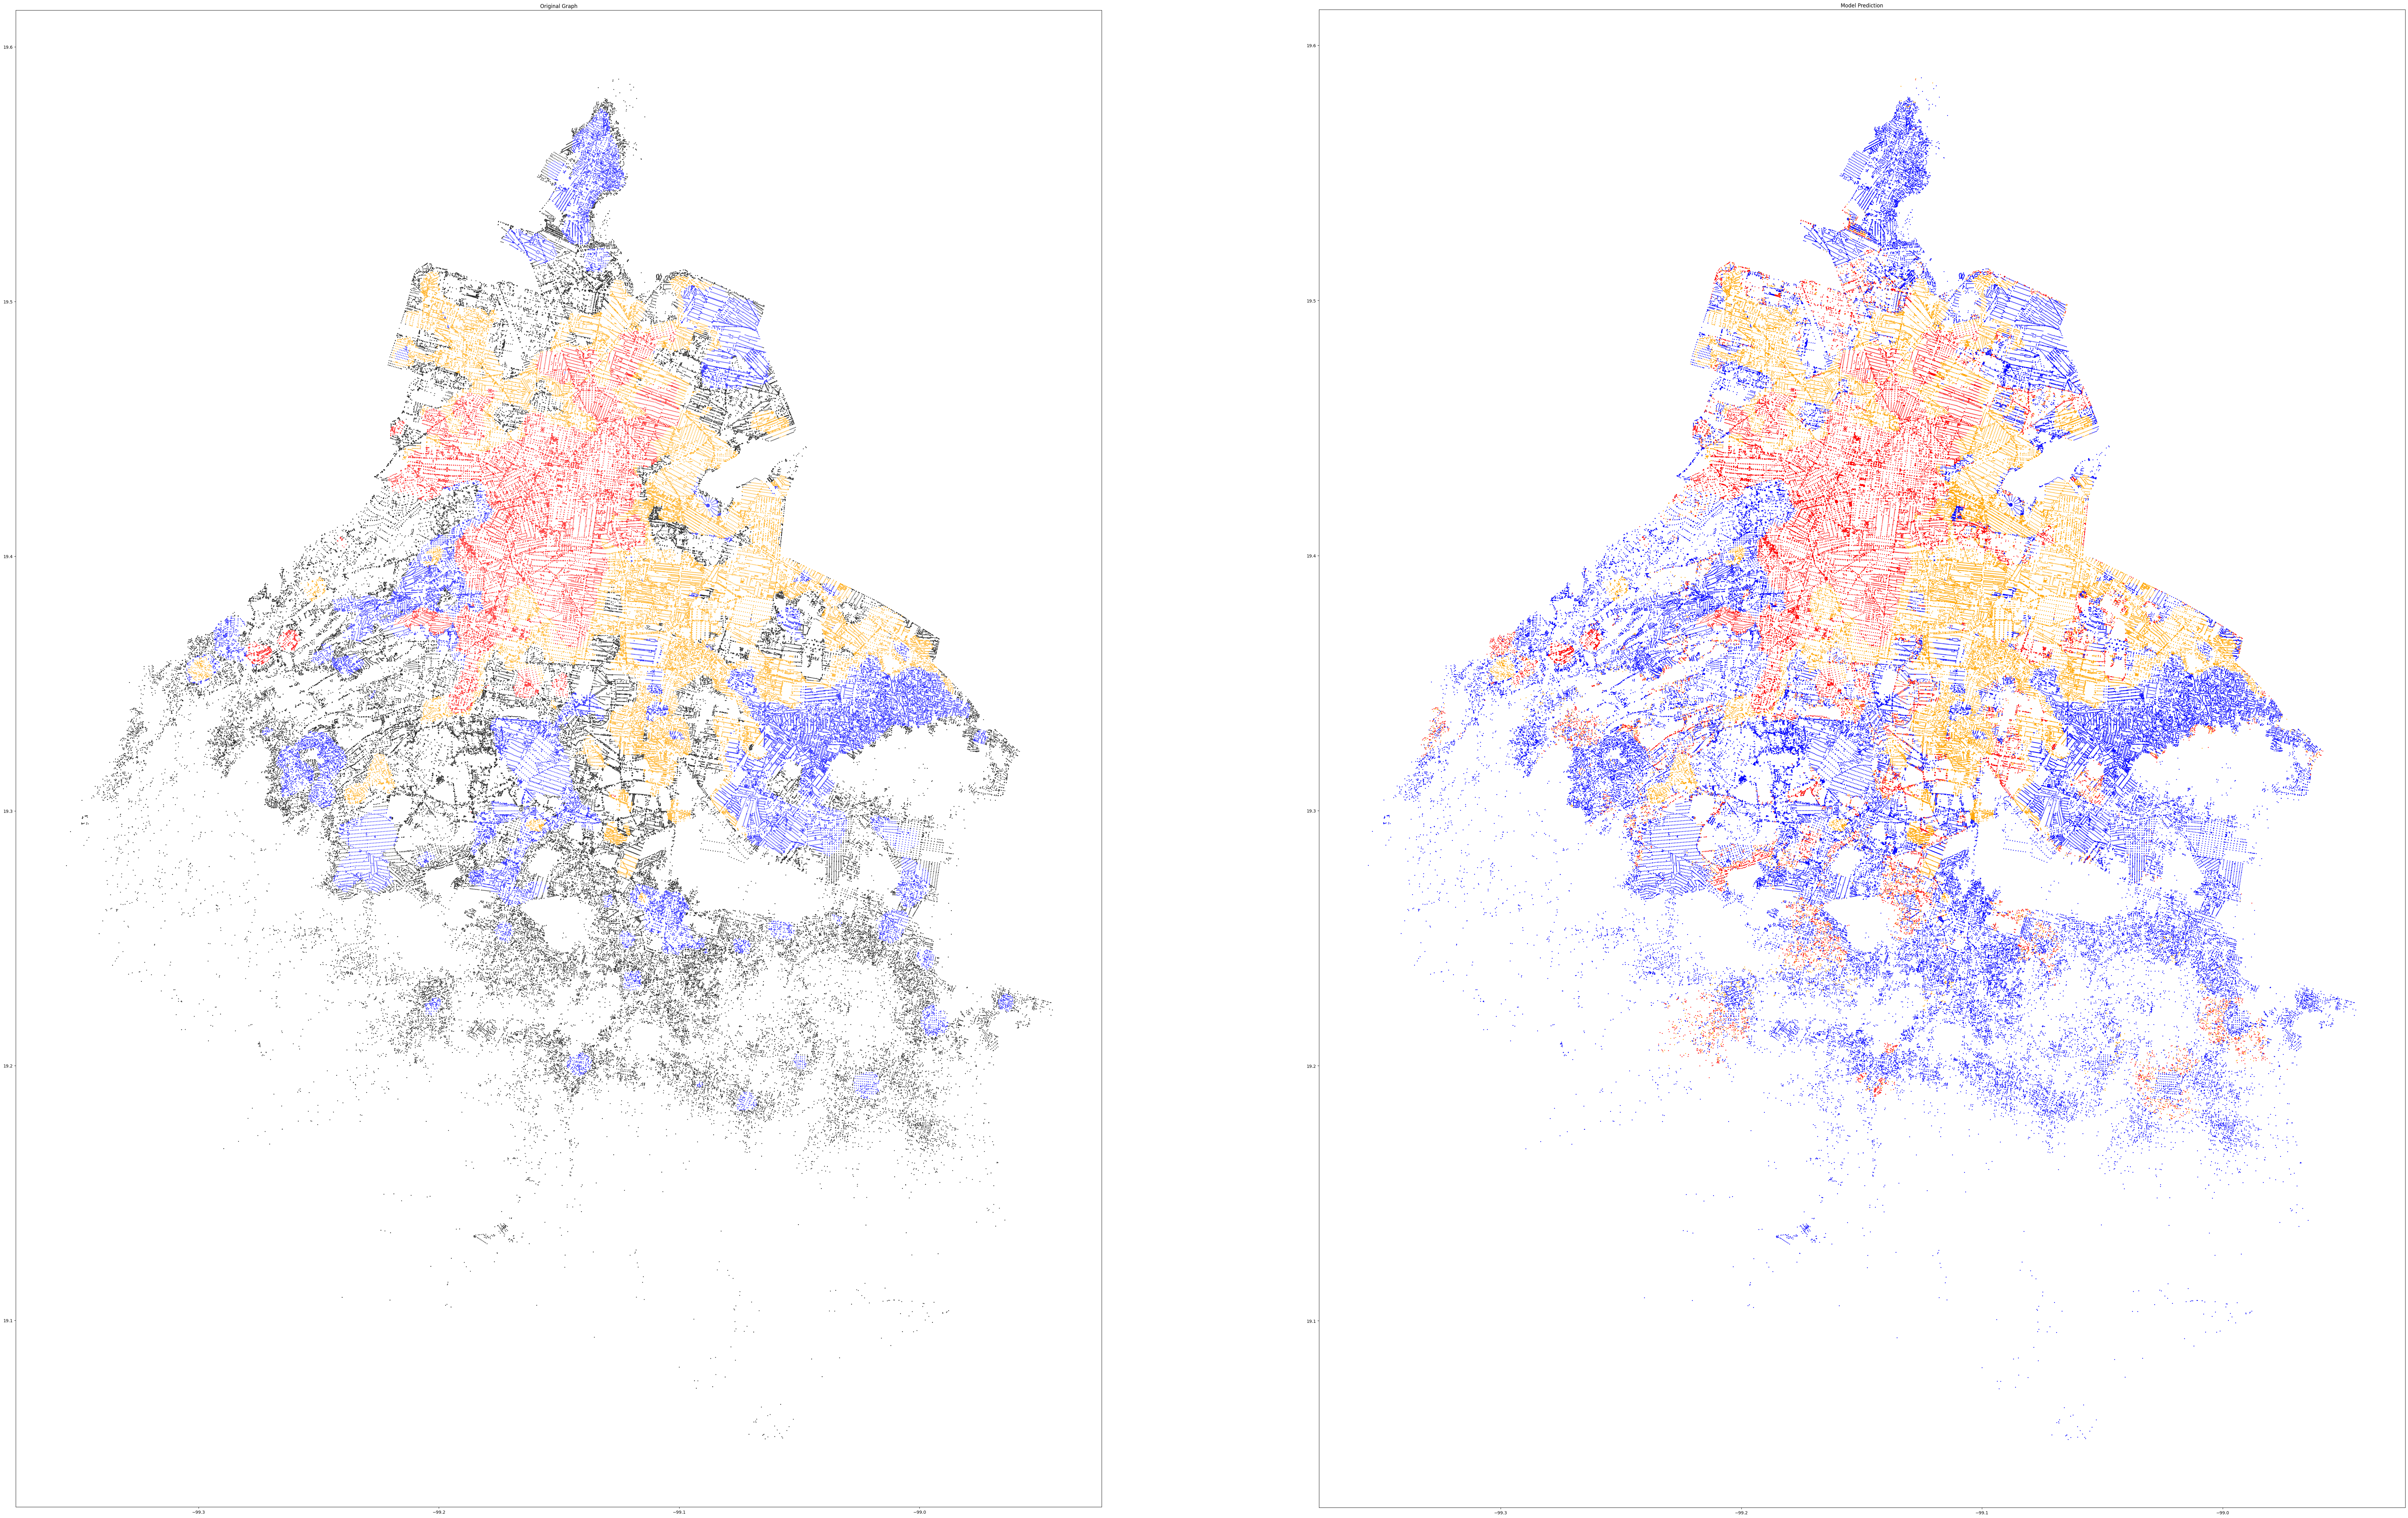
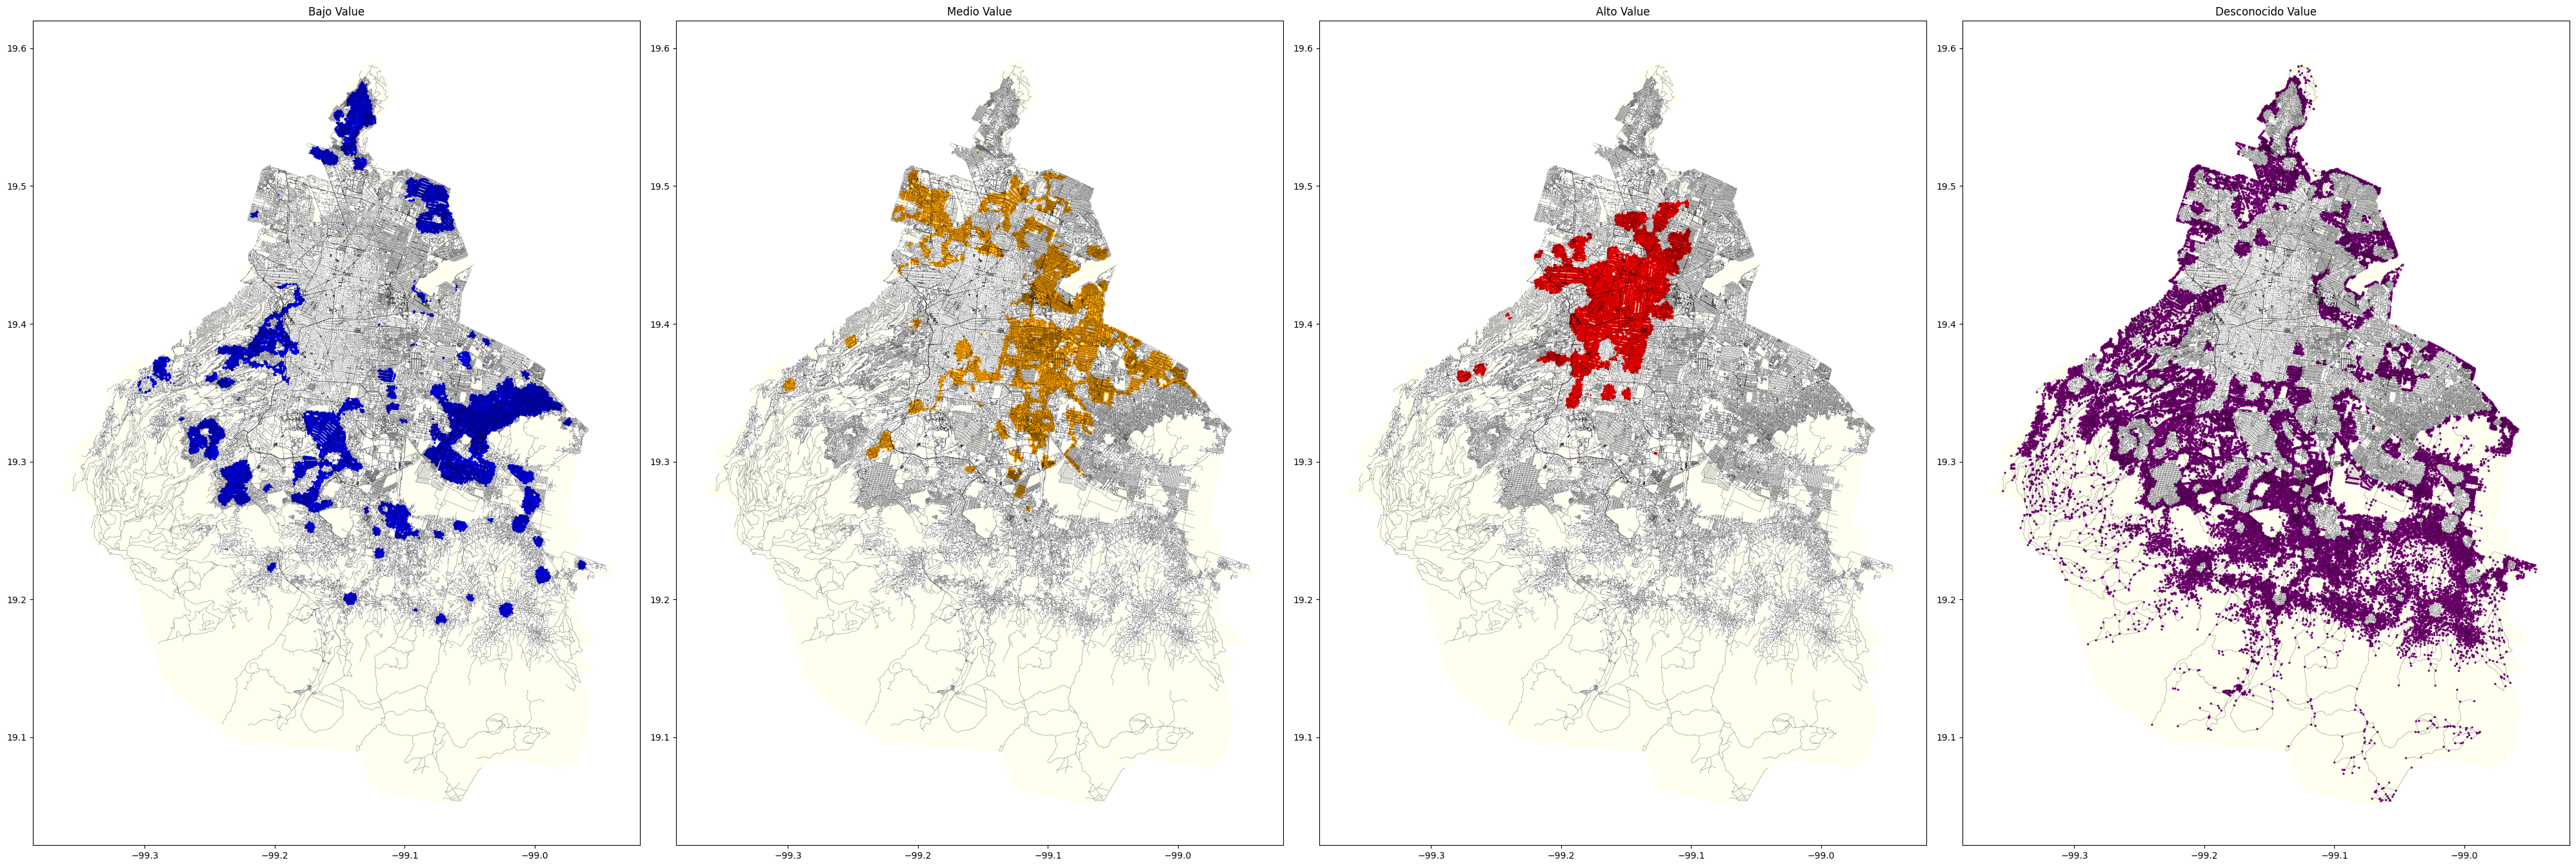
DATA VIZUALIZATION – PRICE / M2
Using the same logic as the other datasets, we use polygons to locate nodes and assign them values. Since we have a lot of nodes catalogued as Unknown (Desconocido), we will use this work-flow to predict their prices.
Affordable: ‘Blue’,
Average : ‘Orange’,
Expensive: ‘Red’,
Unknown: ‘Purple’
This prediction only uses two datasets to find price and security correlations, but other datasets can be added to enhance it.
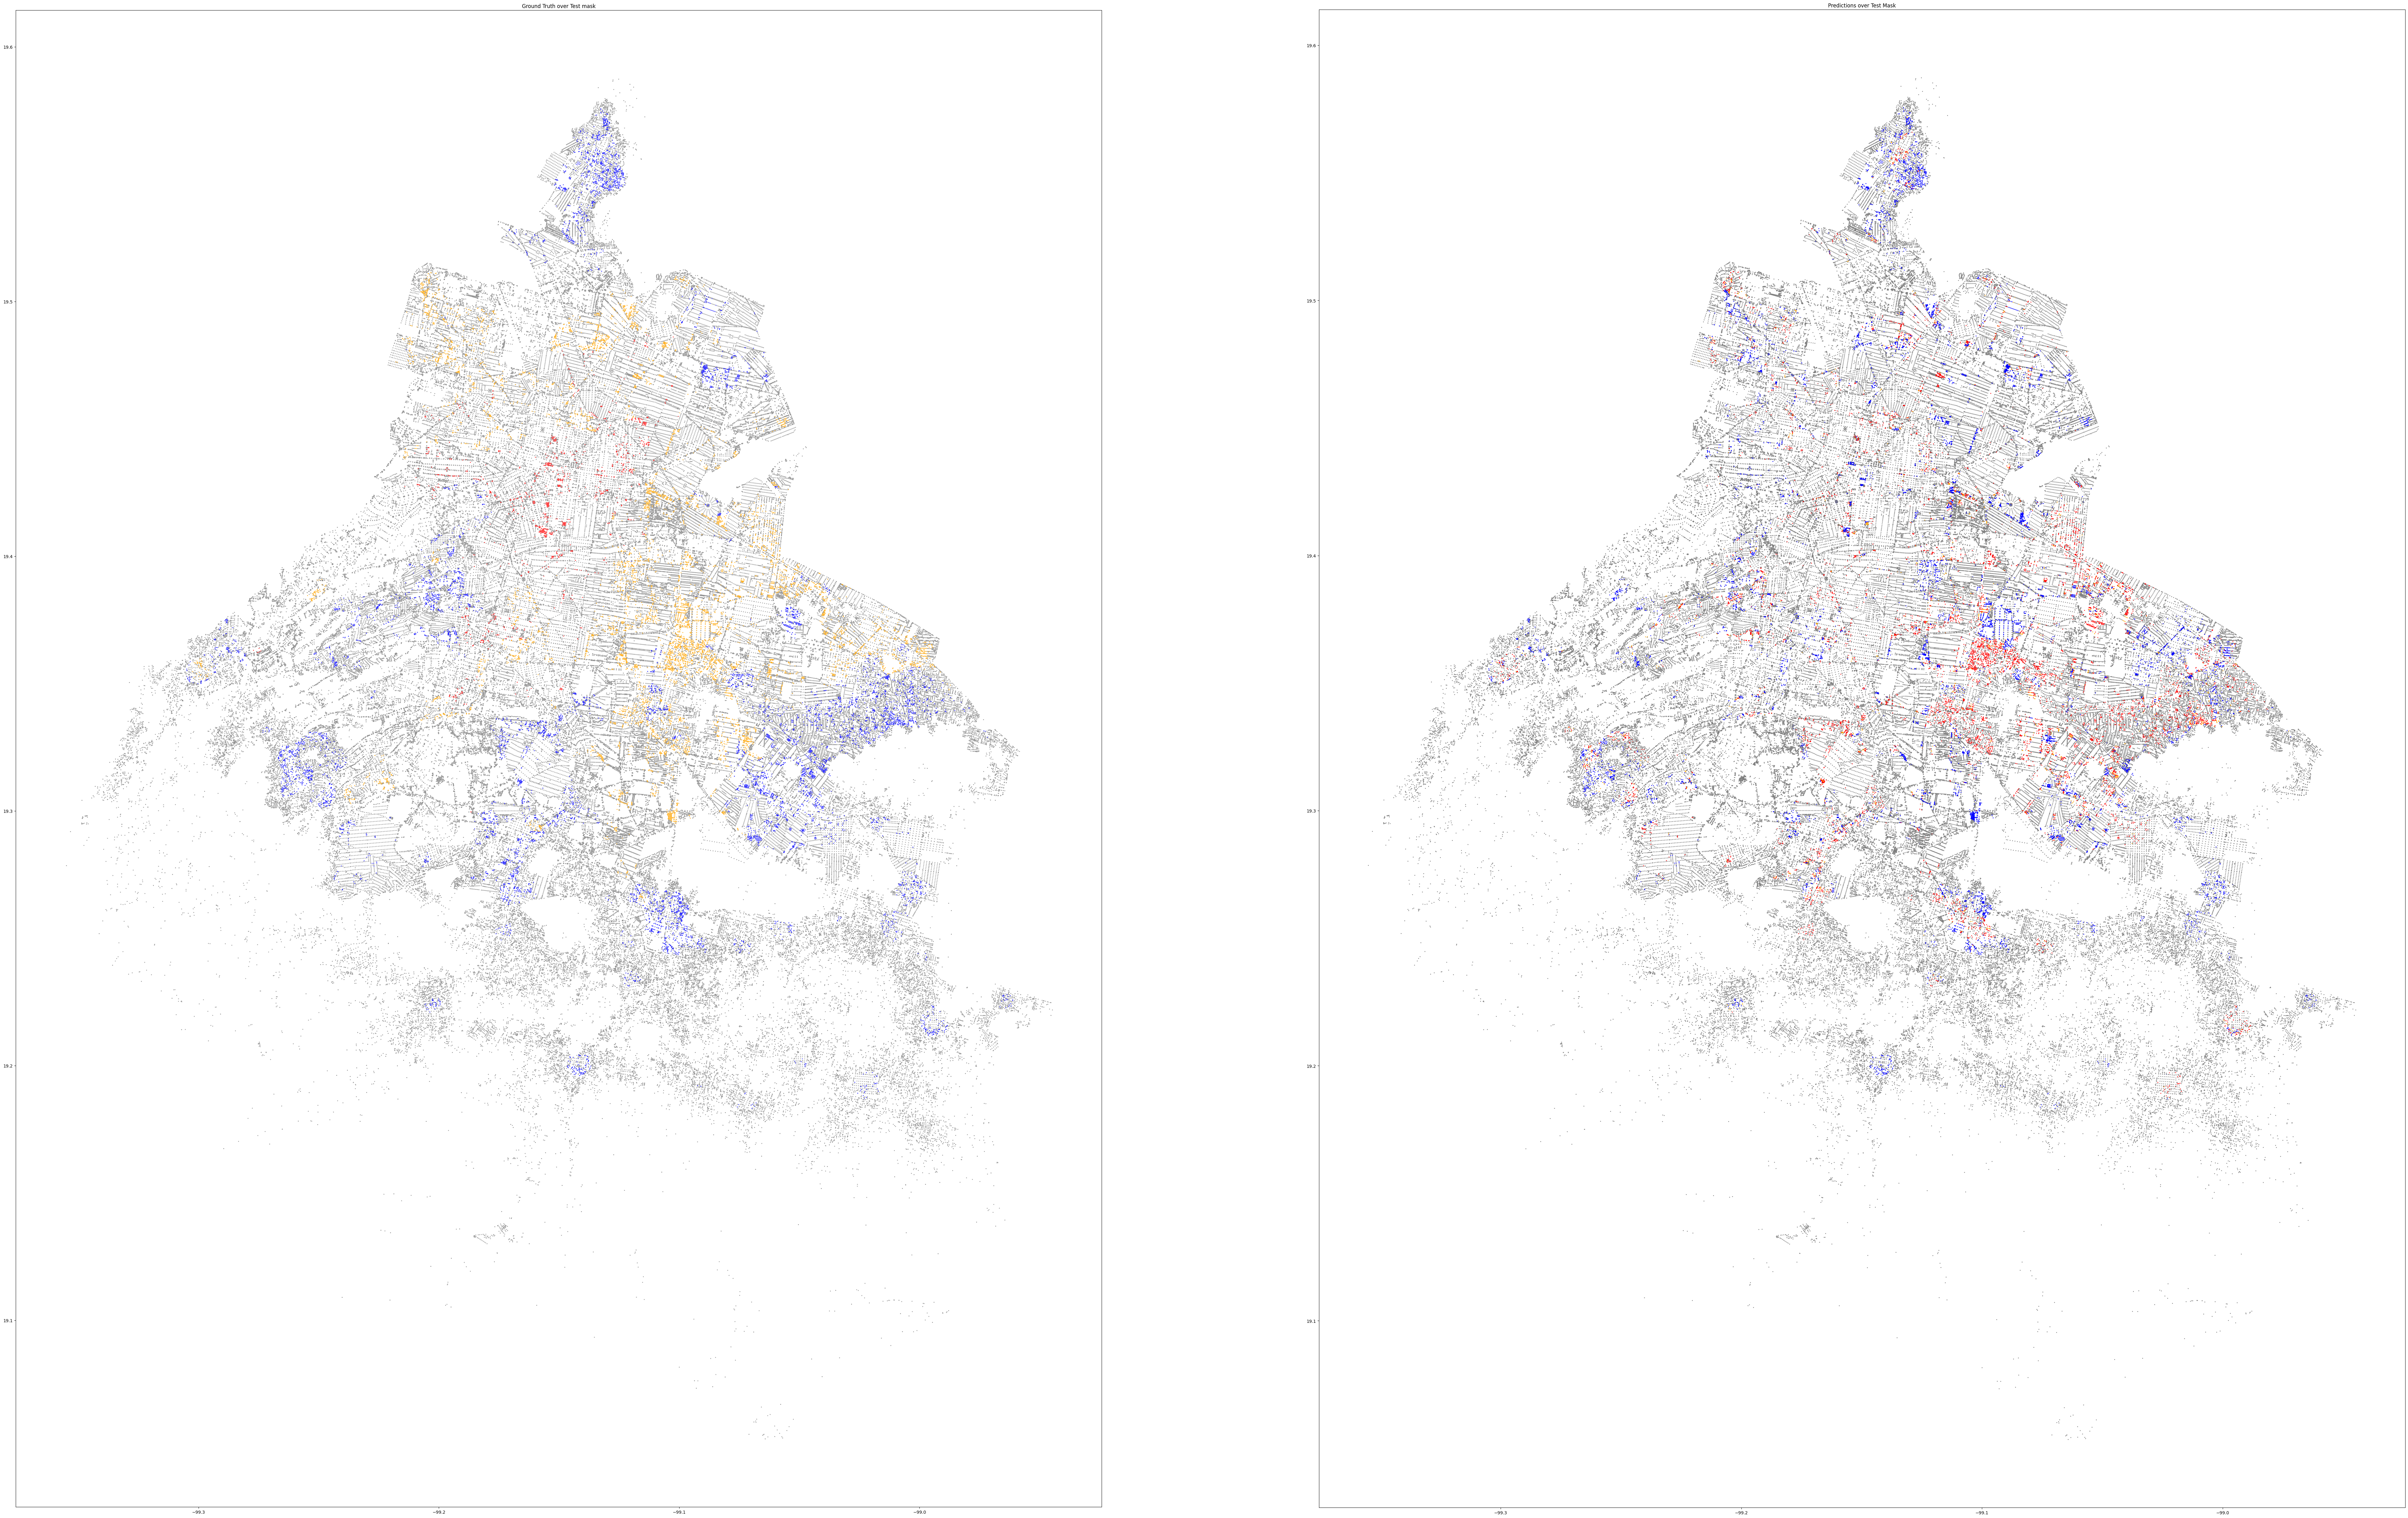
Data Preparation for Prediction
The data needs to be prepared for prediction by creating a mask. With this mask, we can divide the data into four sections: Train, Variation, Test, and Unknown. By using the mask, we will be able to ensure that the data is split in specific proportions among the four sections. Also, the mask will prevent bias in the data and ensure an unbiased model. Finally, the mask will be useful for comparing predictions to reality.
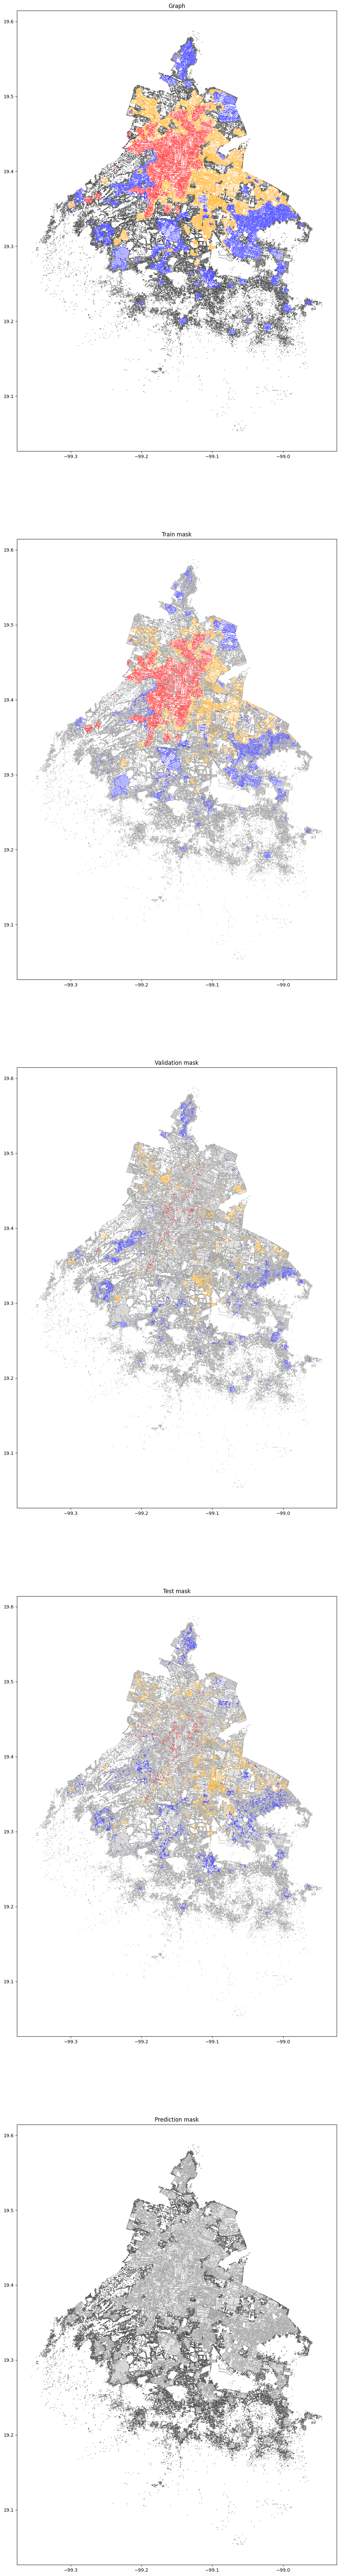
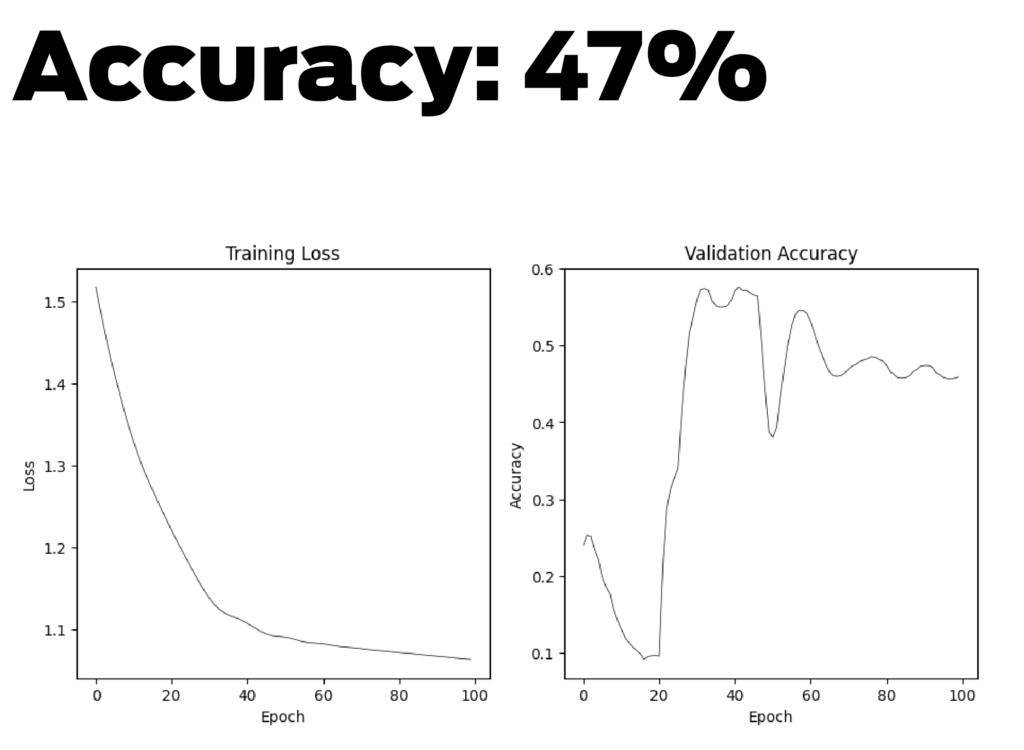
RESULTS
It is evident from the graph that general predictions are working. The visualization shows that nodes that are far from the city center seem to be pleasant. This may be due to the lack of infrastructure in these areas.
In this experiment, only two datasets were used, and more attributes were required to improve the accuracy of the model.Below are the hyper-parameters for this result.
n_layers=1
dropout=0.0
n_hidden=4
lr=0.001 #0.001
n_epochs=100
weight_decay=0
device=’cpu’