
You are looking at Mukuru, a place that nearly 400,000 people call home. It is usually described through its challenges — flooding, informality, vulnerability. But behind those labels is a community that has built its own networks, livelihoods, and ways of getting by, year after year, despite a constant state of change.
So we began with a simple question: what if adapting to change meant strengthening people’s ability to belong, rather than forcing them to leave?
This is the project we built around that question — an analysis, a strategy, and a set of tools for adaptation without displacement in the Mukuru Special Planning Area, Nairobi.
The Place and the People
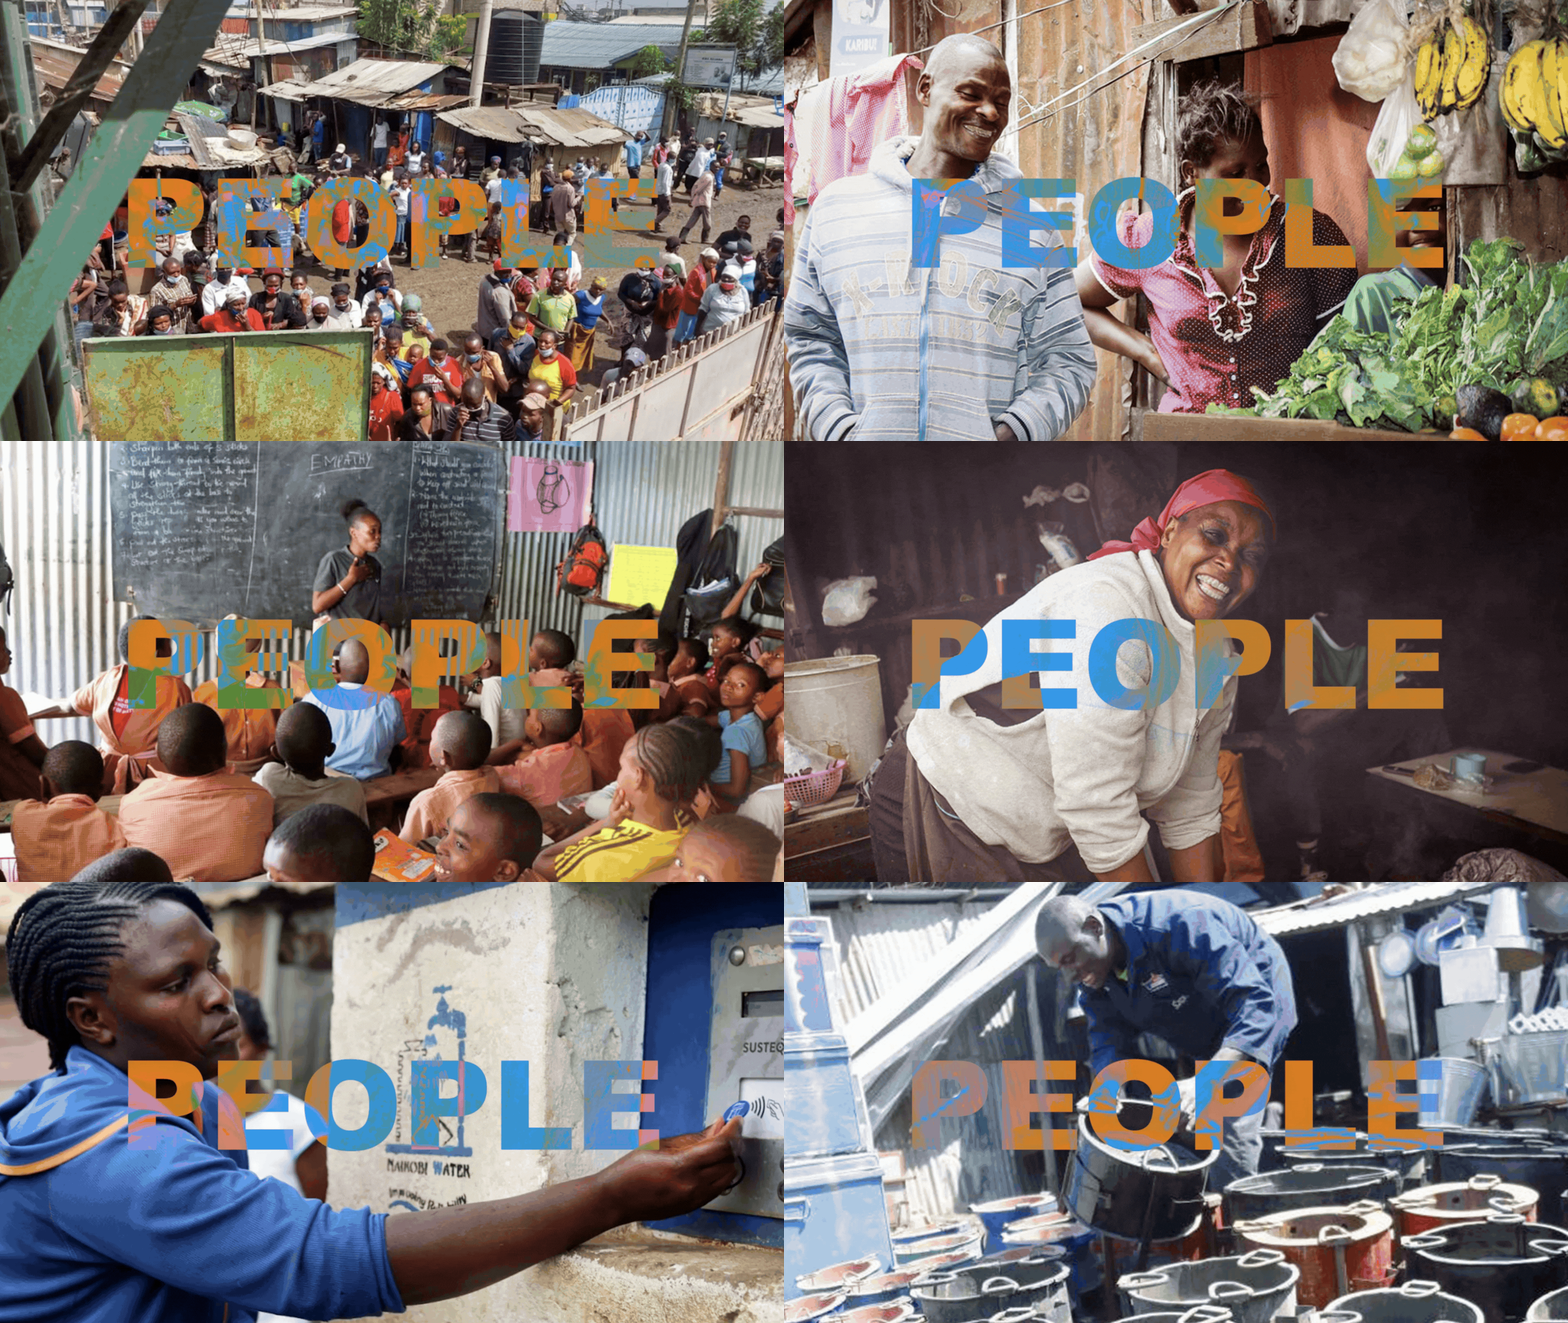
This brings us to the people of Mukuru, a community shaped not by permanence, but by movement.
Residents come in search of work and opportunity, forming a population that is constantly shifting, yet deeply embedded in the everyday life of the settlement.
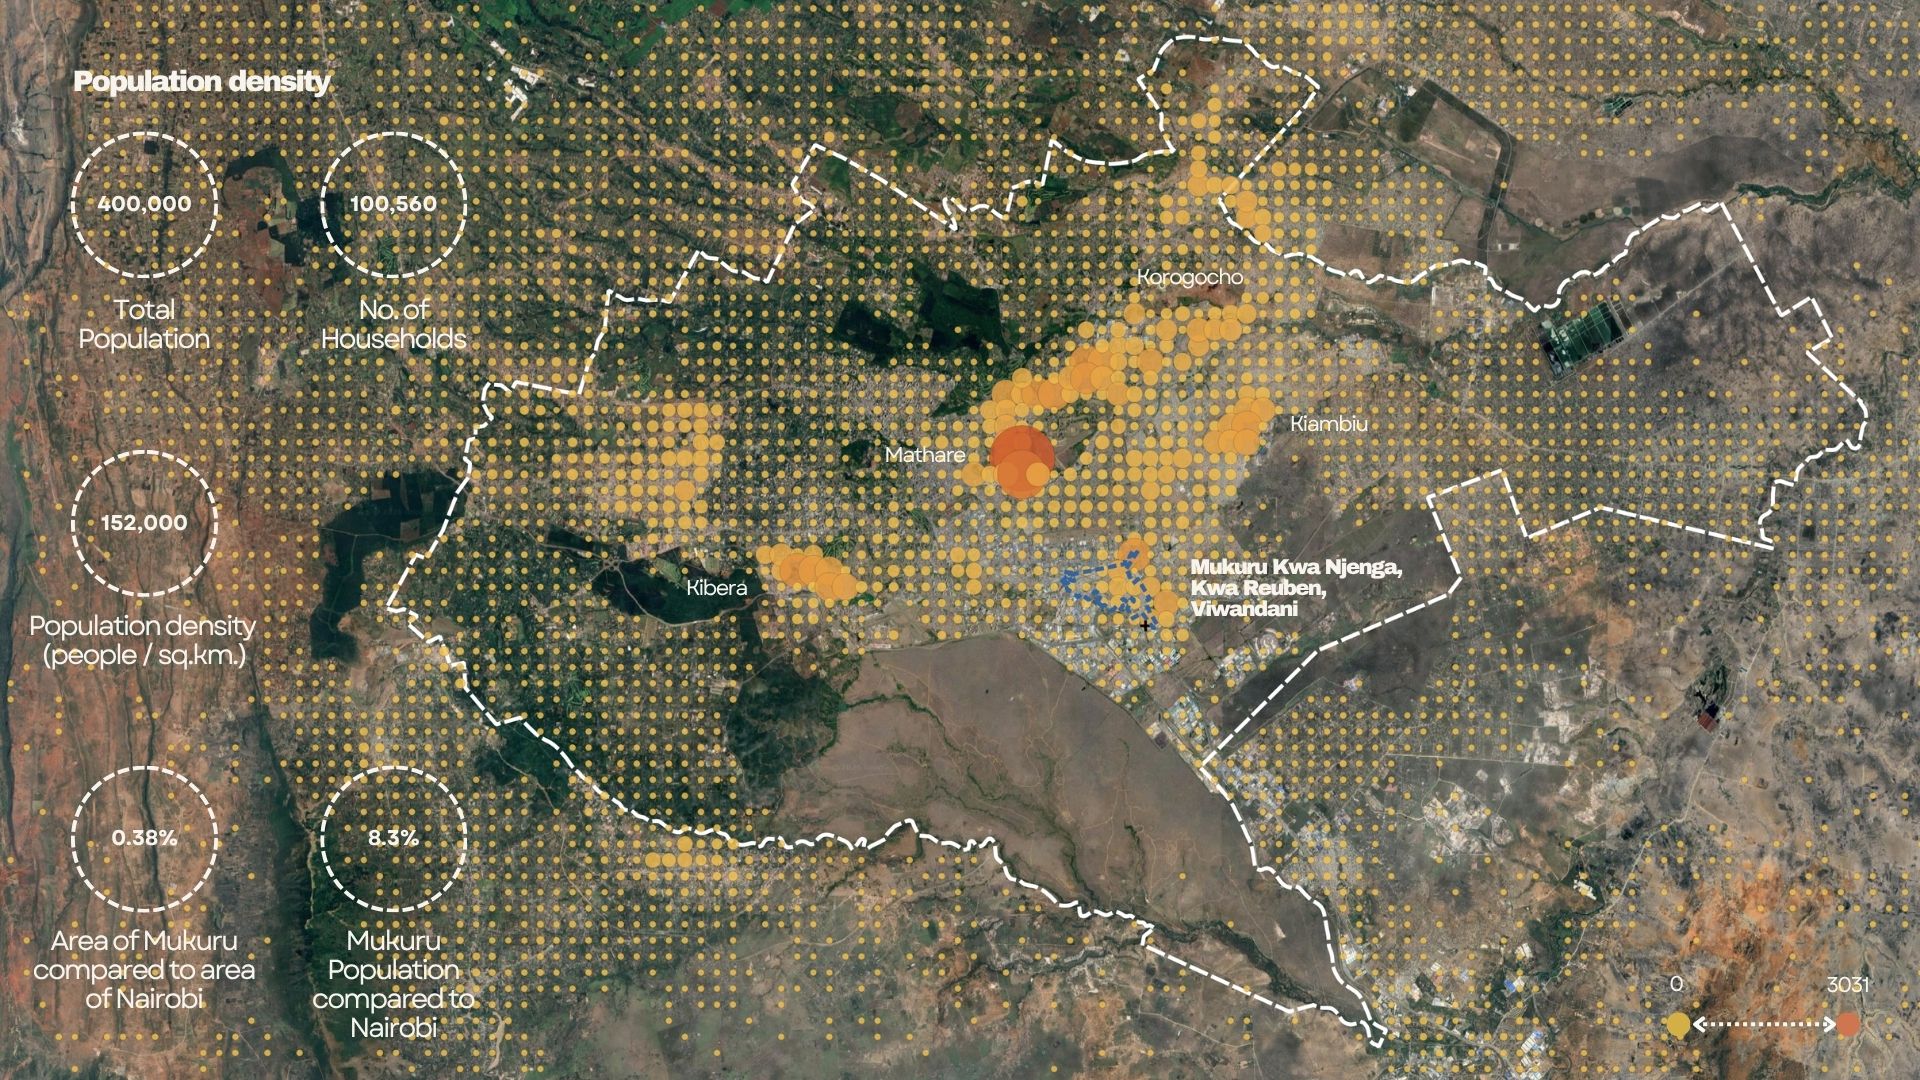
Mukuru is one of the most densely populated areas in Nairobi. It is also a remarkably young community, with an average age of 27. Around 67% of residents are working-age adults, 30% are children, and only a small percentage are elderly.
This demographic structure reflects a settlement driven by labour, mobility, and economic survival, rather than long-term stability.
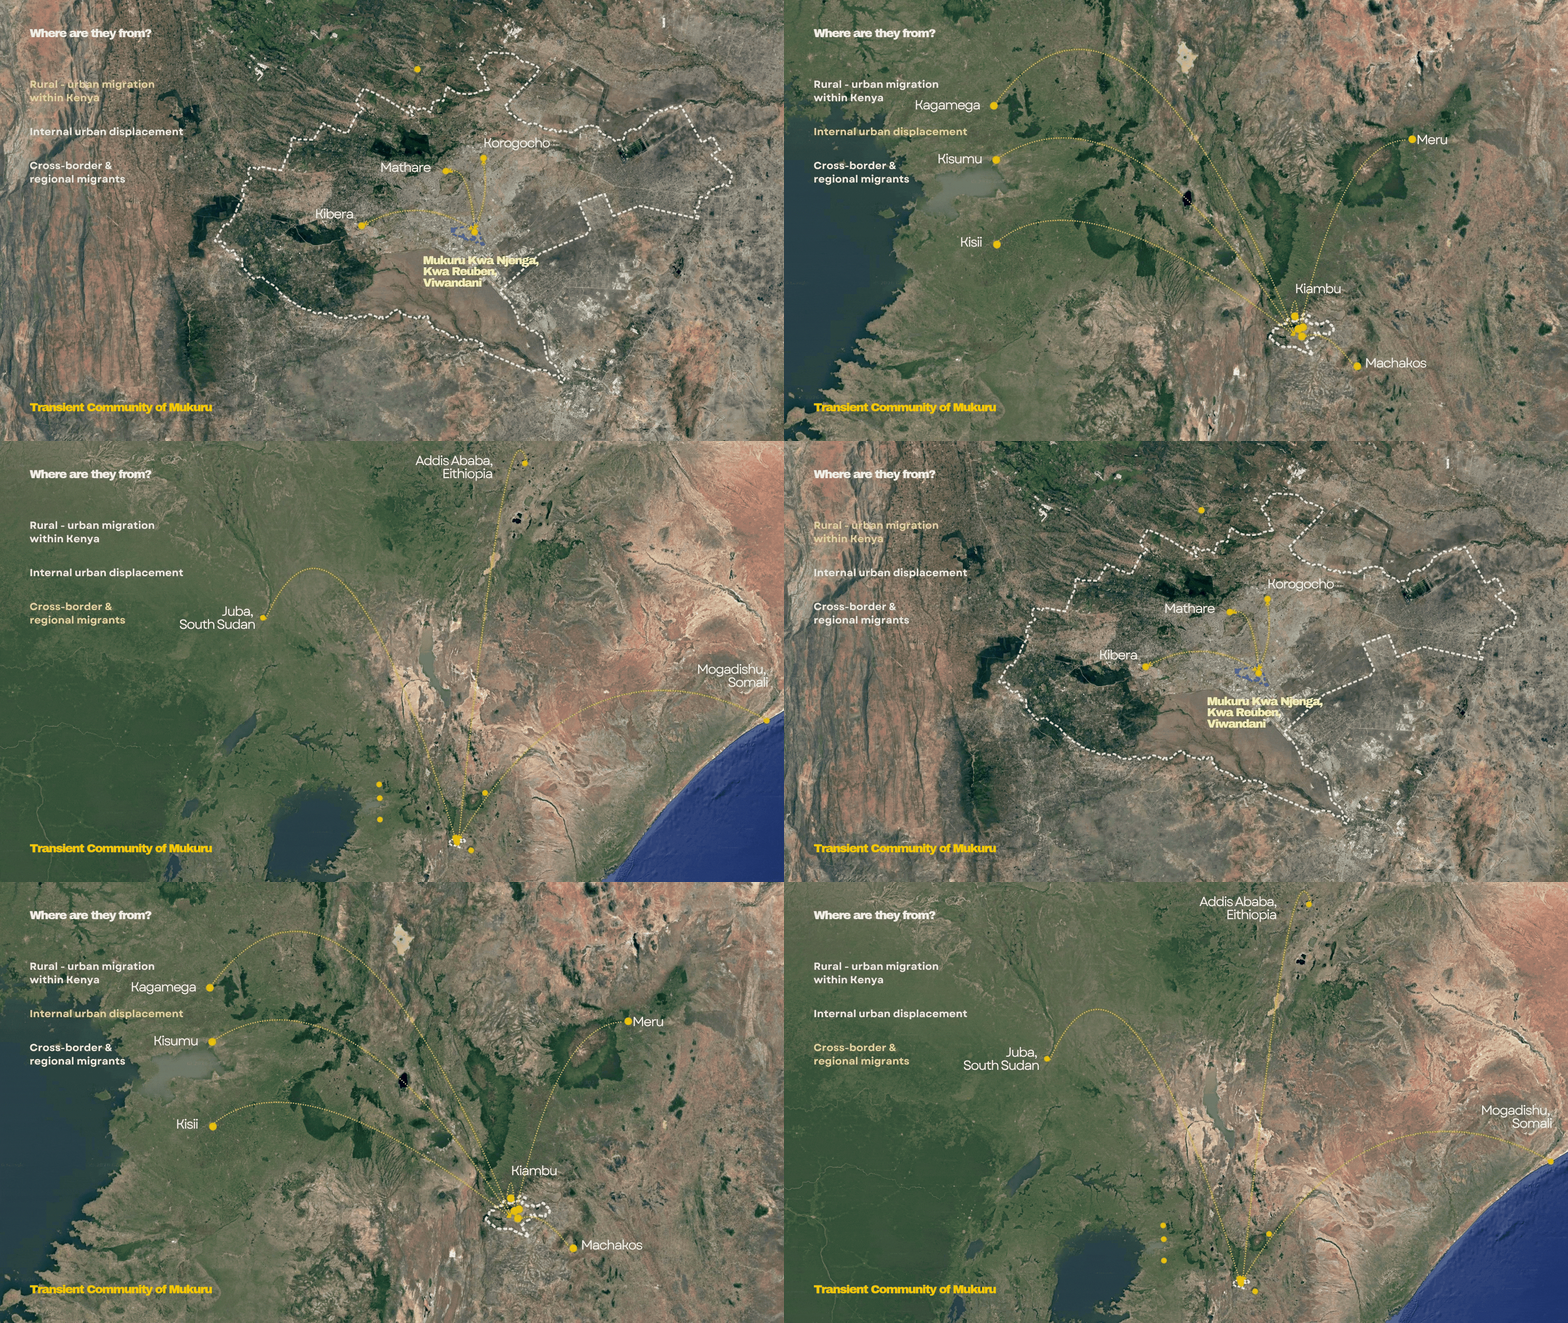
Mukuru was built by workers drawn to nearby industrial employment. Over time, temporary settlement became long-term residence yet without ownership, security, or formal recognition. Most residents are tenants, and despite living here for decades, remain without legal claim to land.
This condition of transience limits the formation of stable community systems and long-term investment in place.
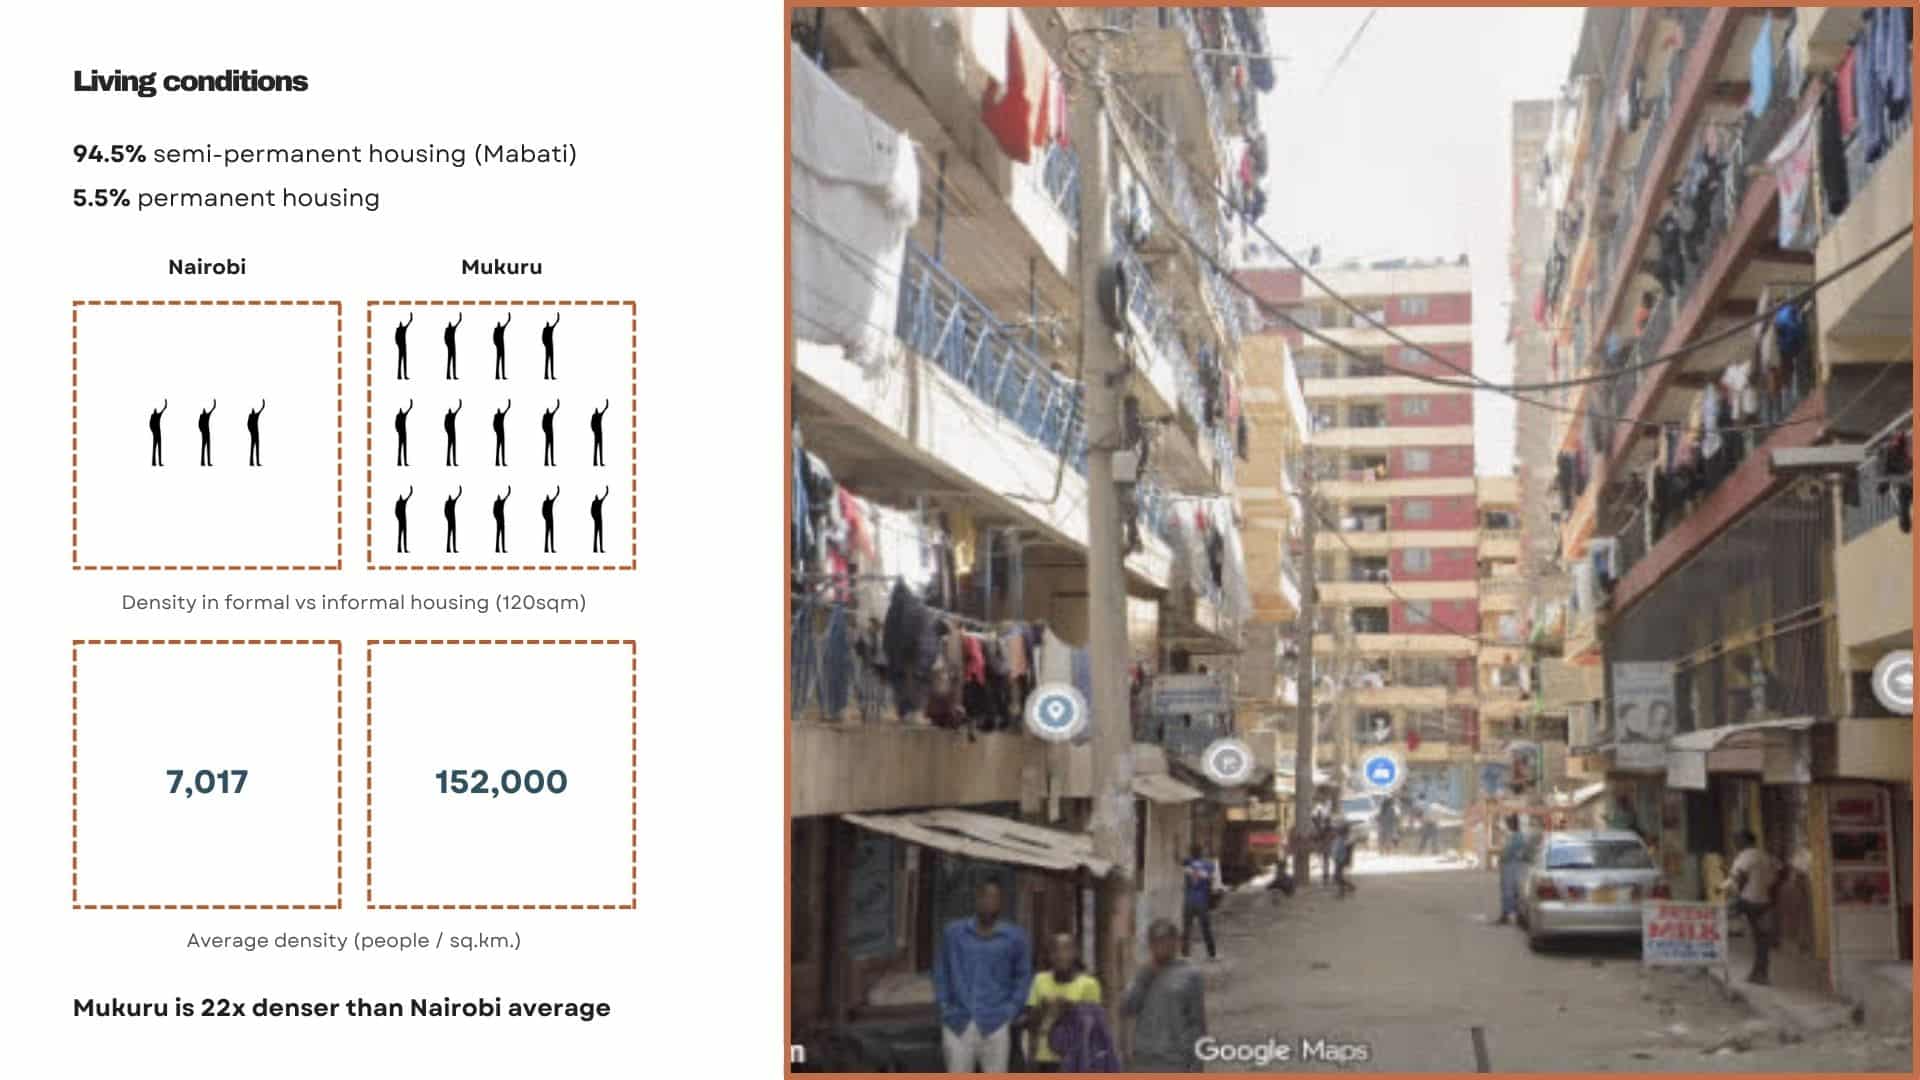
The contrast in living conditions reveals the intensity of spatial pressure in Mukuru. Compared to formal housing in Nairobi, the same area accommodates significantly more people, making the neighborhood nearly 22 times denser than the city average. With 94.5% of residents living in semi-permanent structures, the built environment reflects both adaptability and precarity.
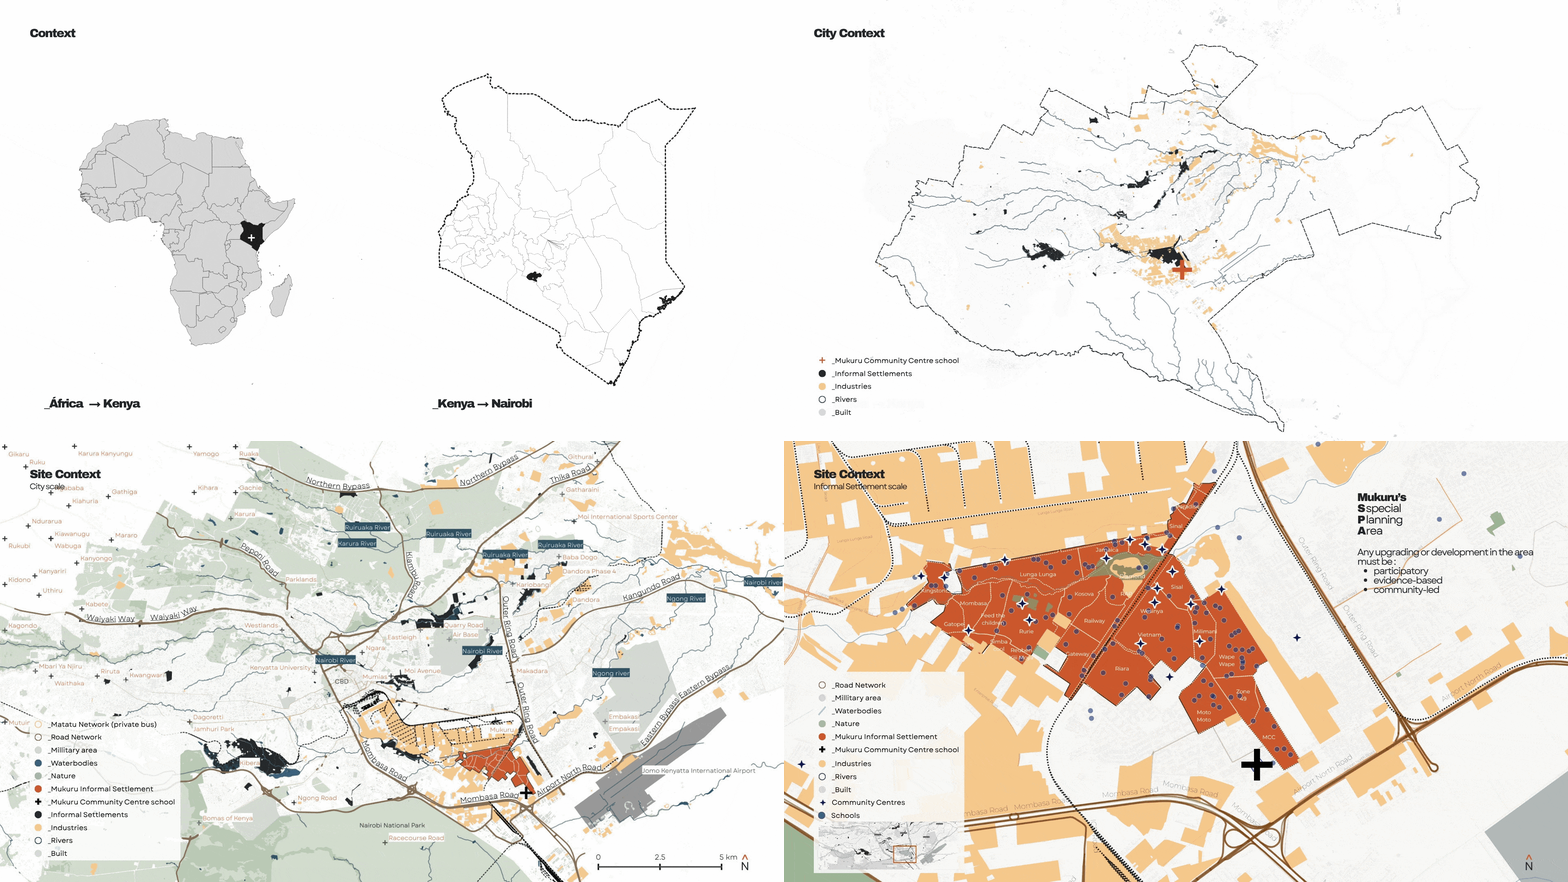
Mukuru sits at the intersection of Nairobi’s industrial belt and its river systems. Because of its downstream location, environmental pressures accumulate here — flooding, pollution, and climate risk all collect at the bottom of the slope. The settlement sits wedged between the central business district, the airport, and surrounding industries, bounded by rivers, railways, and transport corridors. Over the decades it has grown into one of Nairobi’s densest neighbourhoods, organised into a patchwork of villages, each with its own schools, small industries, and community facilities.
In recognition of both its struggles and its importance to the city, Mukuru was designated a Special Planning Area in 2017 — a status that requires any upgrading or development in the area to be participatory, evidence-based, and community-led.
The numbers behind that designation are worth sitting with. Mukuru holds roughly 400,000 residents on just 0.38% of Nairobi’s land area — 8.3% of the city’s entire population. Population density runs at about 152,000 people per square kilometre, roughly 22 times Nairobi’s average. Nearly 95% of housing is semi-permanent, built from mabati (corrugated iron) rather than permanent materials.
The population is young — an average age of 27, with close to two-thirds of residents of working age — and built almost entirely by migration. Some came from across Kenya’s rural areas looking for industrial work, some crossed borders from neighbouring countries, others were displaced from elsewhere within Nairobi itself. Most are tenants rather than owners, which means the population is constantly shifting. Mukuru has never really settled — it has always been a community in transition. That instability is exactly why “belonging” needed to be the design problem, not an afterthought to it.
Listening to the Data: A Multi-Layer Analysis
To understand where intervention could actually help, we didn’t start from a single map. We built up four independent layers of evidence and watched where they overlapped.
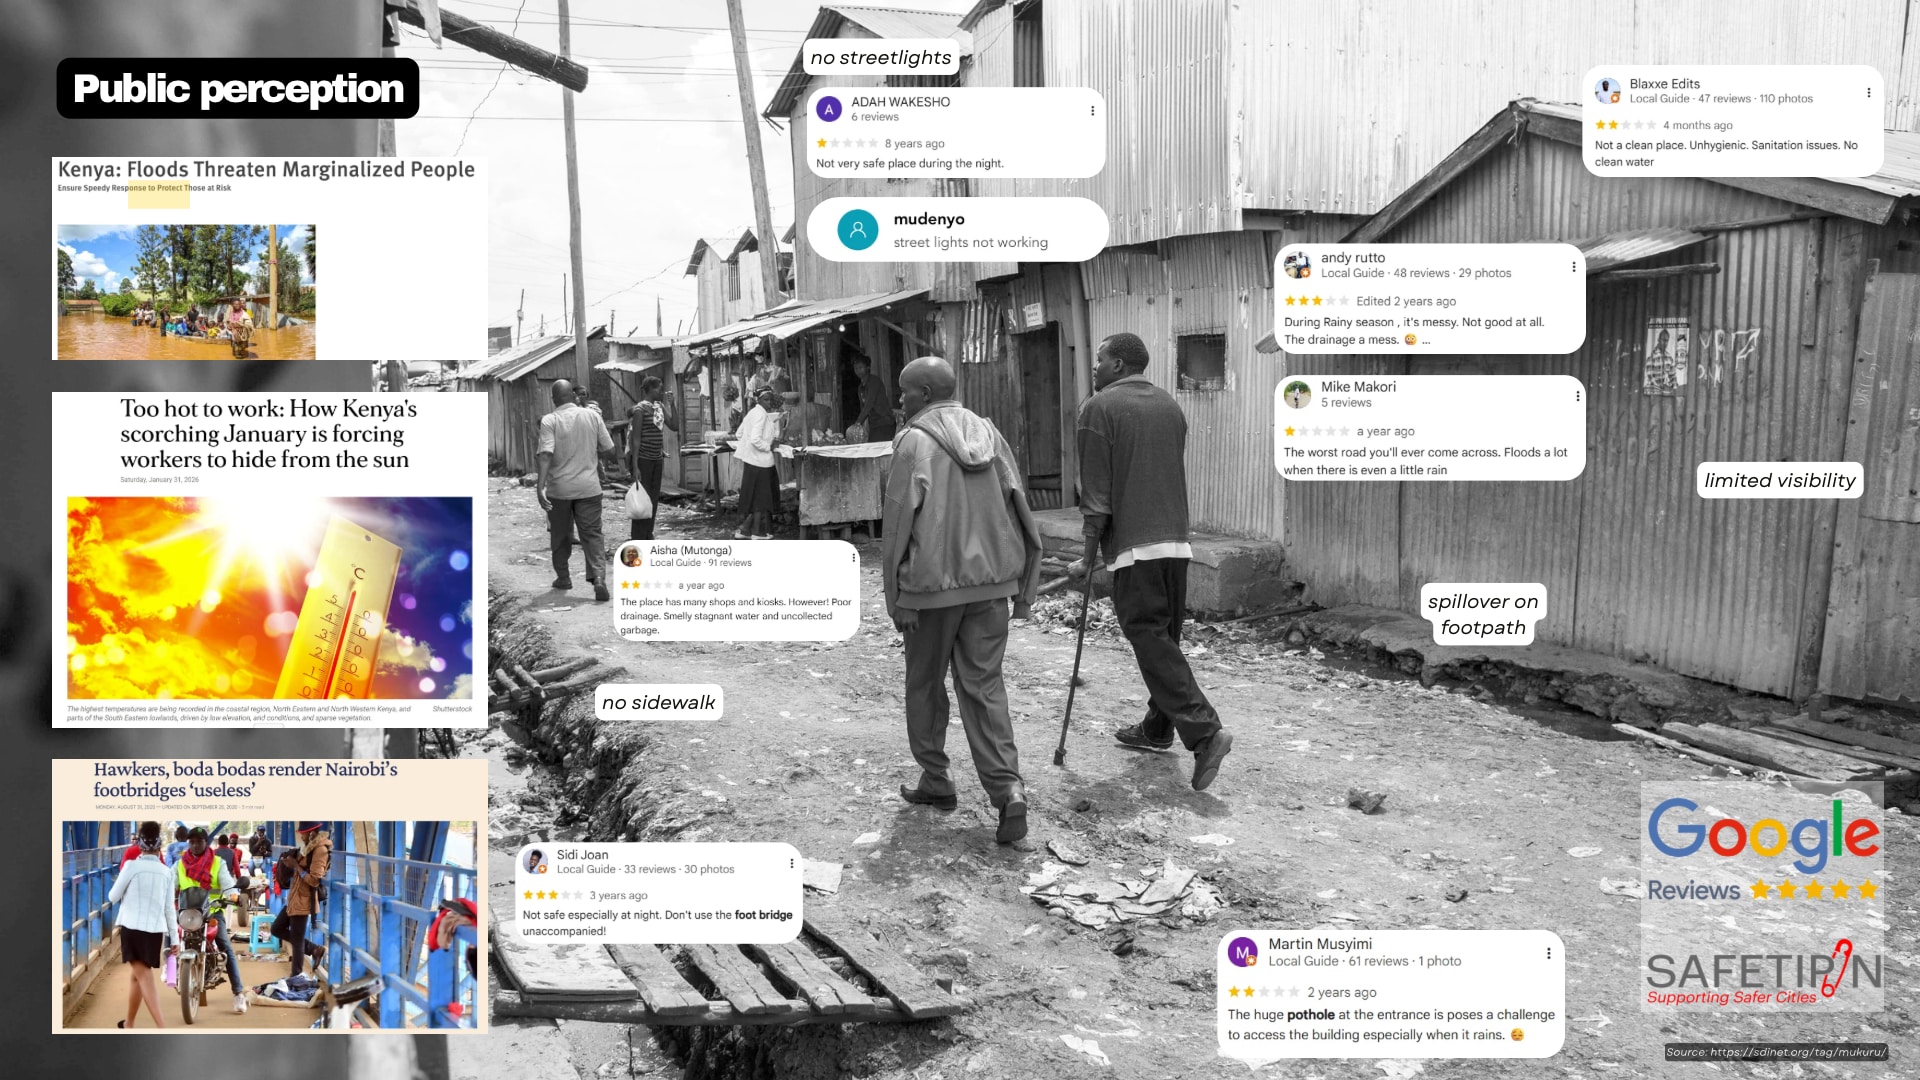
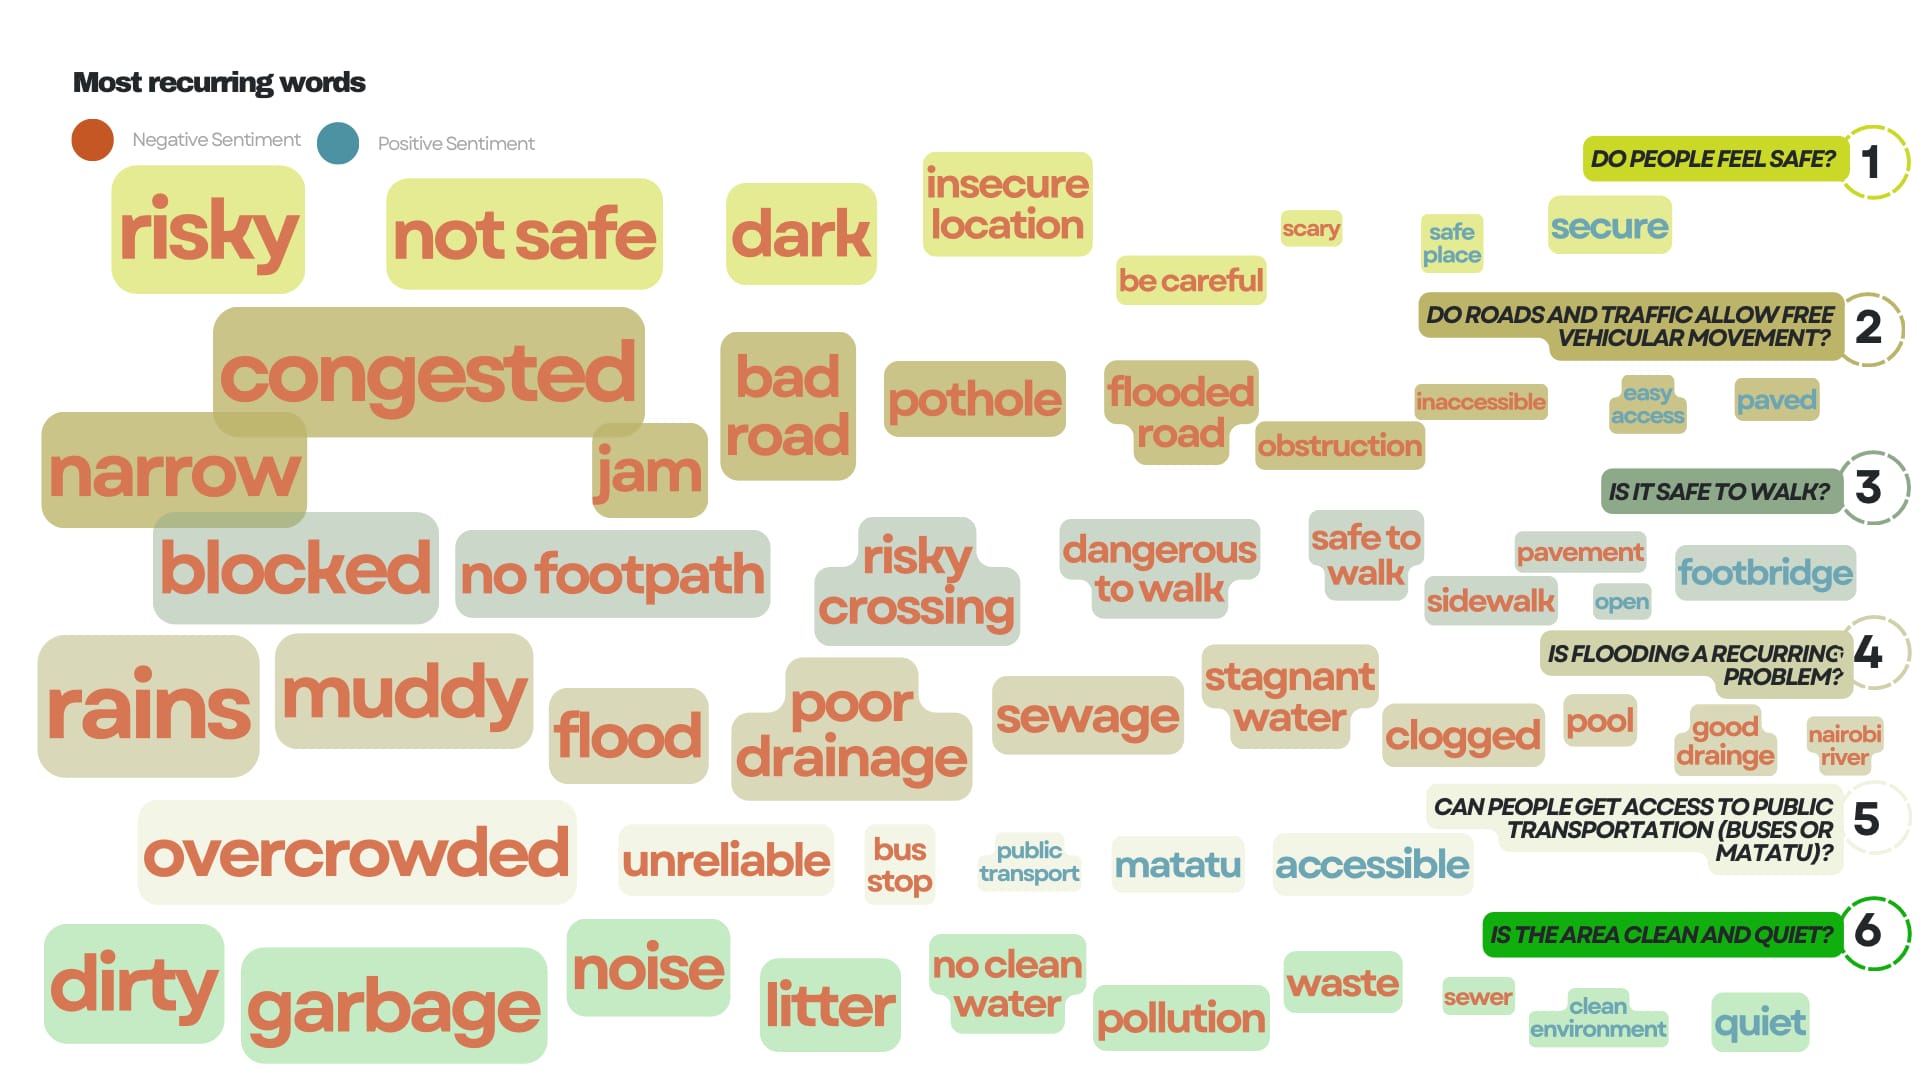
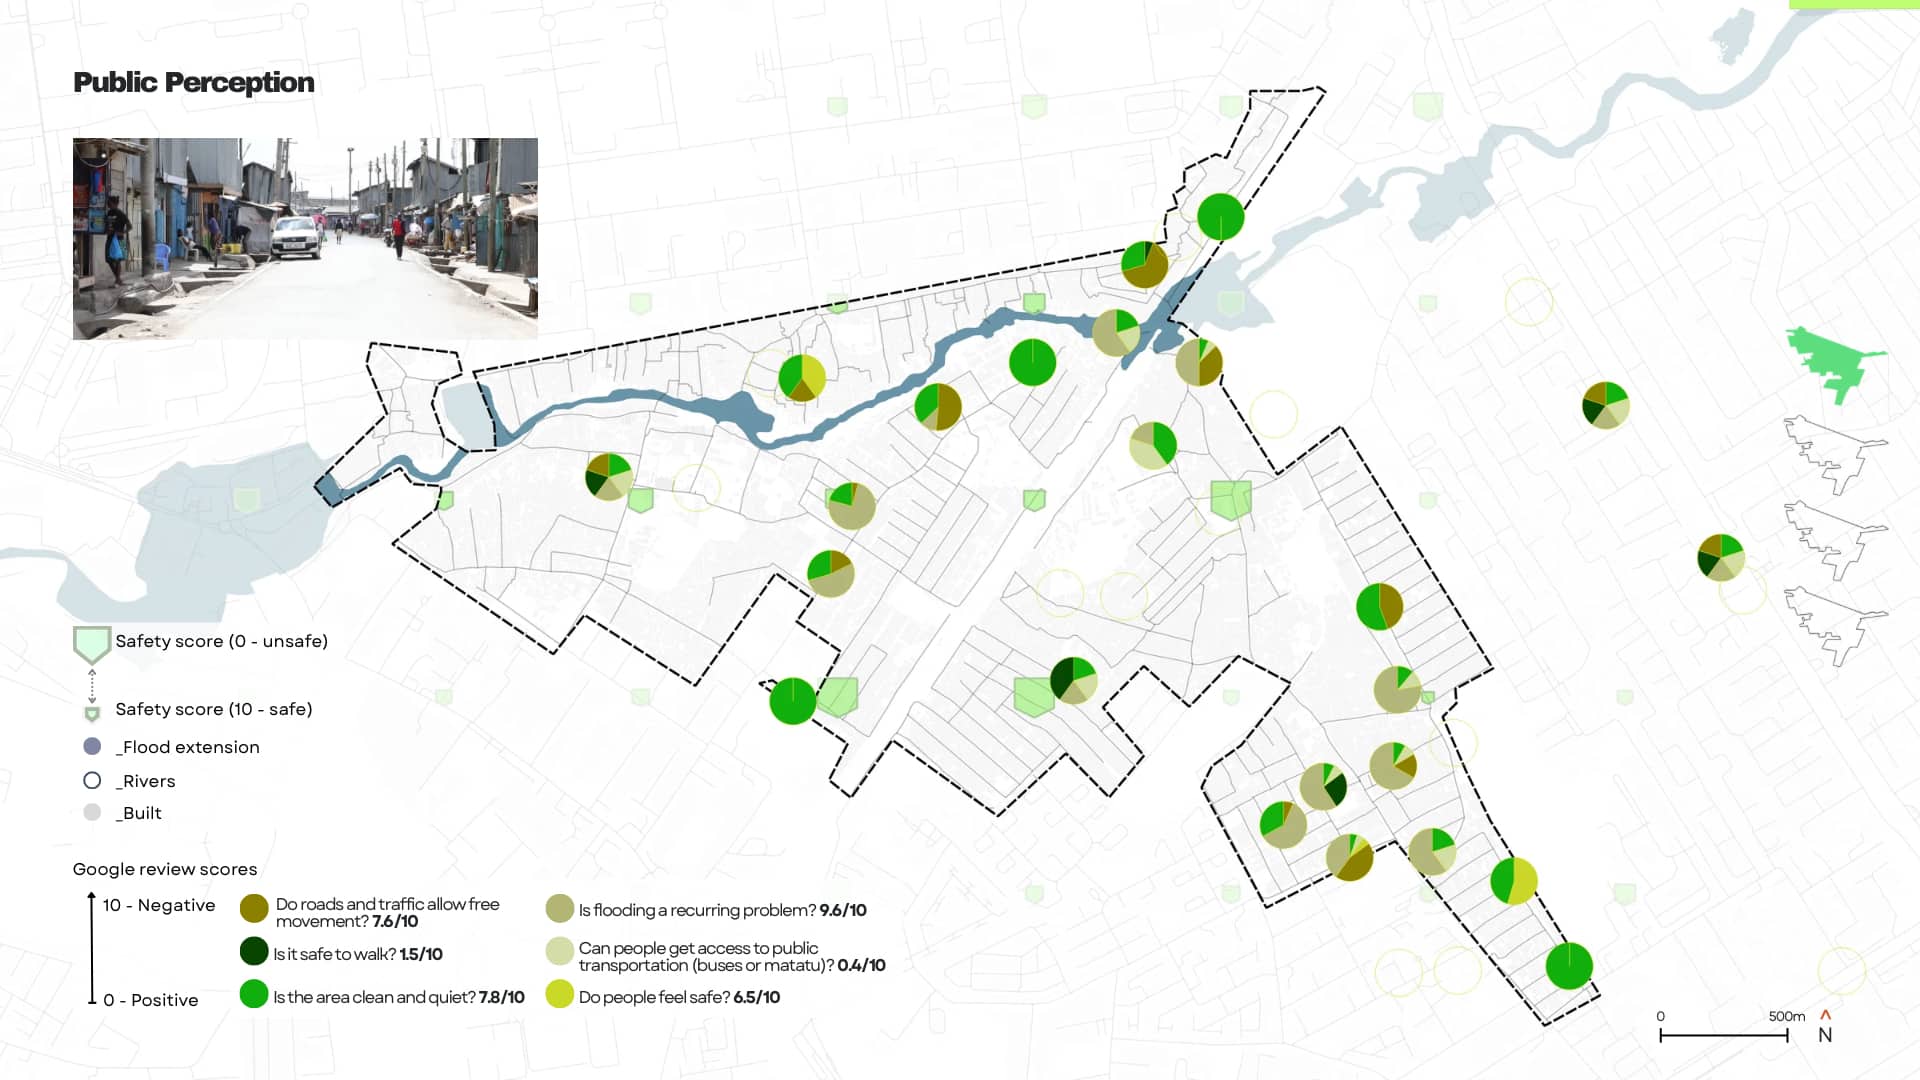
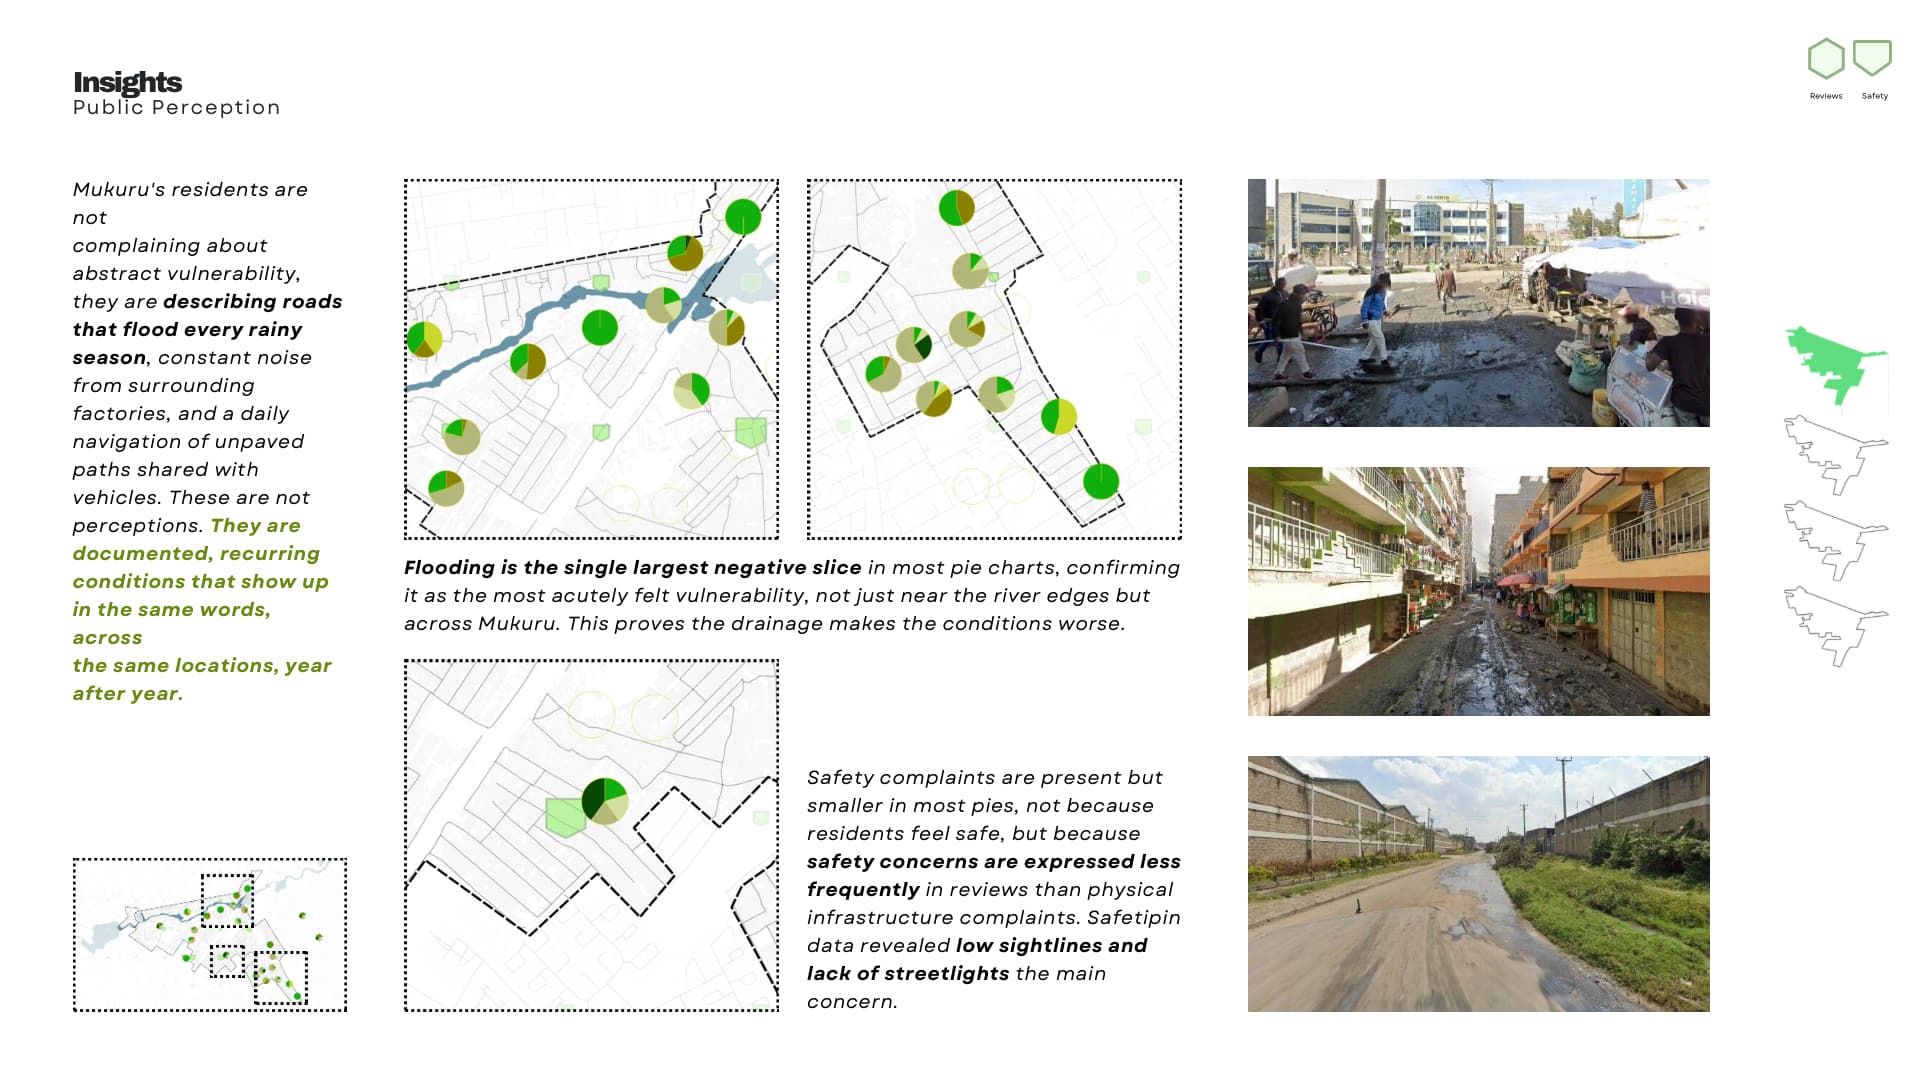
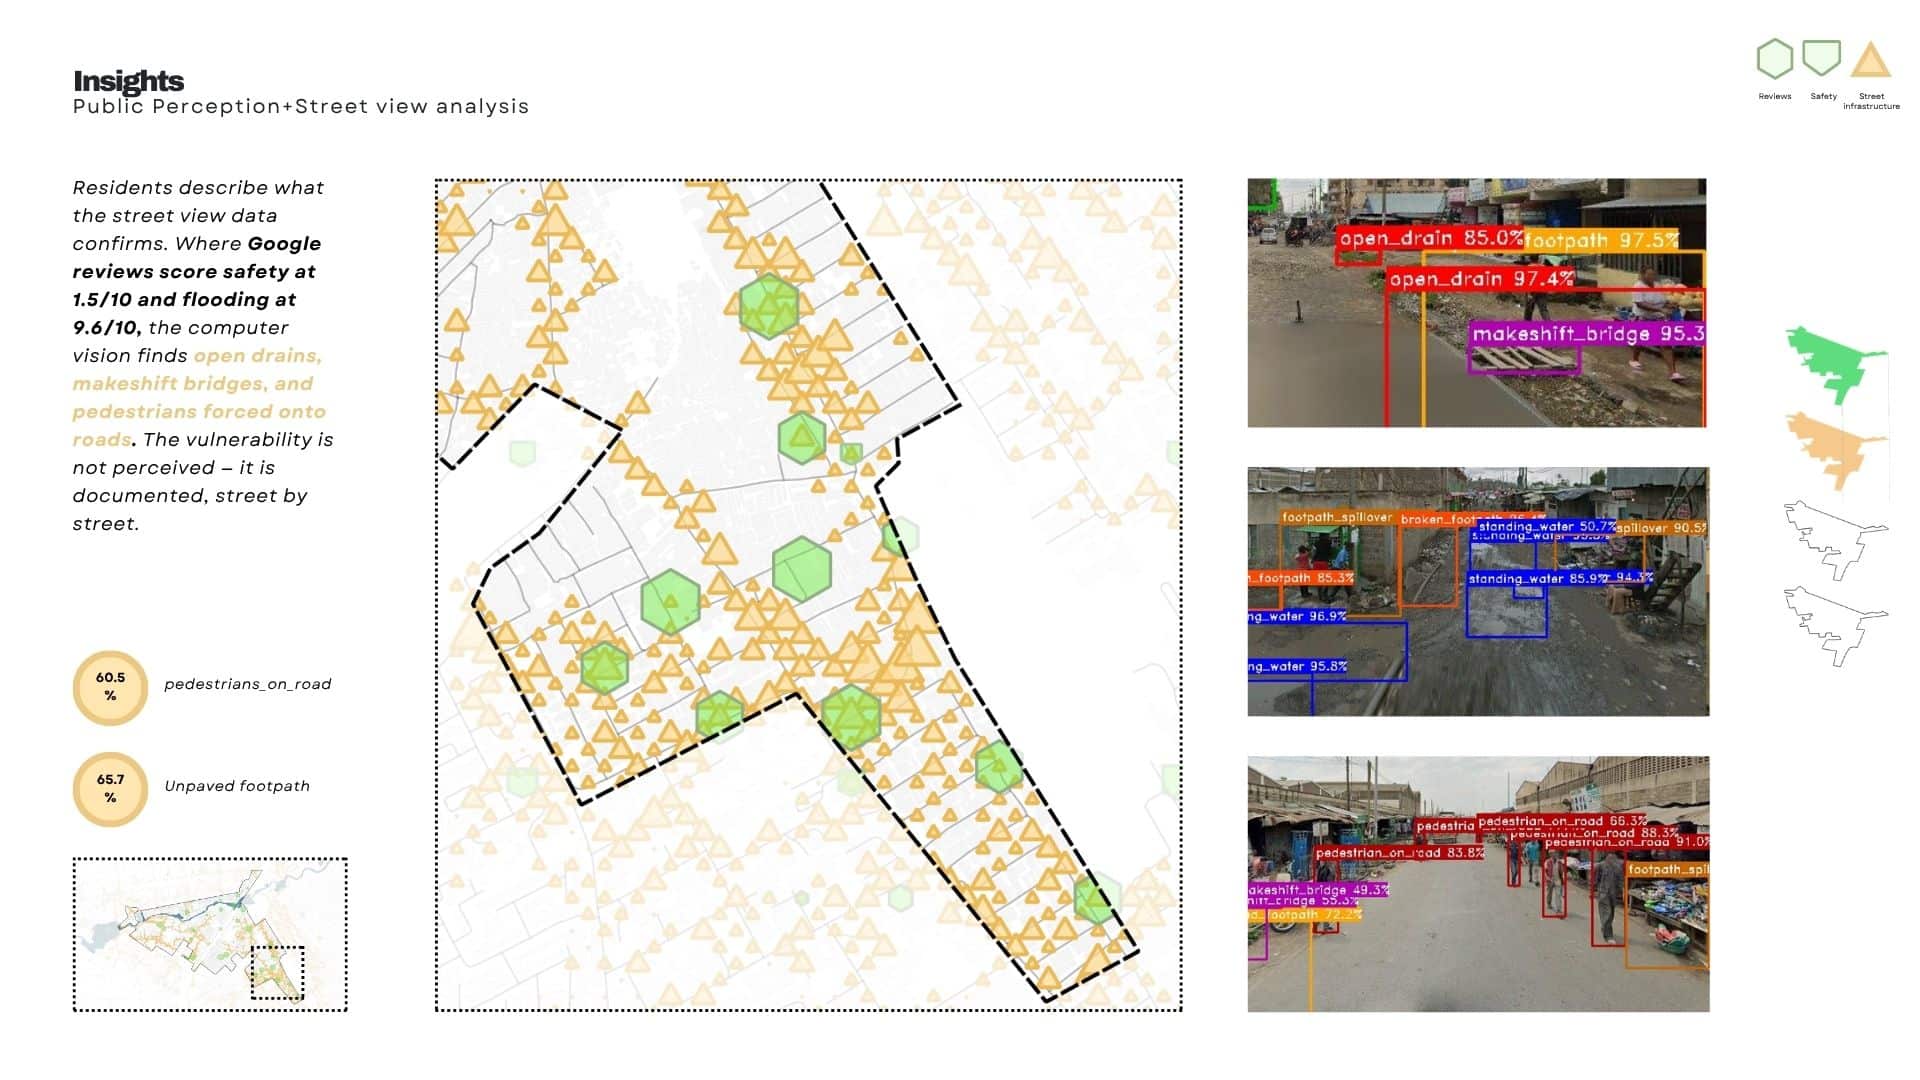
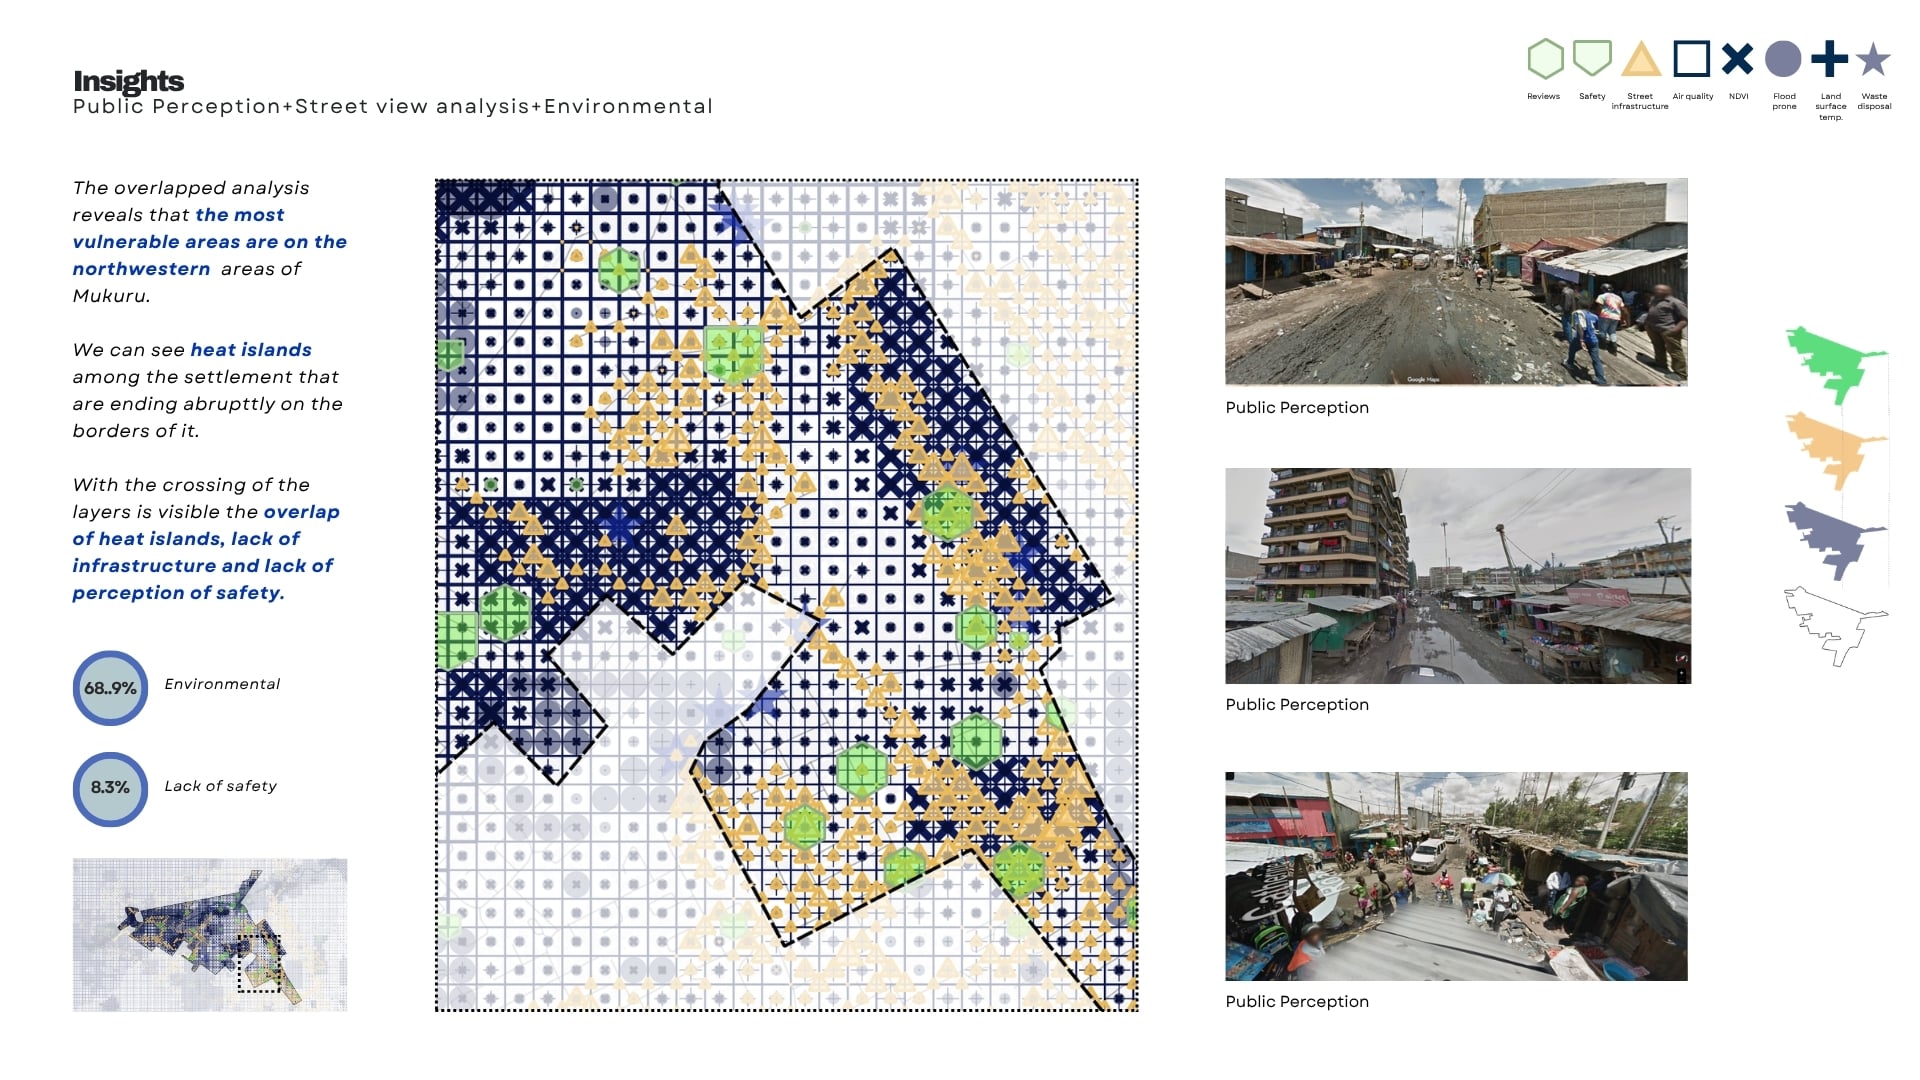
What residents say. We analysed SDI Kenya reports, Google reviews, and Safetipin safety-audit data, sorting resident complaints into six recurring questions: do people feel safe, do roads allow free movement, is it safe to walk, is flooding a recurring problem, can people access public transport, and is the area clean and quiet. The scores that came back were not evenly distributed. Flooding scored 9.6 out of 10 as a negative — the single largest complaint in almost every neighbourhood. Walking safety scored 1.5 out of 10, and access to public transport scored a striking 0.4 out of 10. Meanwhile, cleanliness and general safety both scored closer to the positive end, around 7–8 out of 10. The unevenness mattered: it told us vulnerability in Mukuru isn’t one uniform condition, it’s several distinct, locatable problems layered on top of each other. Interestingly, explicit safety complaints showed up less often in the review data than physical infrastructure complaints — not because residents feel safe, but because infrastructure problems simply get mentioned more often in service-style reviews. Safetipin’s independent audit data, which specifically tracks lighting and sightlines, confirmed that safety concerns were very real even where they were under-represented in the review text.
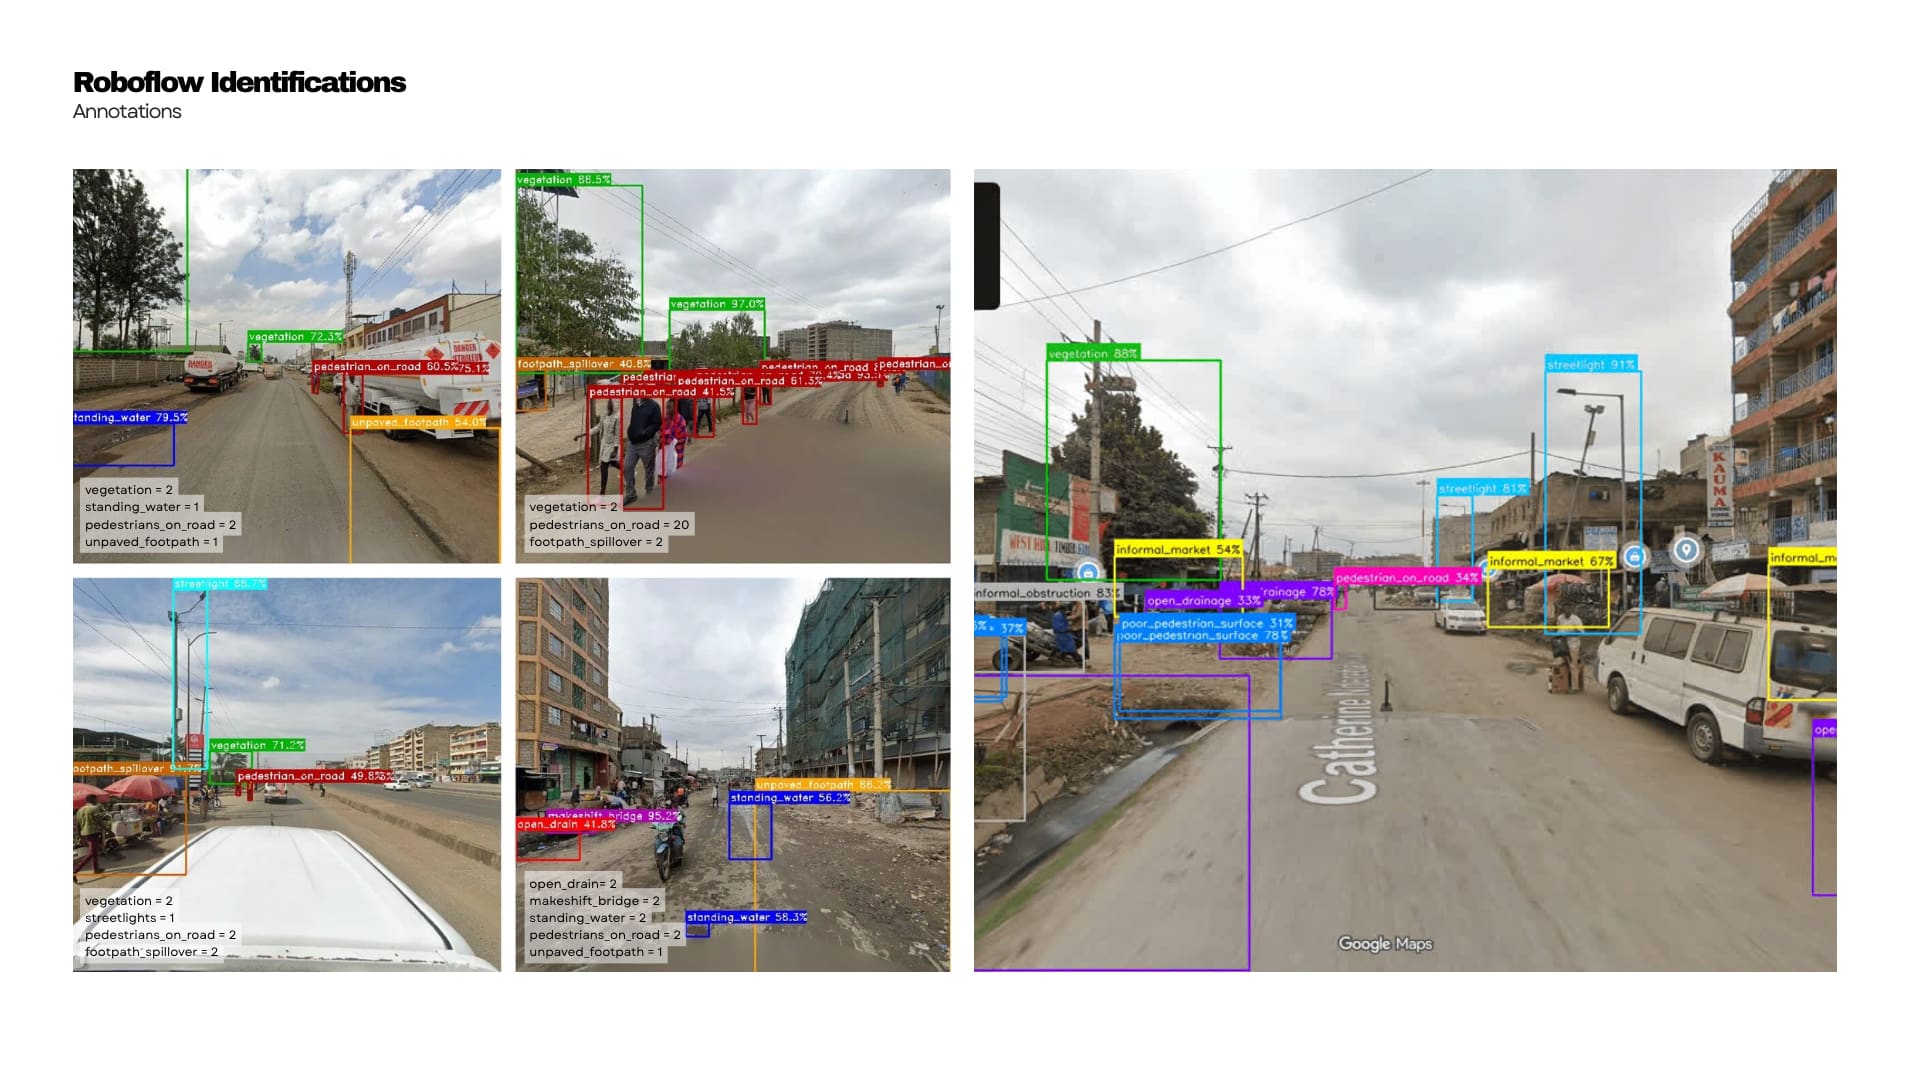
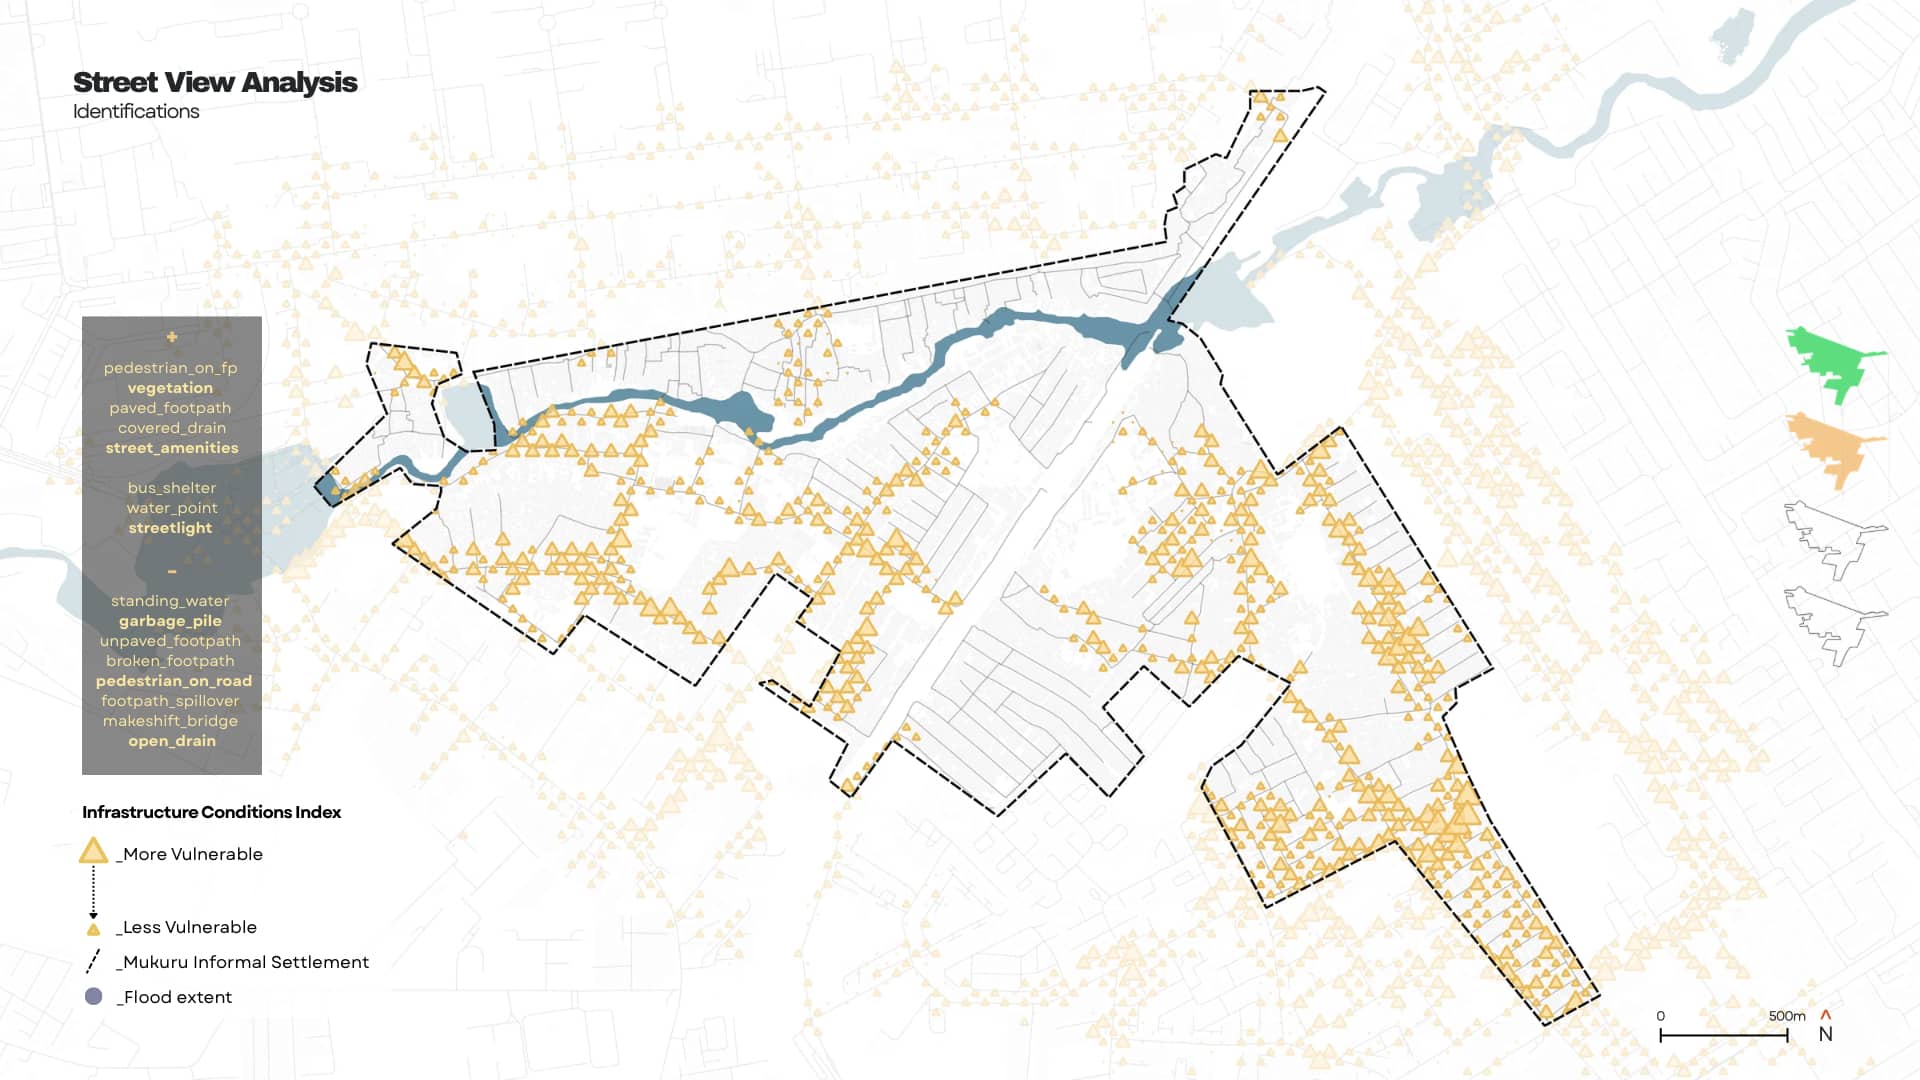
What the street actually looks like. We ran a street-view image analysis using a Roboflow-trained model to classify physical conditions block by block — tagging things like unpaved footpaths, pedestrians forced onto roads, open drains, standing water, and footpath spillover. The results backed up what residents had already told us: 60.5% of analysed conditions showed pedestrians walking on the road rather than a footpath, and 65.7% showed unpaved footpaths. Perception and street-level reality were telling the same story from two completely different data sources.
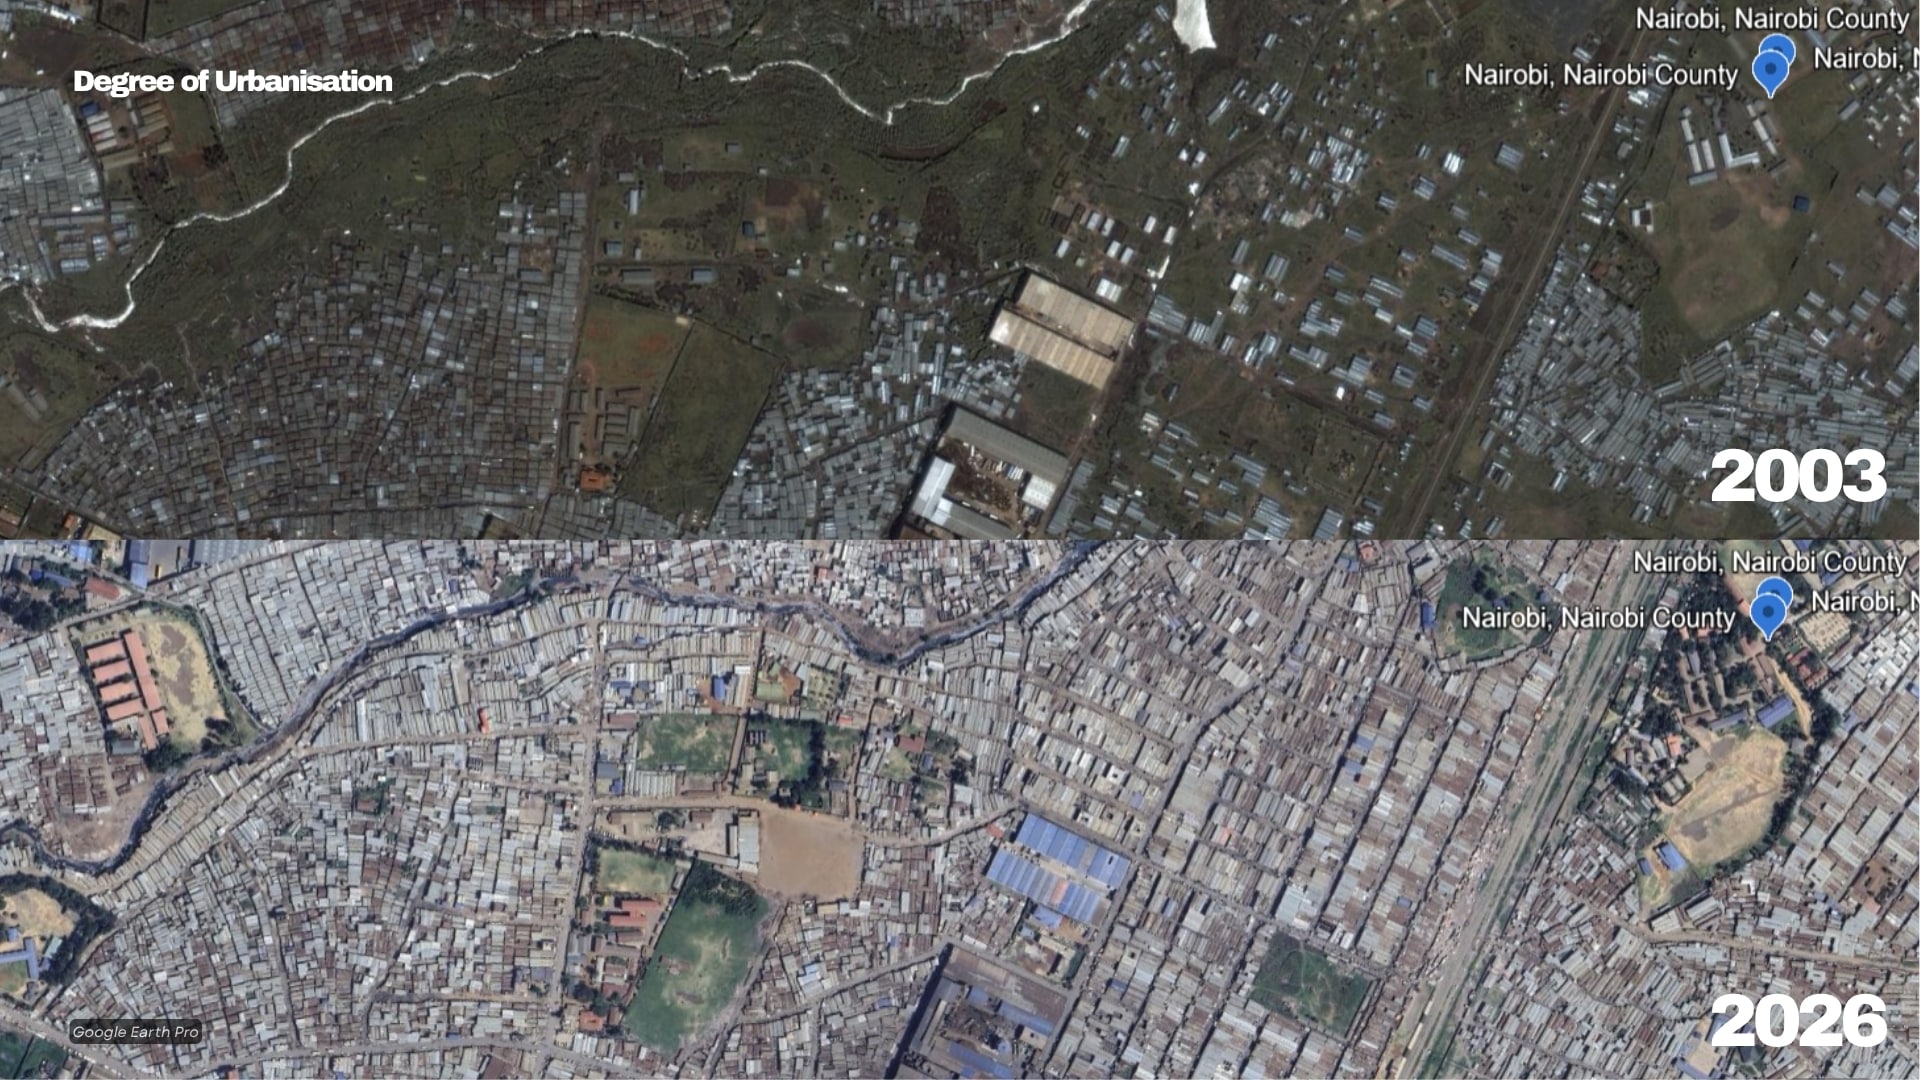
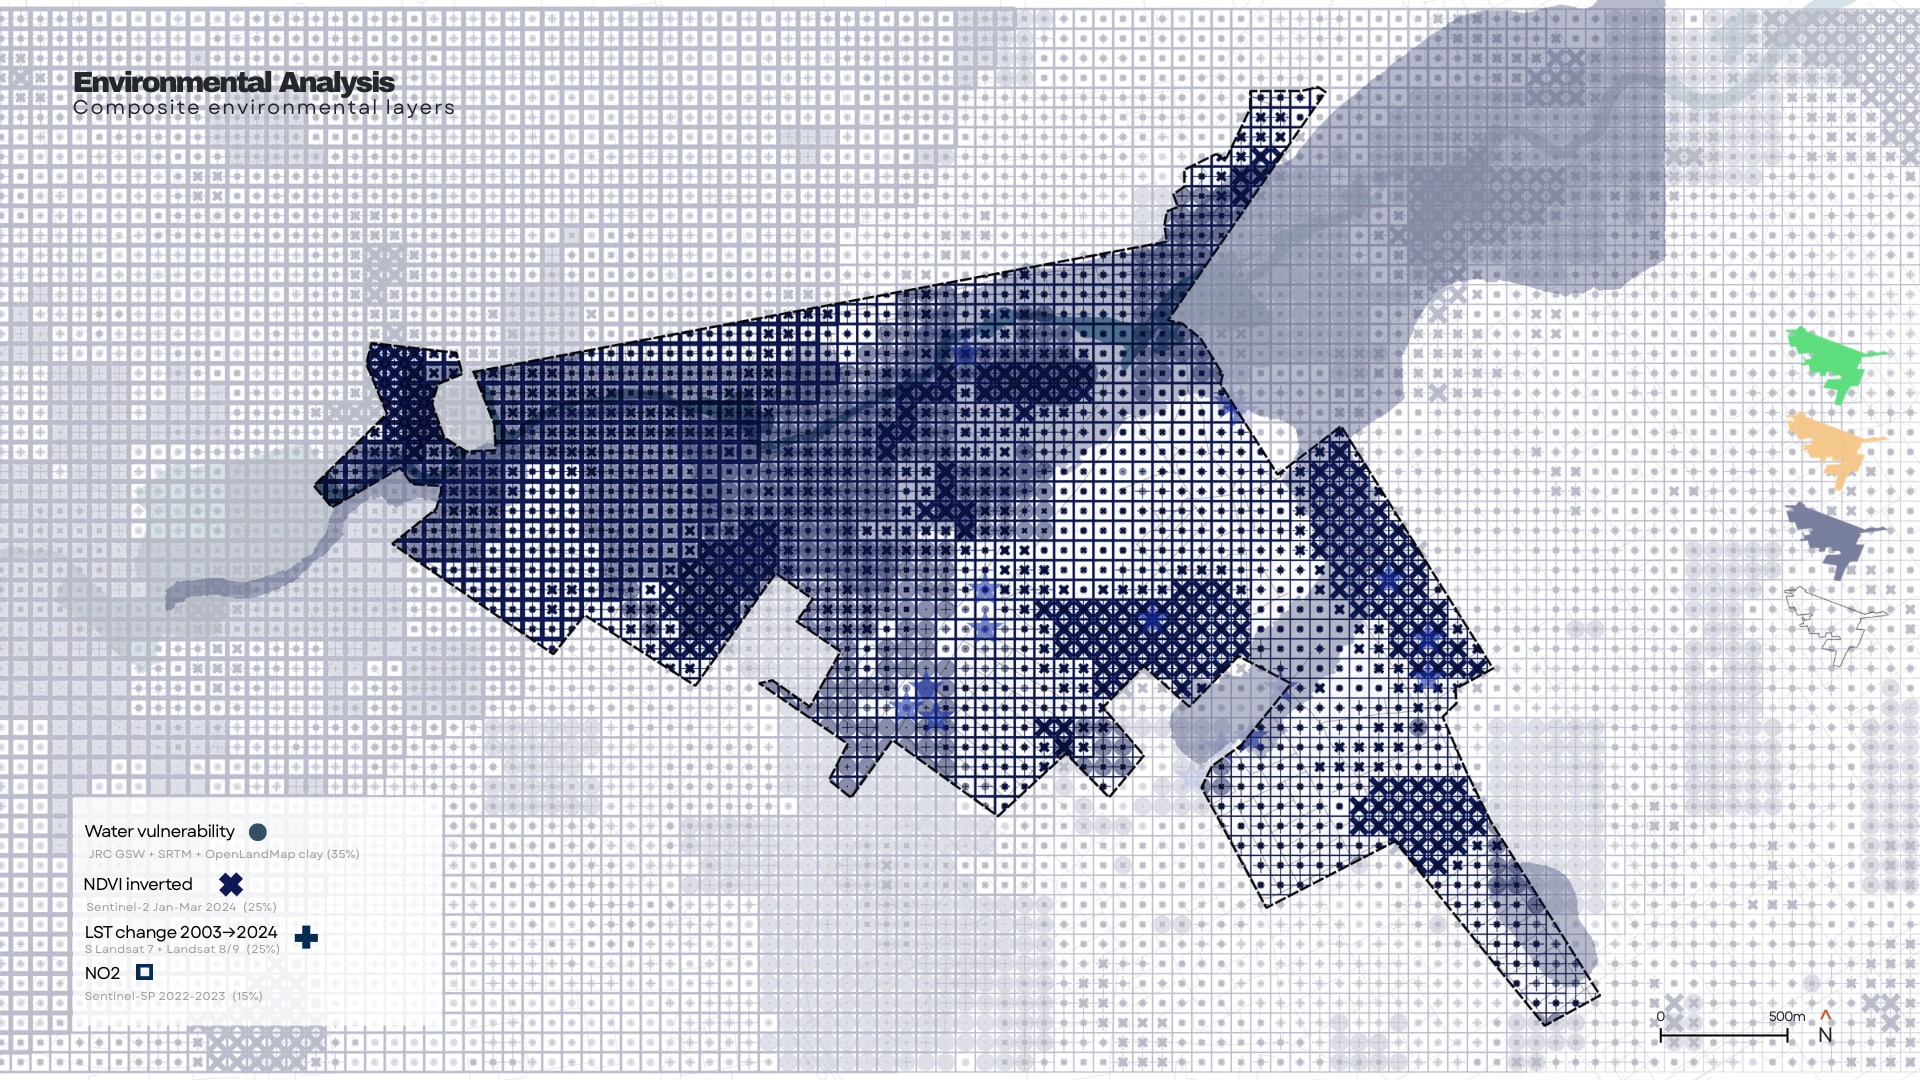
What the environment is doing. We built a composite environmental vulnerability index from four satellite-derived layers, weighted by relative impact: water vulnerability (35%, combining JRC Global Surface Water, SRTM elevation, and OpenLandMap soil data), inverted vegetation cover or NDVI (25%, from Sentinel-2 imagery), land surface temperature change between 2003 and 2024 (25%, from Landsat 7 and 8/9), and NO₂ concentration (15%, from Sentinel-5P). Comparing satellite imagery of Mukuru from 2003 to 2026 shows just how much open land has converted into dense built fabric over two decades — and the environmental index shows that vulnerability isn’t spread evenly across the settlement. It concentrates sharply in the northwestern areas and along the river corridor, with heat islands that end almost abruptly at the settlement’s edge.
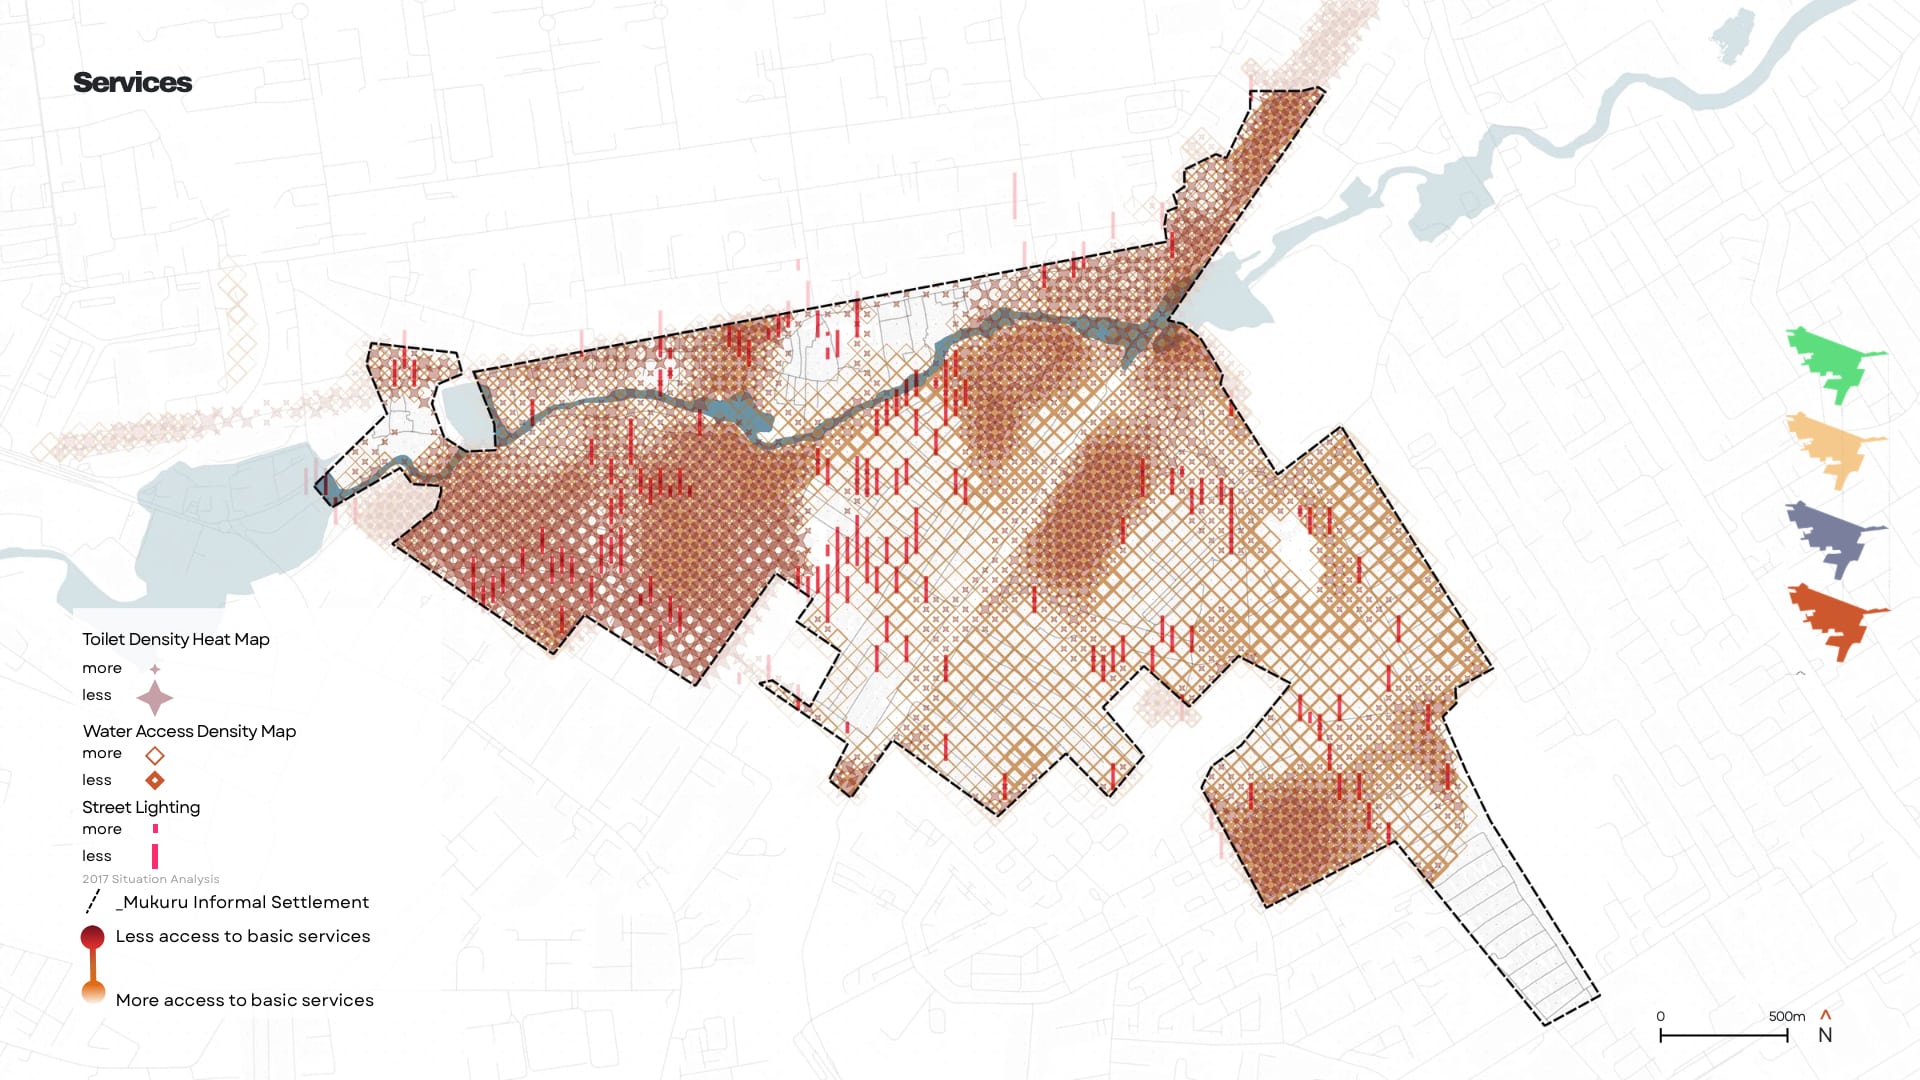
What services are missing. Mapping toilet density, water access, and street lighting against a 2017 baseline situation analysis revealed real gaps: 55% of the settlement has poor street lighting, 65% has low access to toilets, and 60% lacks reliable water access.
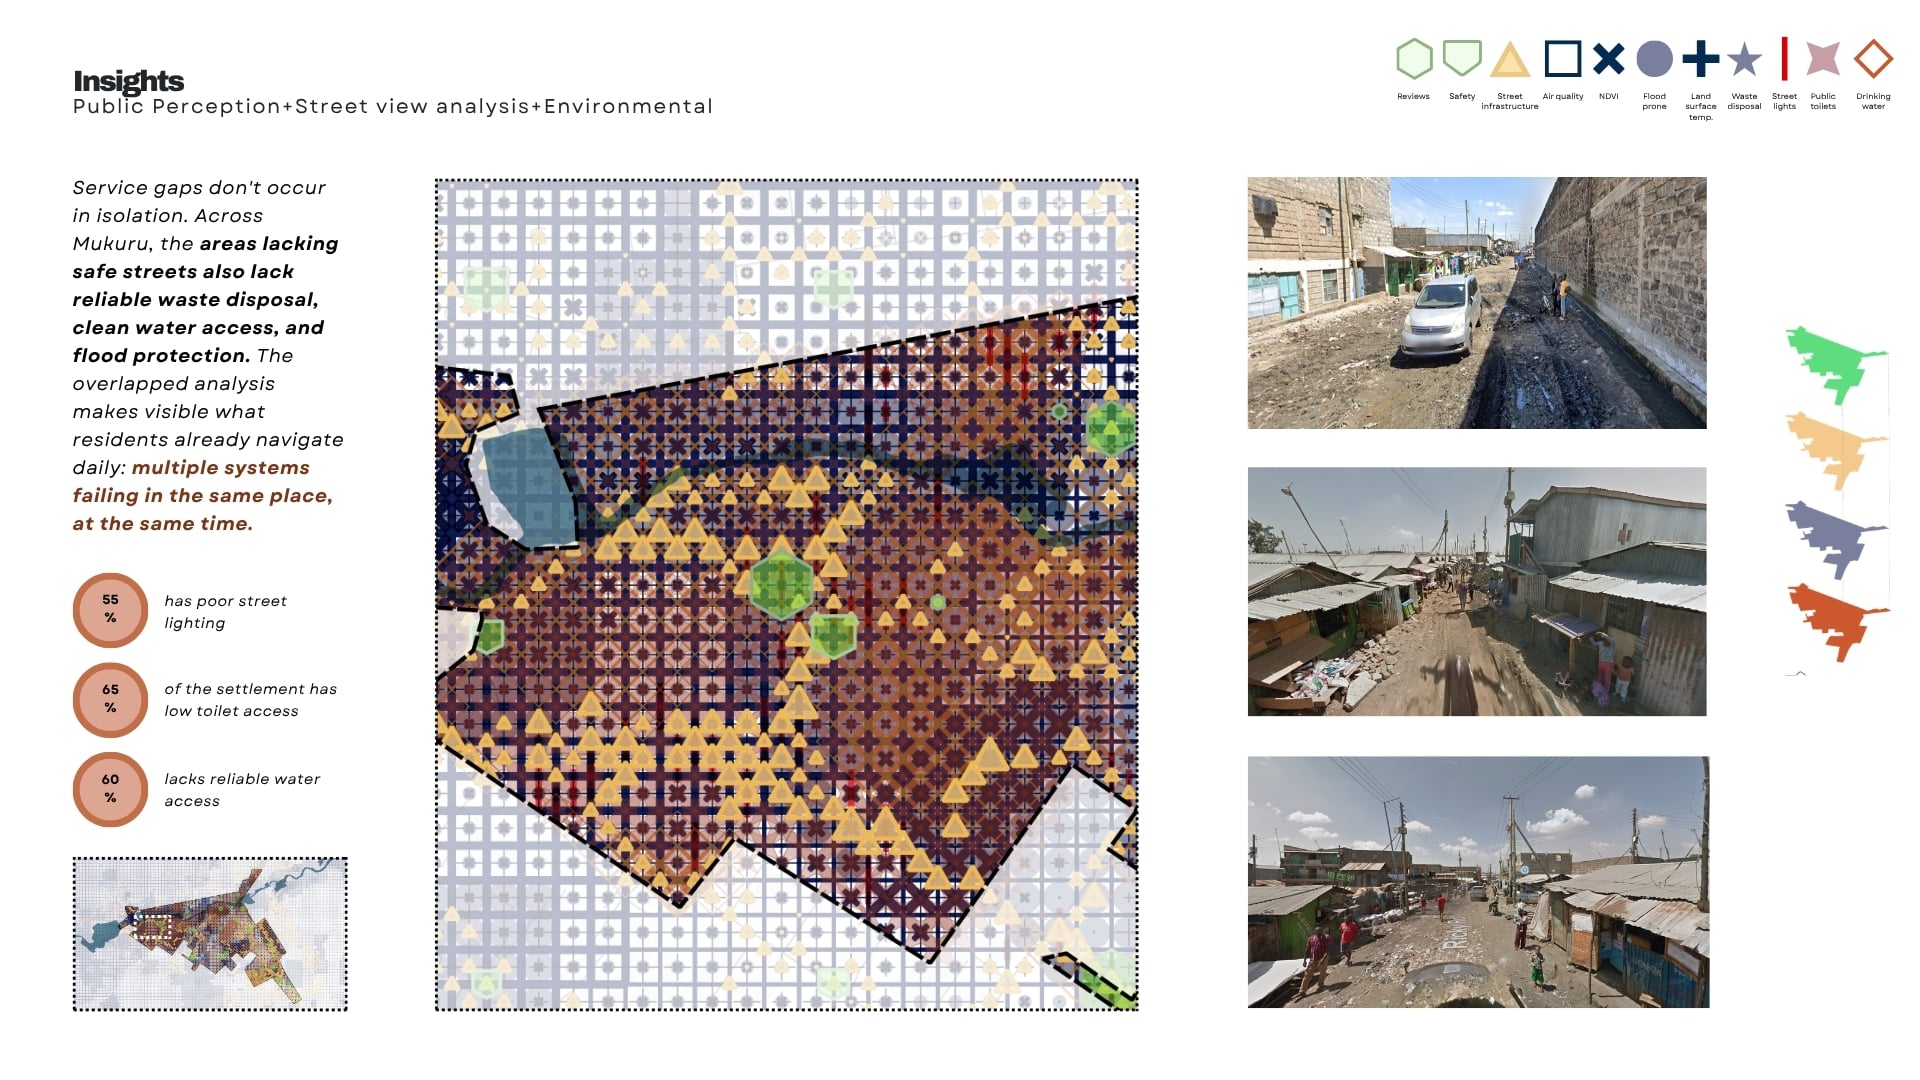
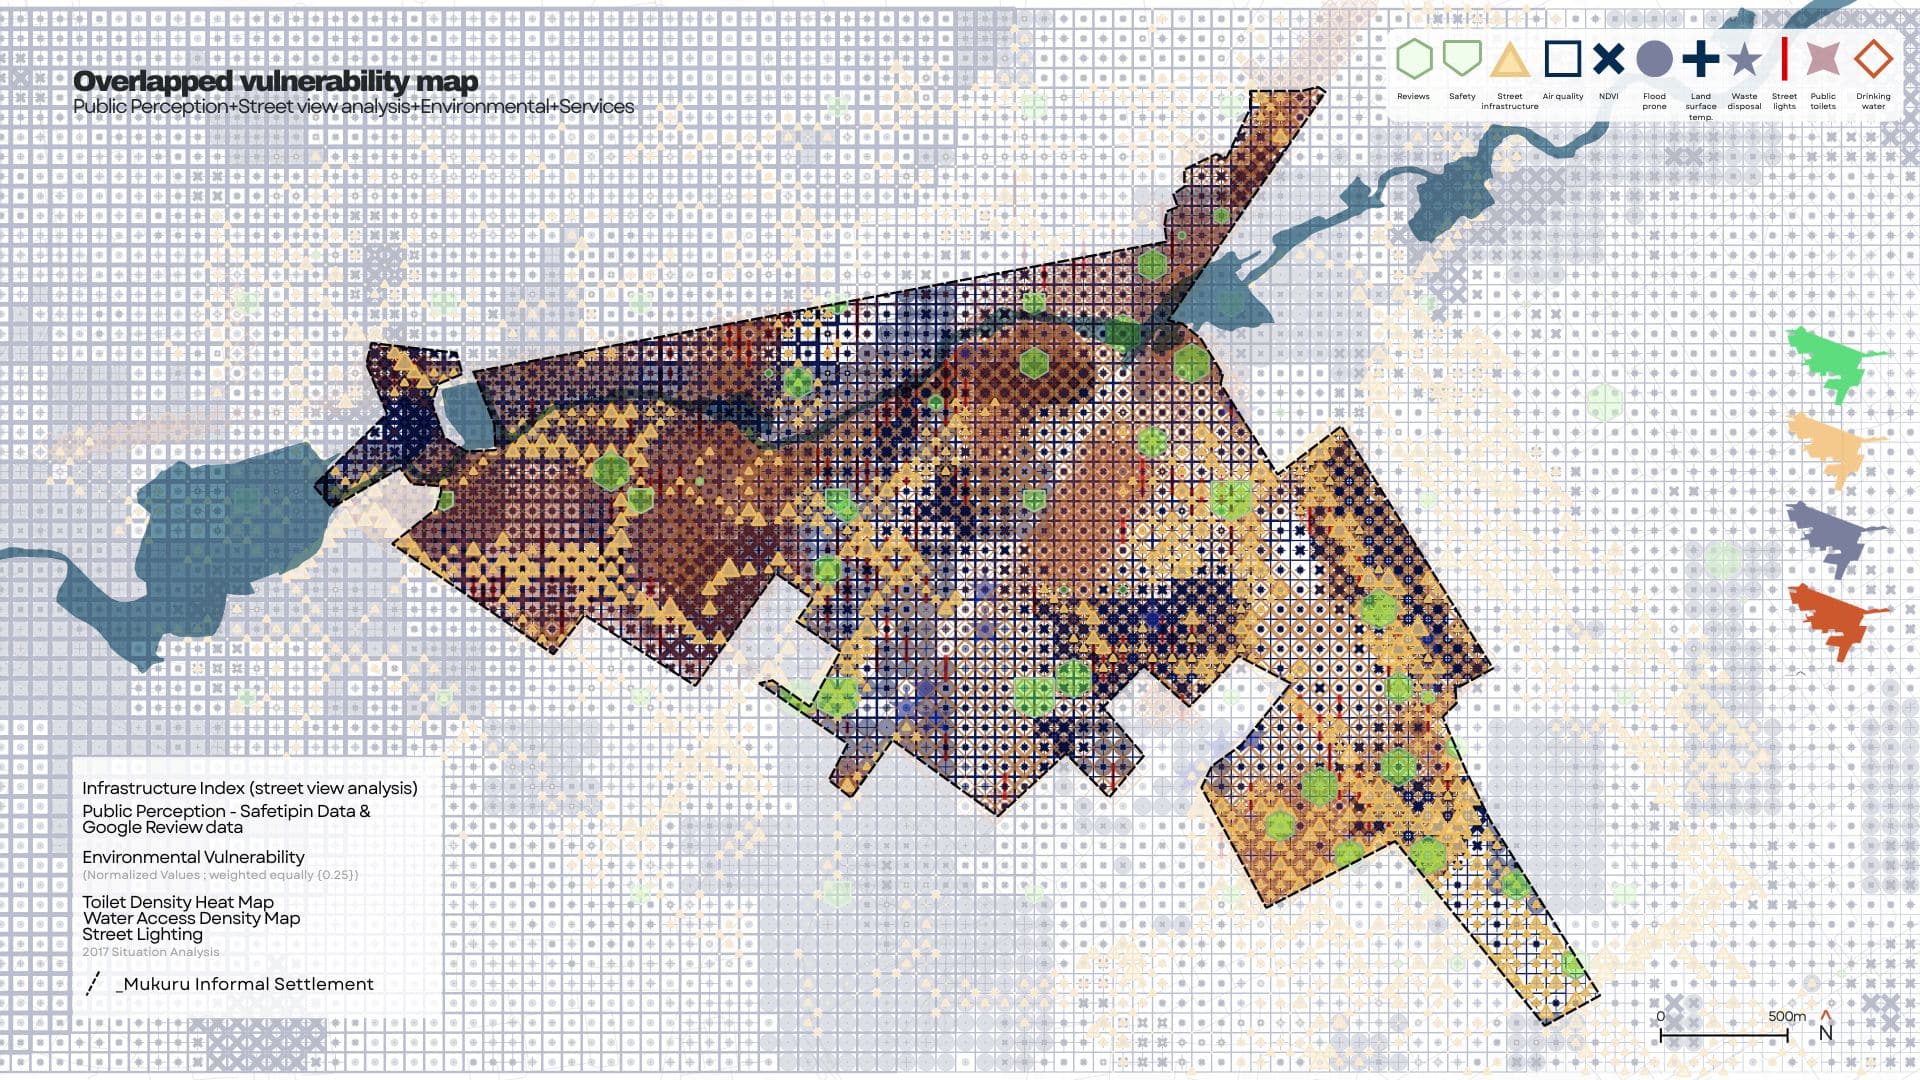
When we layered all four analyses together — normalised and weighted equally — clear clusters of overlapping vulnerability emerged, concentrated where environmental pressure, weak services, and unsafe mobility conditions converge in the same place at the same time. A rough proportional read of that composite map suggests environmental factors account for around 69% of identified issues, infrastructure gaps around 23%, and safety around 8% — useful as a directional read of where the pressure sits, even though it’s a pixel-based approximation rather than an exact GIS cell count.
From Analysis to Strategy
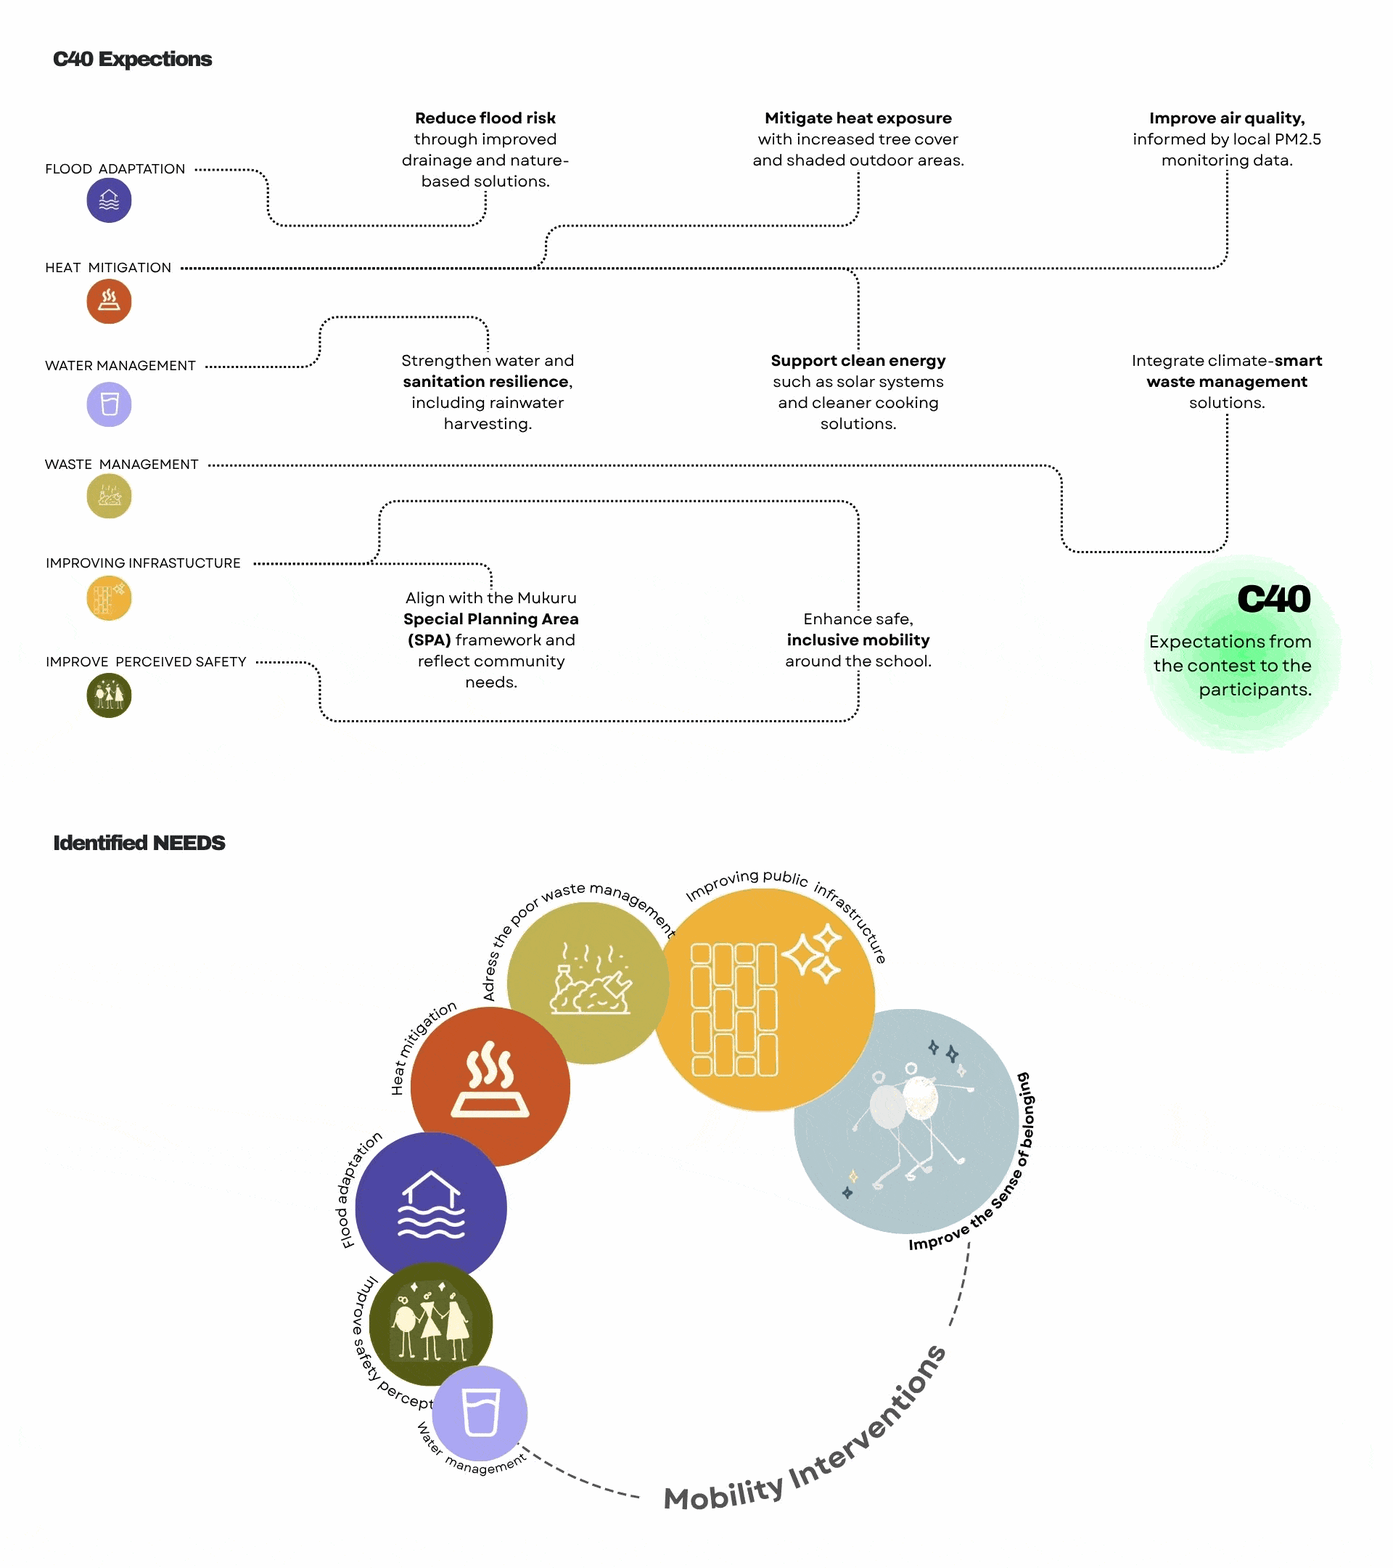
We mapped our findings directly against the C40 Cities challenge framework — flood adaptation, heat mitigation, water management, waste management, improved infrastructure, and improved perceived safety — and used that alignment to write a single design statement that has guided everything since:
To create belonging in a constantly changing neighbourhood — through climate- and mobility-led interventions, a data-driven decision-making platform, and gamified participation tools.
To decide where those interventions should go, we returned to the composite vulnerability map and ran a 15-minute walking isochrone — modelling how far a healthy adult could reasonably travel on foot — across the worst-case vulnerability points. That let us group scattered problem spots into coherent intervention zones, and connect those zones into one continuous network, rather than treating each as an isolated fix.
Four interlocking goals shaped how we designed within that network: adaptability, upgrading infrastructure from the individual unit to the settlement scale without displacing anyone; placemaking for belonging, activating unsafe zones into genuinely inclusive public space; ownership through participation, building economic opportunity and transferable skills through the construction process itself; and policy and network connection, closing the systemic service gaps that would otherwise undermine every spatial intervention over time.
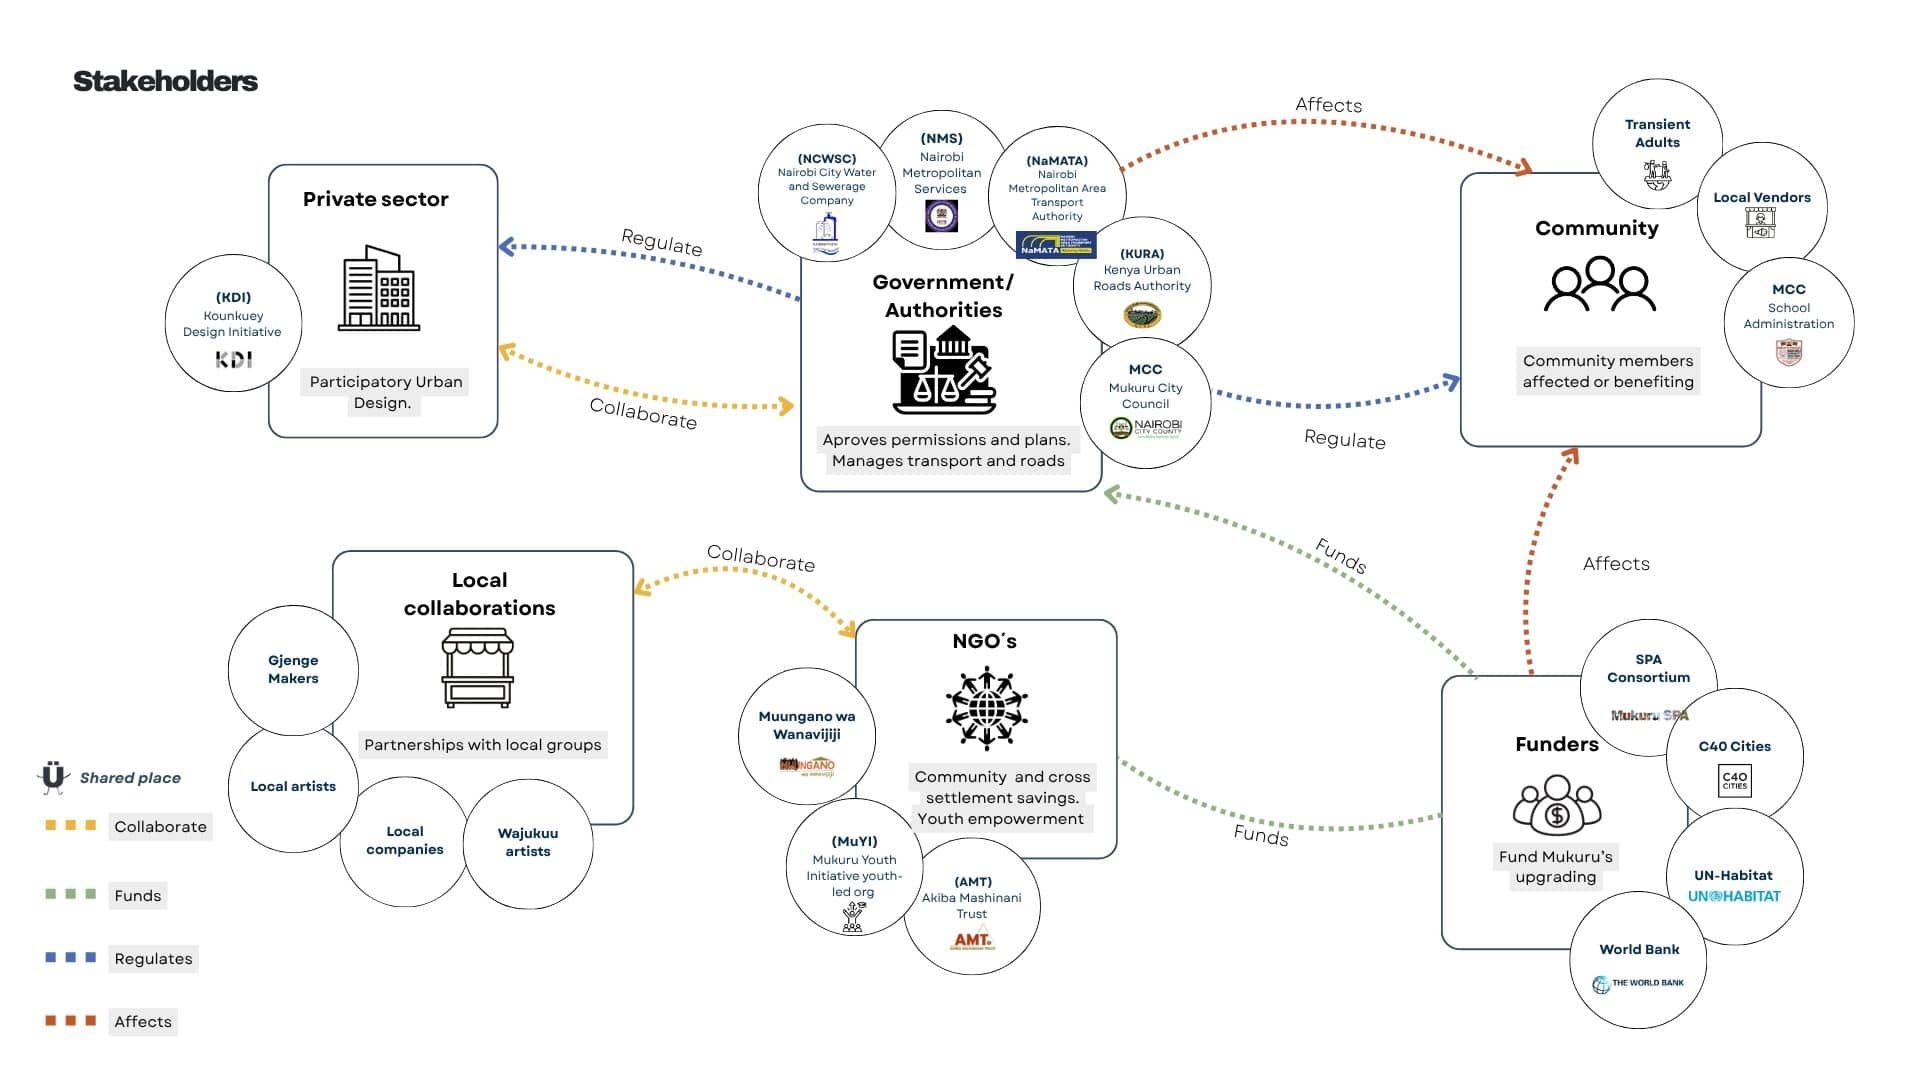
None of this works without the people who actually hold Mukuru together. Delivery depends on a wide stakeholder ecosystem: government and regulatory bodies (Nairobi Metropolitan Services, the Nairobi City Water and Sewerage Company, NaMATA, KURA, the Mukuru City Council), NGOs and community organisations (Akiba Mashinani Trust, Muungano wa Wanavijiji, Kounkuey Design Initiative, Mukuru Youth Initiative), funders (the SPA Consortium, C40 Cities, UN-Habitat, the World Bank), and local collaborators including Gjenge Makers and Wajukuu artists.
We structured delivery as a four-phase roadmap: data collection in Year 1 (roughly USD 120,000), planning and design across Years 1–3 (roughly USD 40,000), implementation across Years 2–5 (roughly USD 960,000), and maintenance and scaling across Years 5–10 (roughly USD 985,000) — moving from street-level pilots to neighbourhood-scale rollout as evidence accumulates.
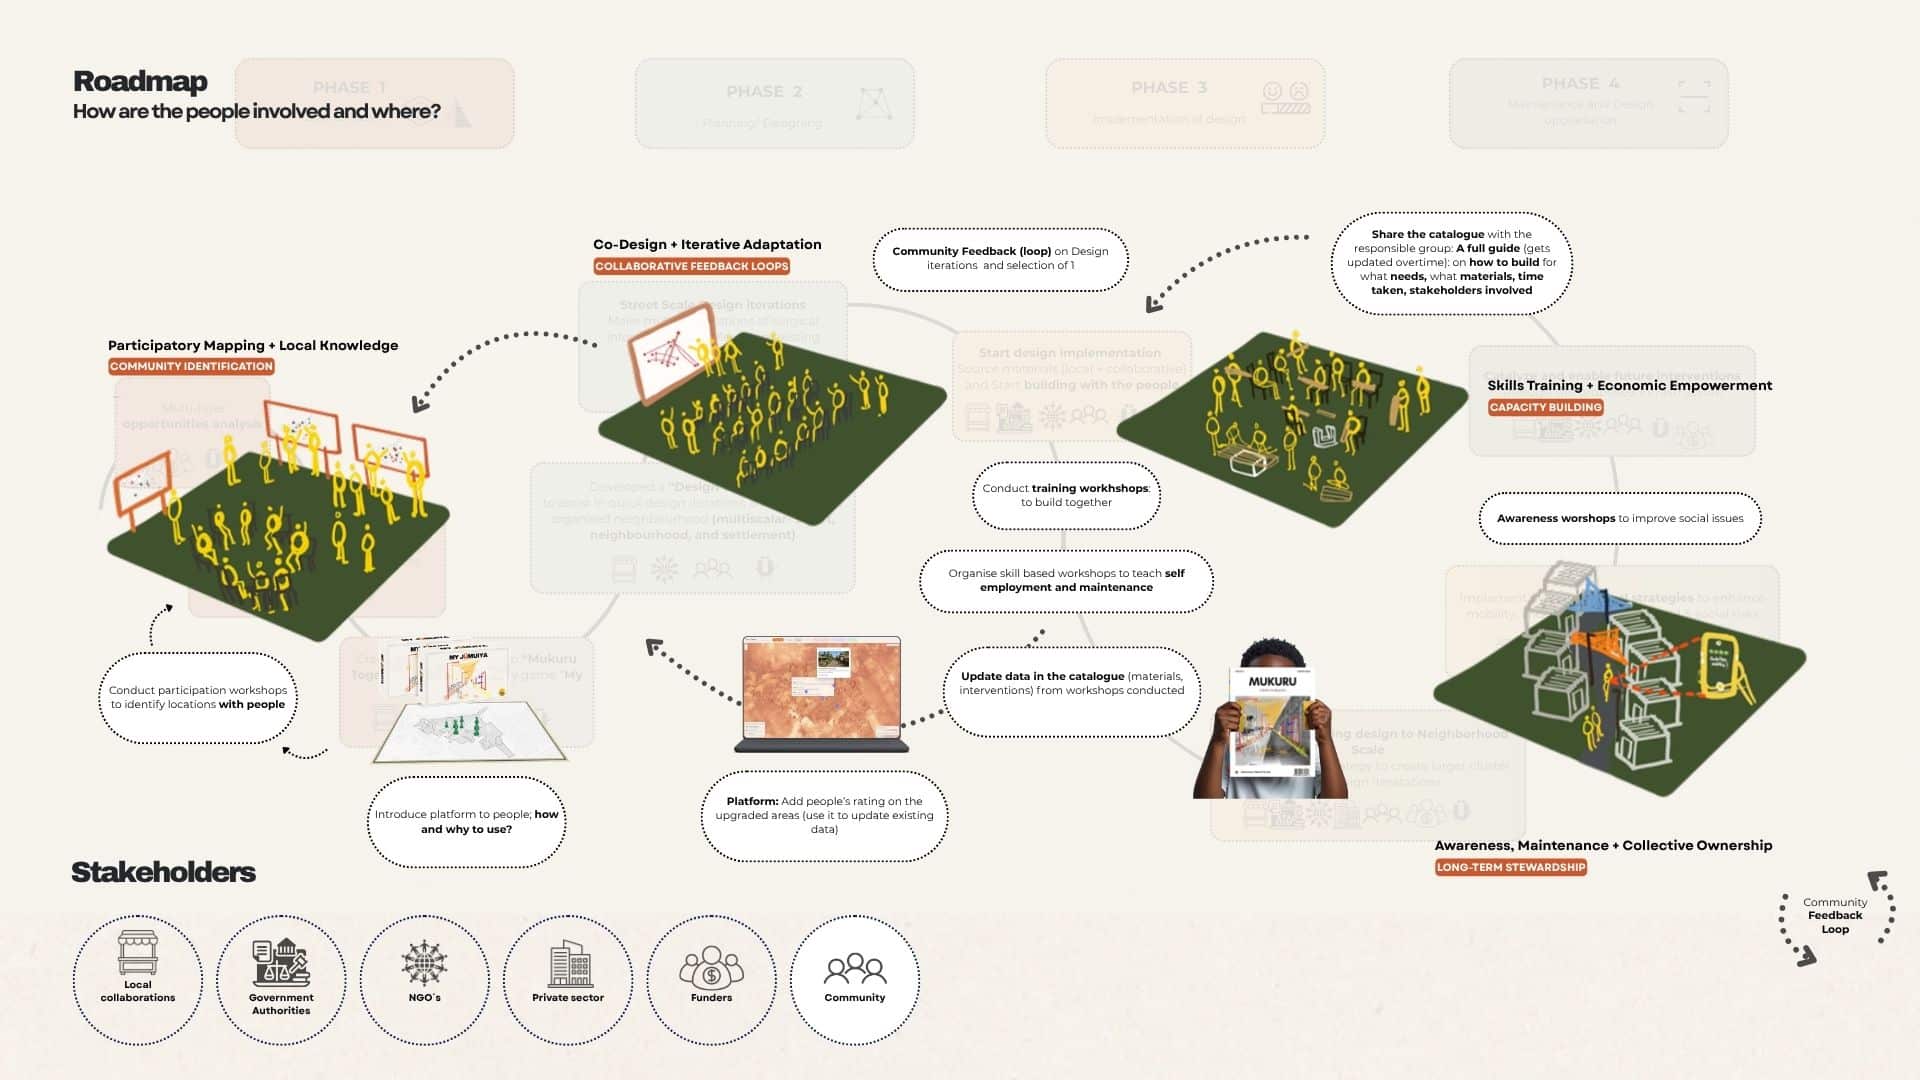
Three Tools for a Self-Organising Neighbourhood
To keep that participation real rather than performative, we built three connected tools.
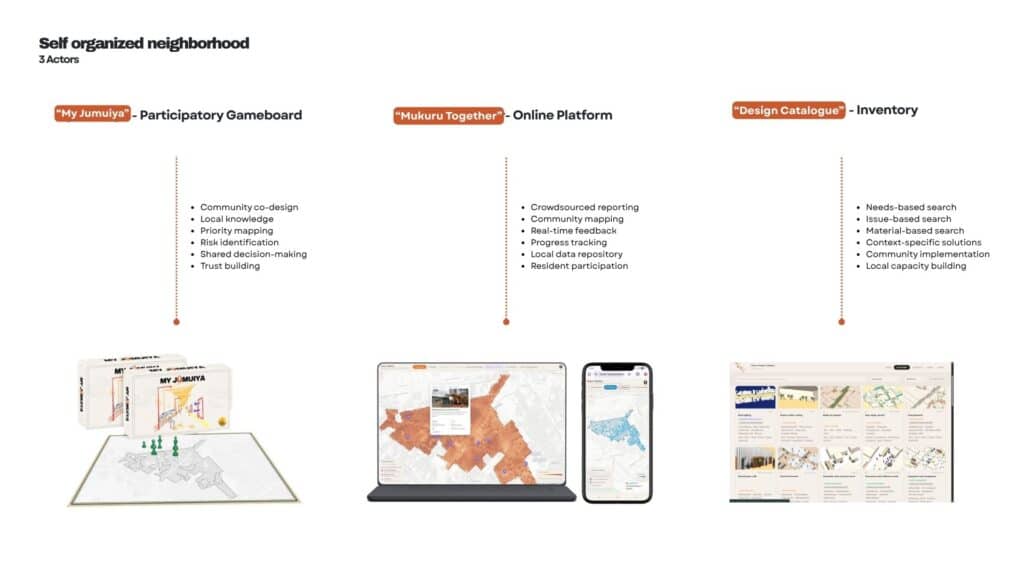
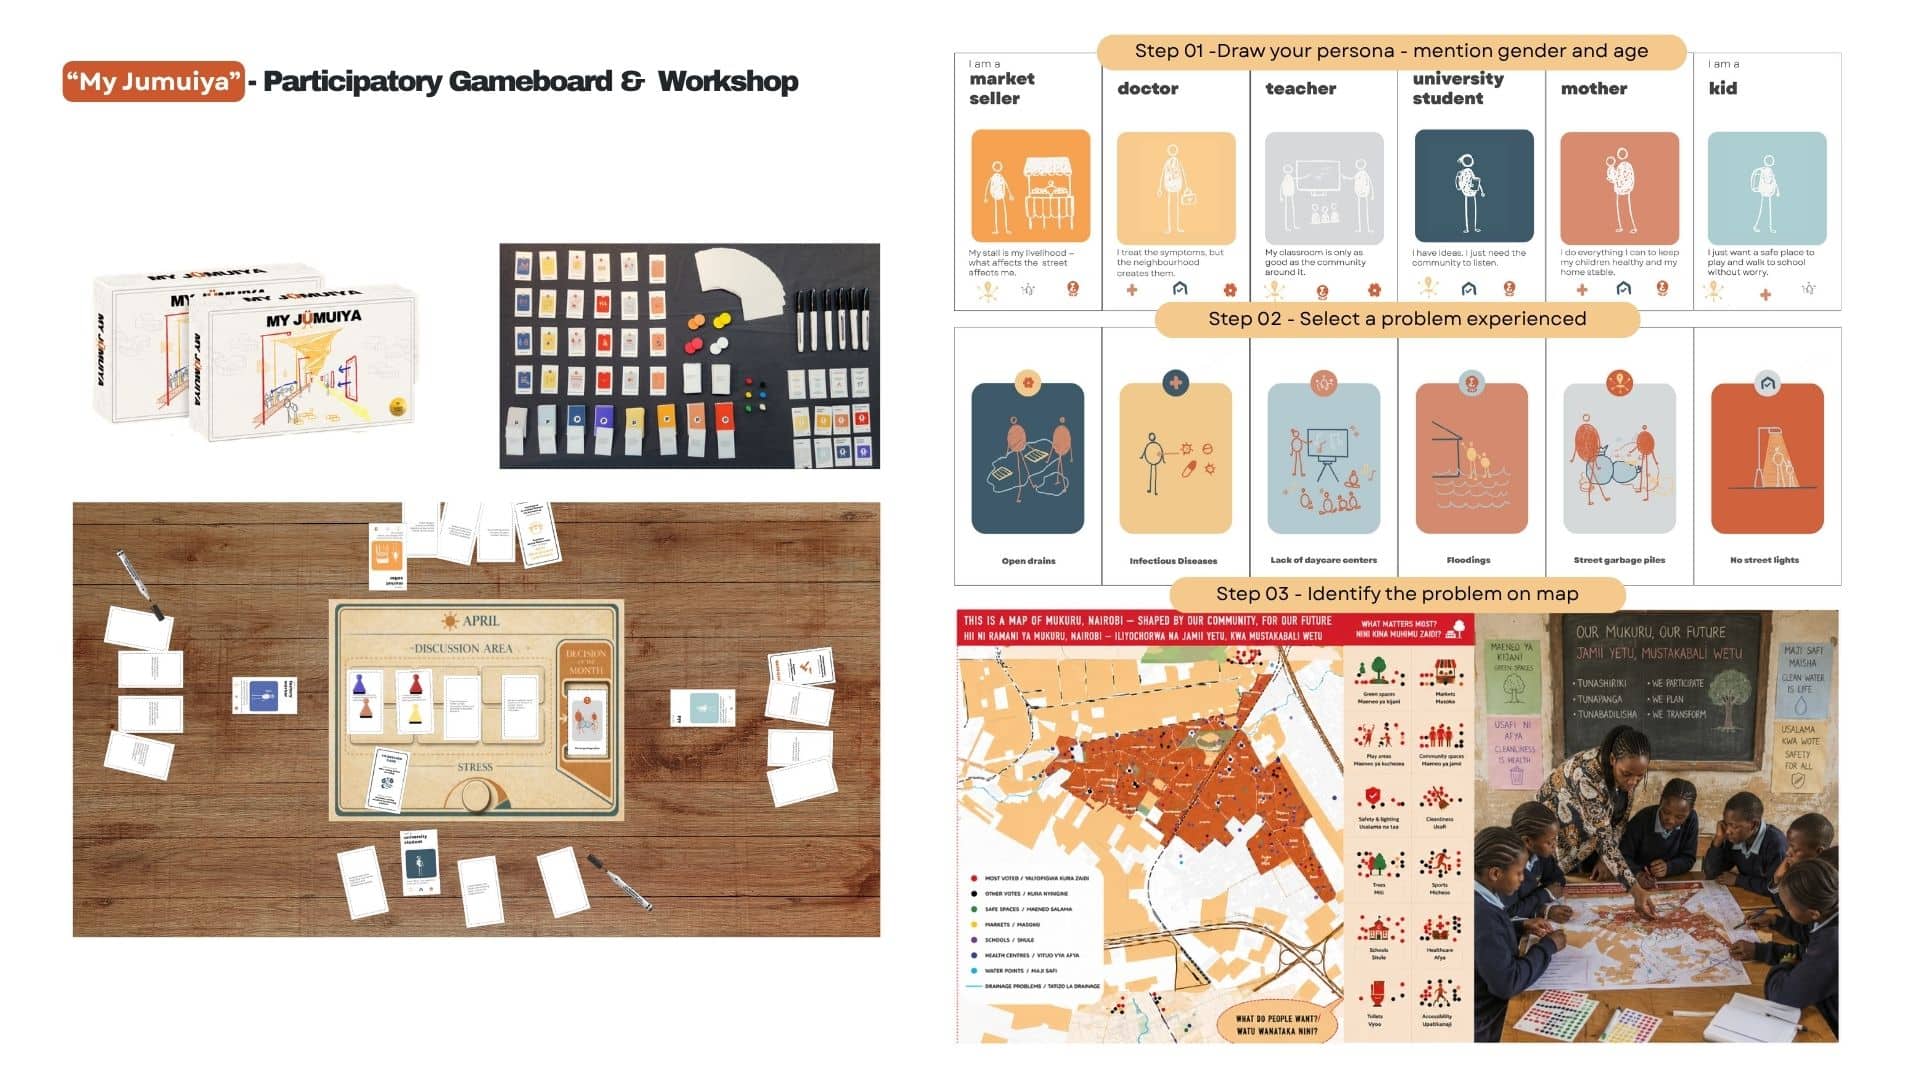
My Jumuiya is a participatory gameboard used at the very start of the process. Residents draw a persona, name a problem they’ve actually experienced, and place it on a physical map — combining lived, local knowledge with the spatial analysis from day one, and cross-validating both against each other.
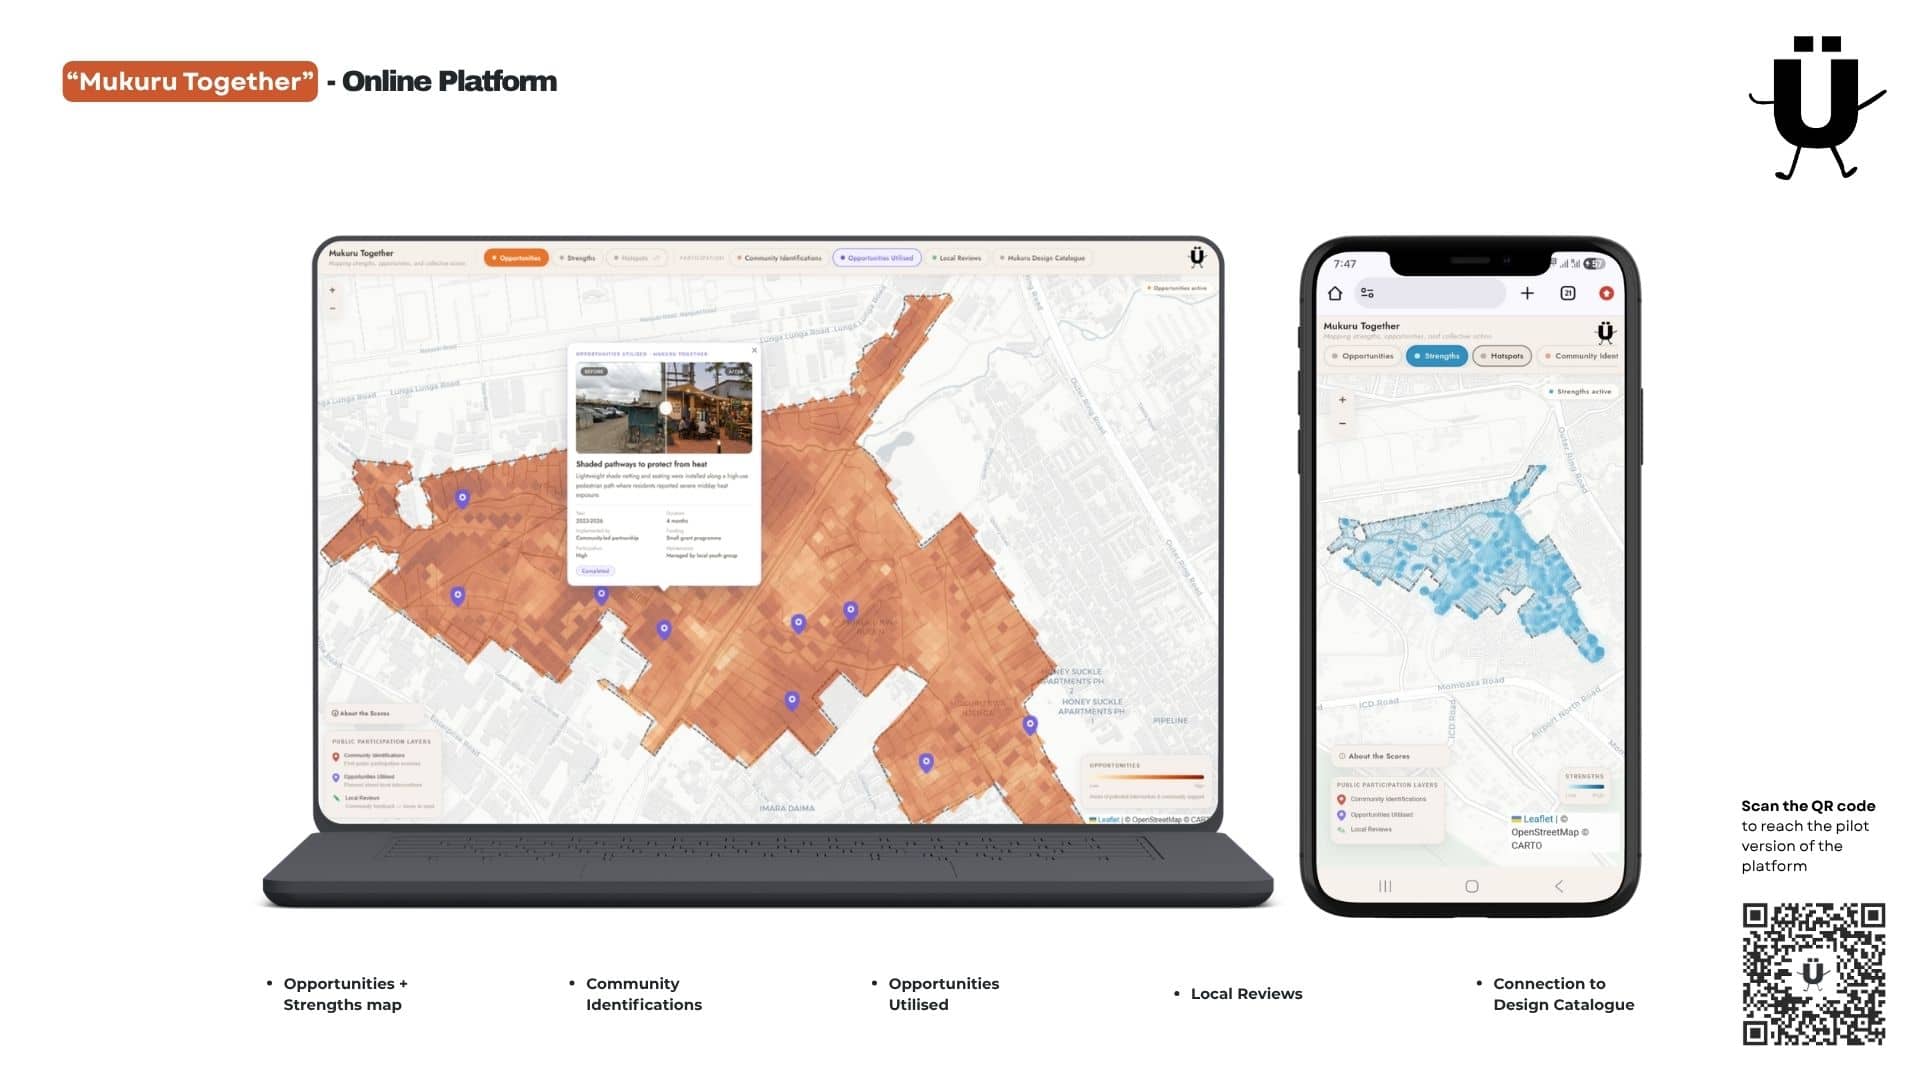
Mukuru Together is a live, public decision-making platform — already running as a pilot — that brings opportunities, strengths, community-flagged issues, local reviews, and built projects together on a single shared map. Every location on the platform carries an opportunity score, drawn from environmental, infrastructure, social, and perception indicators, so the platform doesn’t just flag problems — it points toward where an intervention could have the greatest impact.
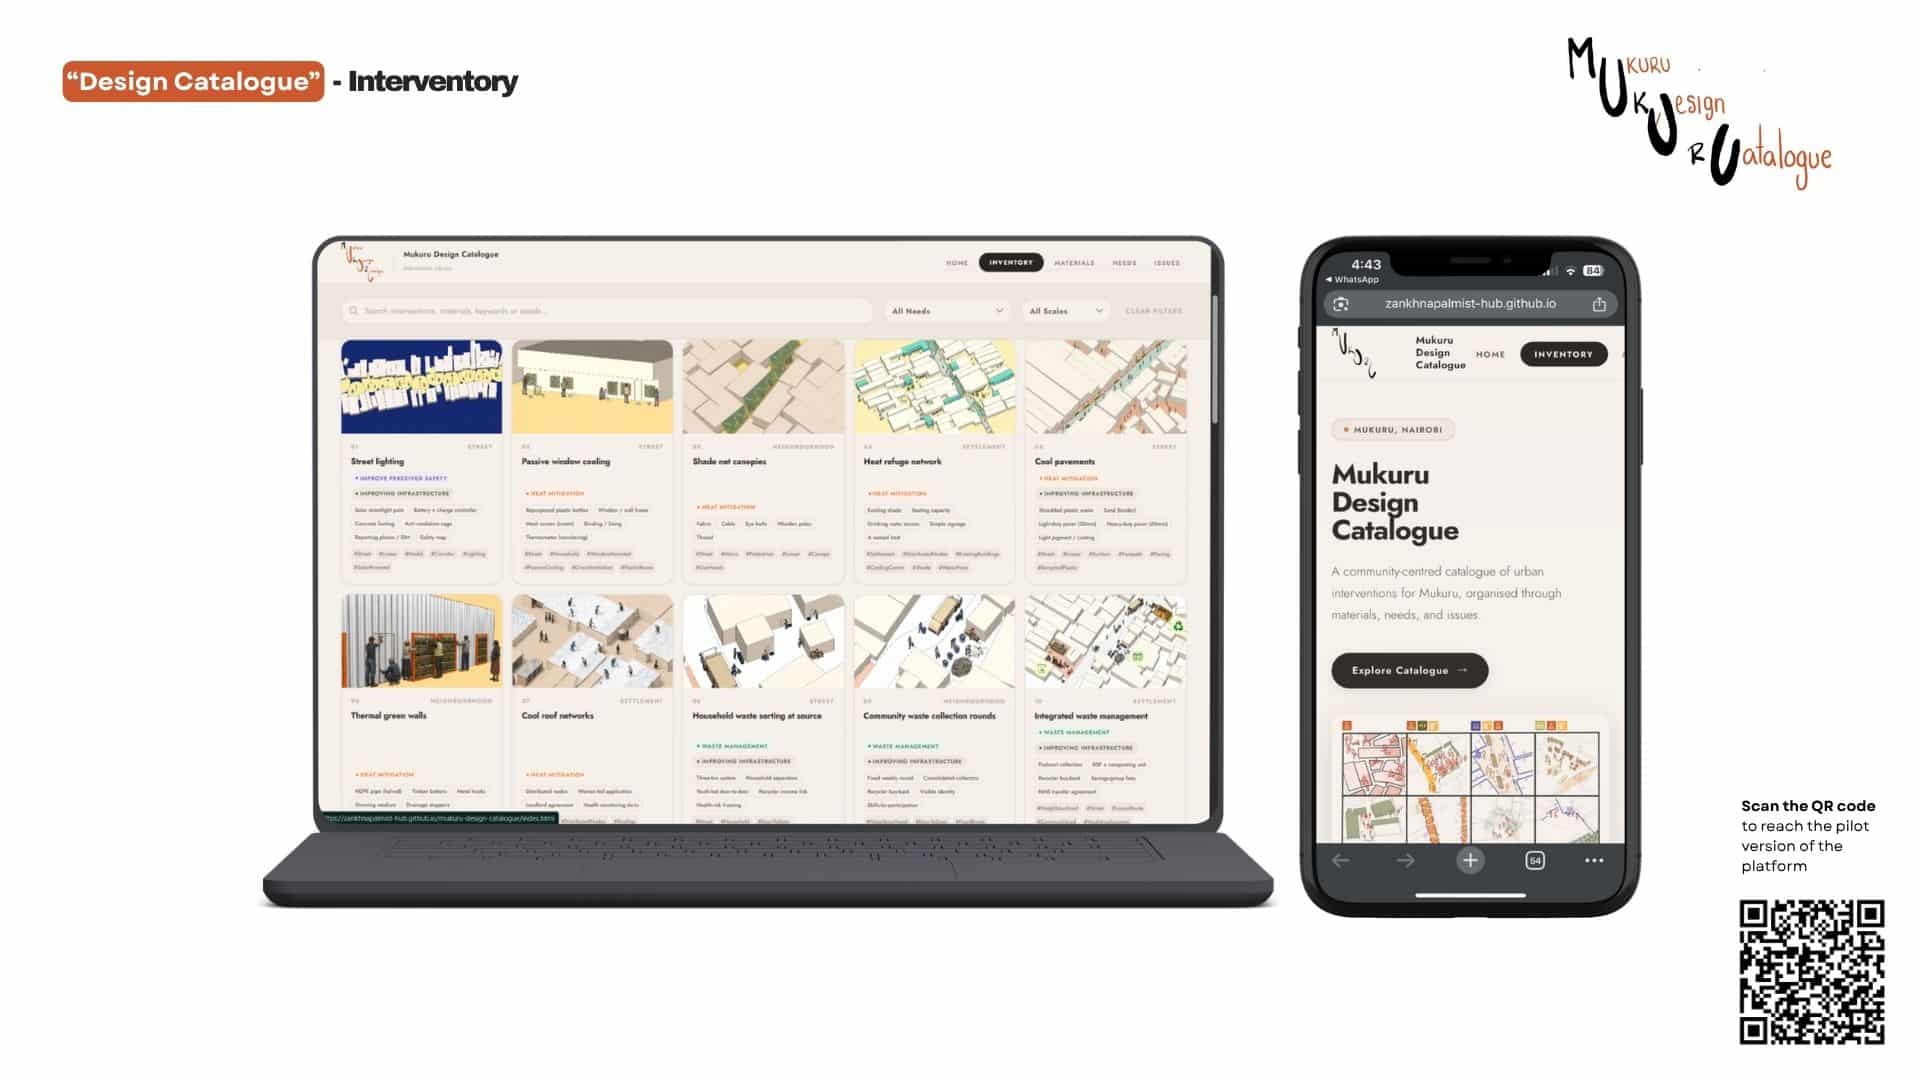
The Design Catalogue turns identified needs into buildable interventions communities can act on directly, without needing an architect in the room.
The Design Catalogue, in Detail
The catalogue is the part of this project built to outlast the studio. It’s a searchable library of 36 intervention sheets spanning safety, climate and cooling, waste and sanitation, water and sanitation, infrastructure, flood and climate resilience, mobility, ground and slope stabilisation, and schools and community space. It’s organised for three different entry points: by material a community already has on hand, by one of six identified needs, or by a specific issue described in plain language.
Every sheet follows the same structure: a description of the proposal, projected community impact, a visual grounded on an actual Mukuru site, a phased implementation timeline, a materials list with sourcing notes, the stakeholders involved, and — critically — a real-world case study precedent.
A few examples give a sense of how concrete this gets. The Street Lighting Network sheet proposes solar-powered lighting along main pedestrian corridors paired with a phone-based fault-reporting system, modelled on VPUU’s CheckIT/C3 tool used in Khayelitsha, Cape Town — with repairs routed to a community-held maintenance fund instead of a city repair queue, since maintenance failure, not installation, is what usually kills lighting programmes. The Eco-Cooler, Revised sheet reworks the well-known plastic-bottle cooling panel concept into a funnel-shaped cross-ventilation device built from plastic bottles sourced out of Mukuru’s own waste stream — a deliberate departure from the flat-panel version that has been publicly debunked, grounded instead in Cairo research on funnel-based cooling. We’ve flagged this adaptation explicitly as untested, since the supporting evidence covers the clay version of the funnel design, not yet the plastic one — in keeping with this project’s core principle: every intervention in the catalogue is either backed by a validated precedent, or honestly labelled as an unverified adaptation. Nothing gets quietly presented as proven when it isn’t. And the Waste-for-Income sheet draws on Lilongwe, Malawi’s Waste for Wealth programme, pairing municipal waste collection with NGO-supported microenterprise.
The catalogue is live and publicly accessible, and continues to grow.
Imagining It Built
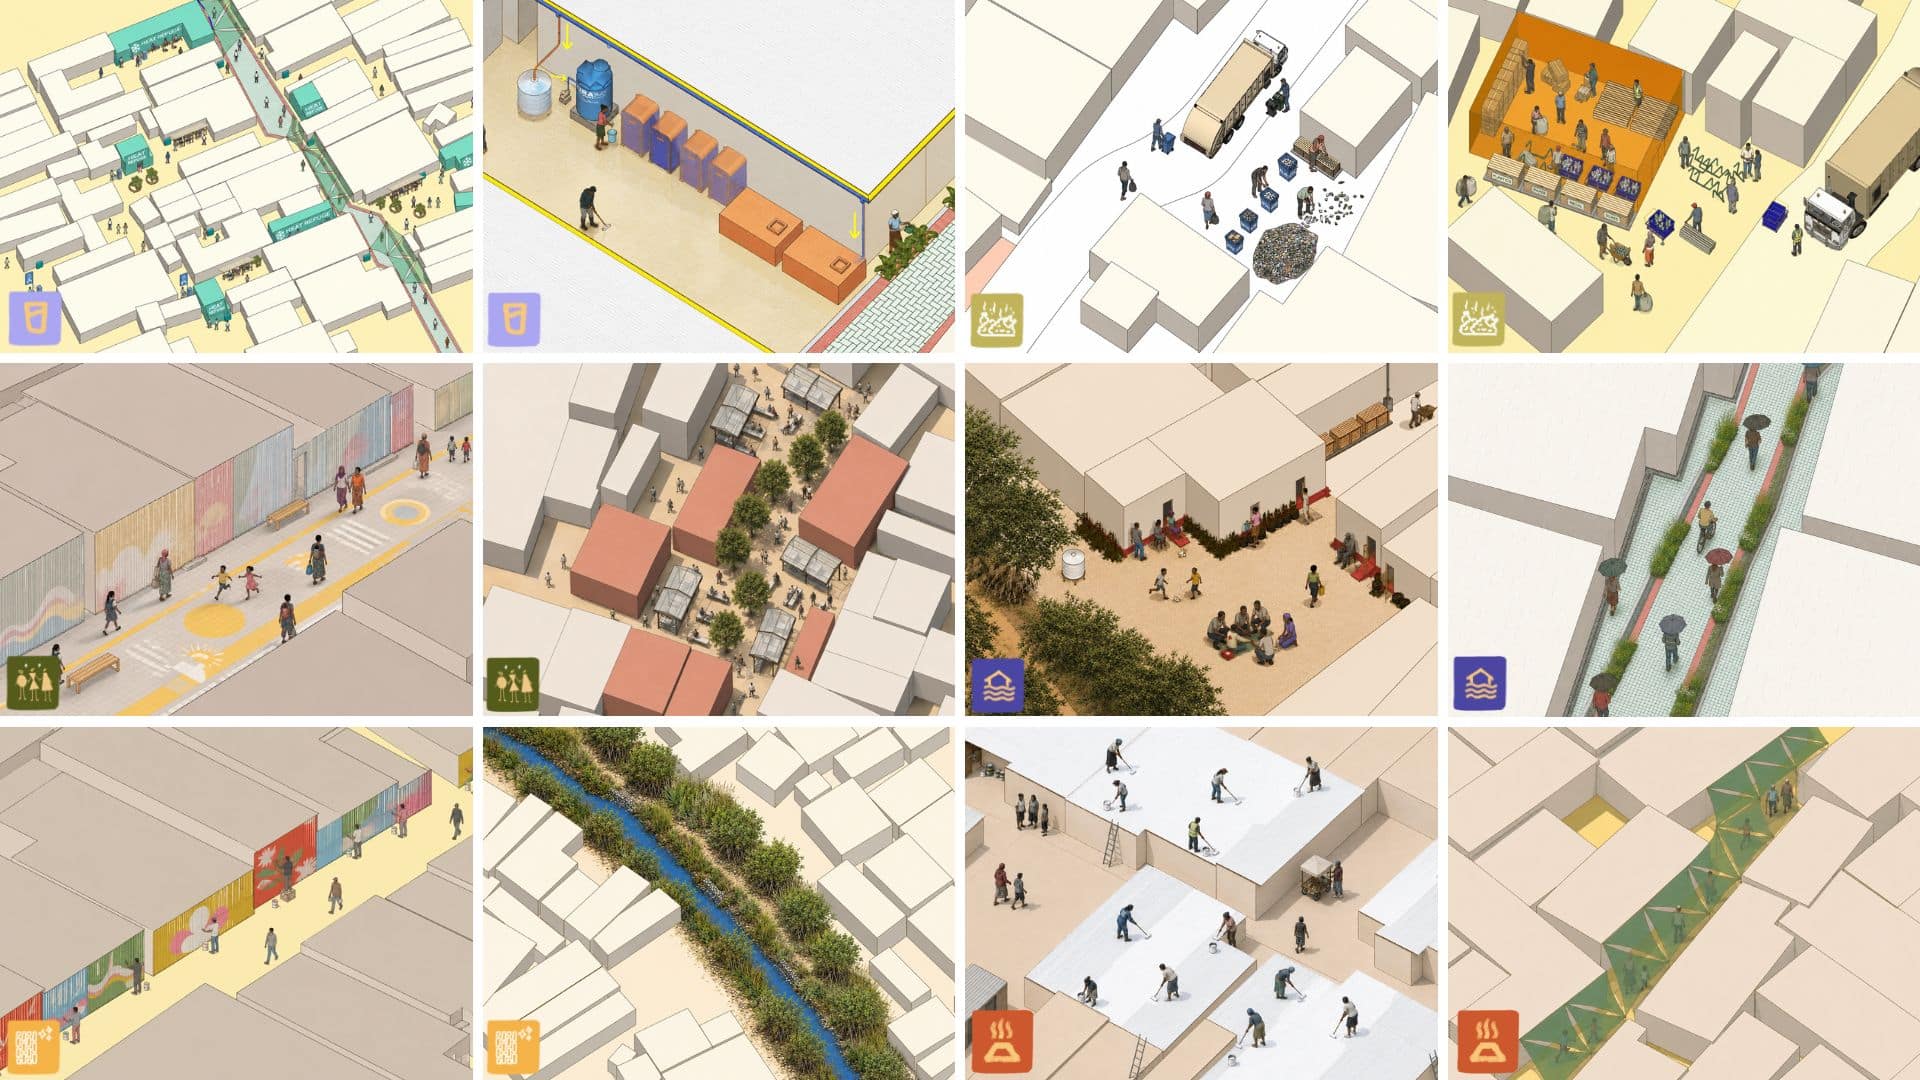
To test what this could actually look like on the ground, we developed a series of before-and-after visualisations across the settlement — one focused on safety and walkability (streetlights, tactical street paint, art on mabati walls, drainage bioswales), one on heat mitigation through low-cost, locally-sourced materials (recycled-plastic eco-coolers, cool pavements, thermal green walls), one on activating market spaces with better sightlines and street amenities, and one showing the full waste system working at settlement scale — collection, segregation, and treatment, all running through community participation rather than around it.
What Comes Next
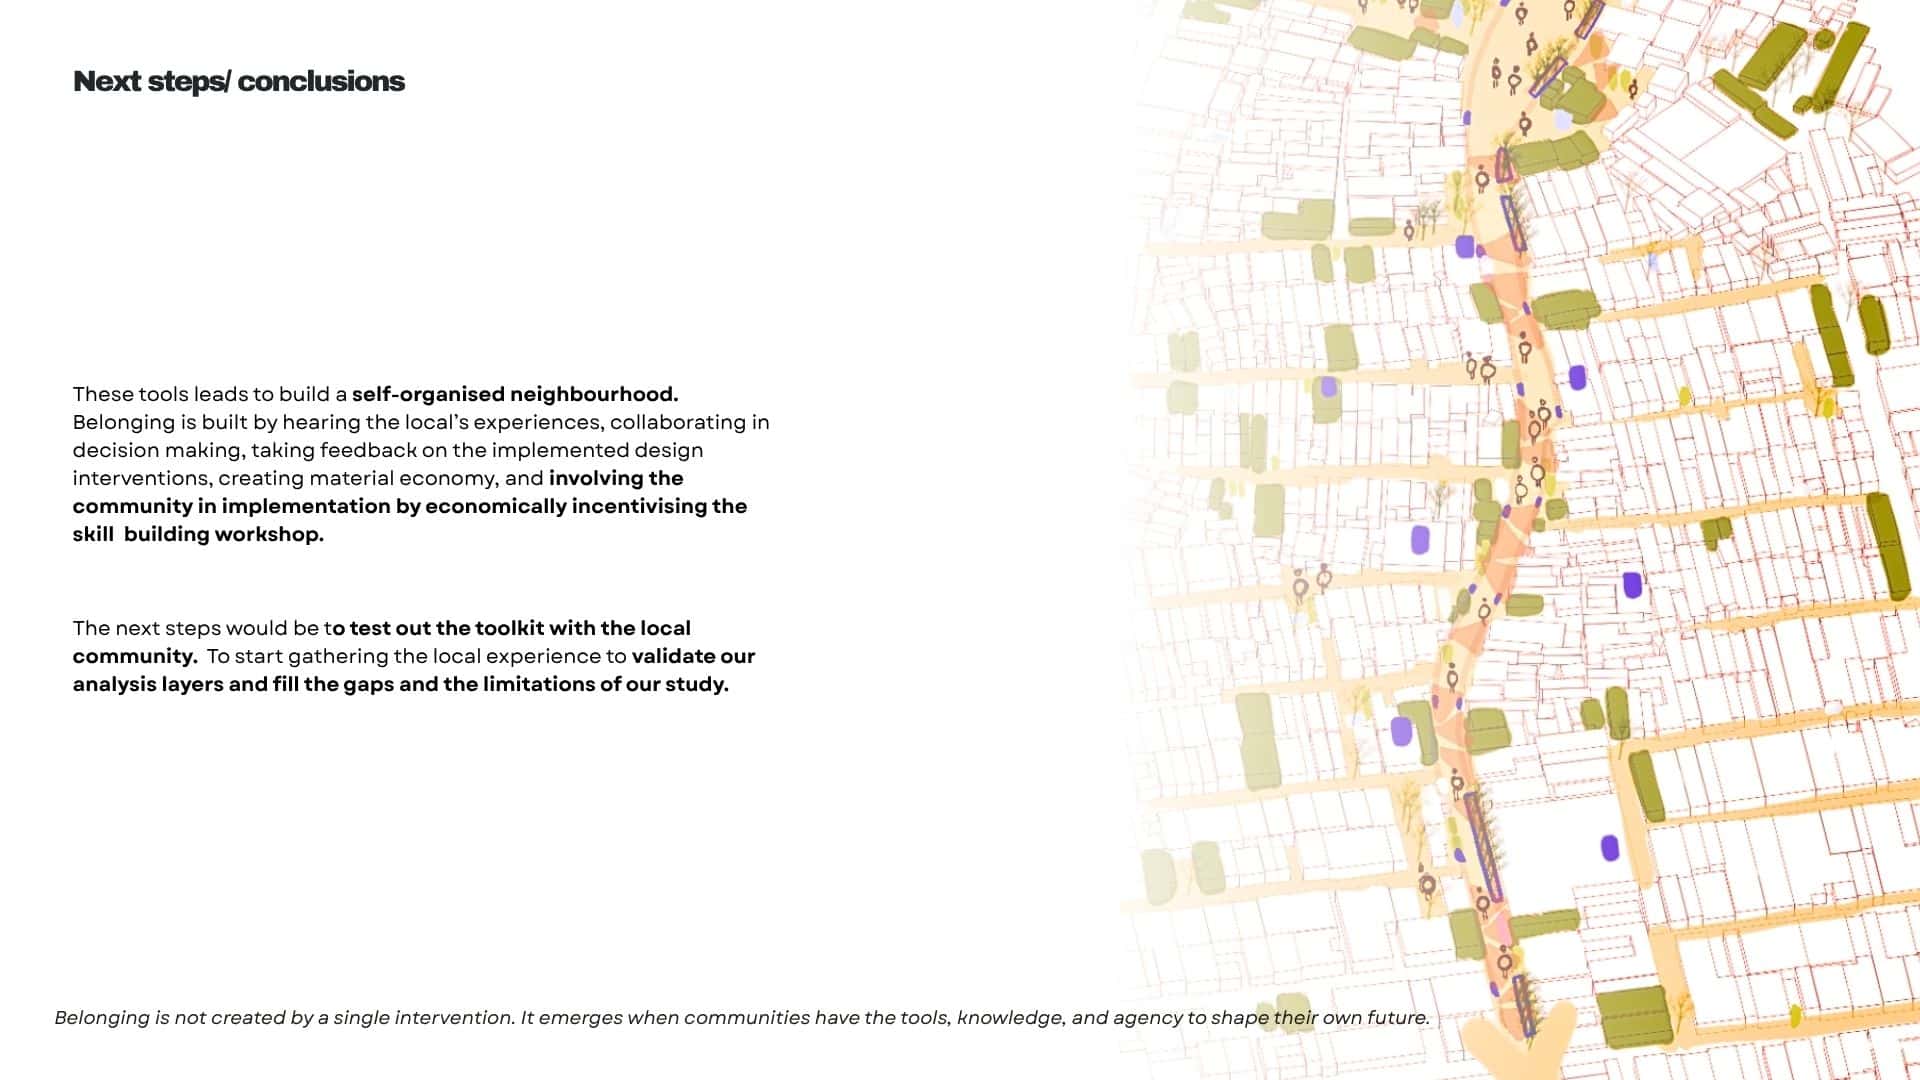
The next step is to test and refine both tools — My Jumuiya and Mukuru Together — directly with the community and local organisations: gathering lived experience to validate our analysis layers, and honestly addressing the gaps and limitations of our study as we go.
Physical outputs
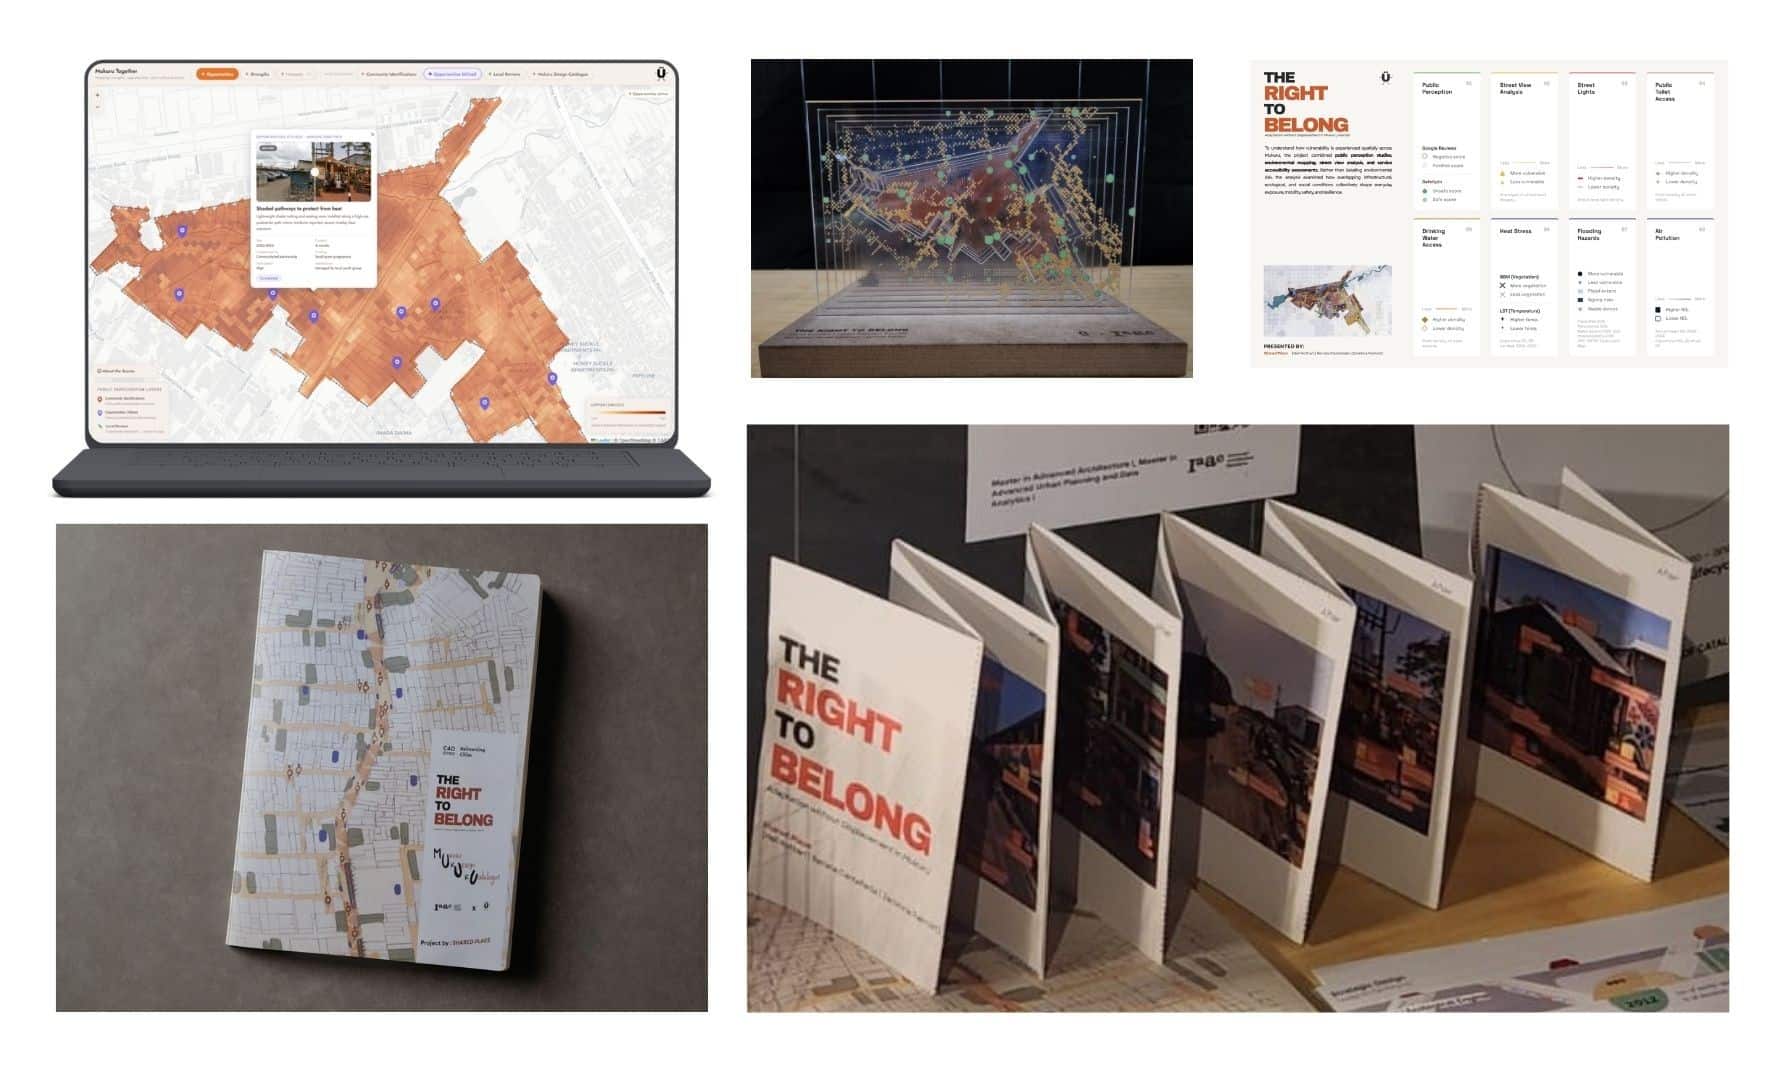
By Shared Place — Heli Kothari, Zankhna Palmist, Renata Castañeda | IAAC Data Driven Urban Design Studio
