Site Context
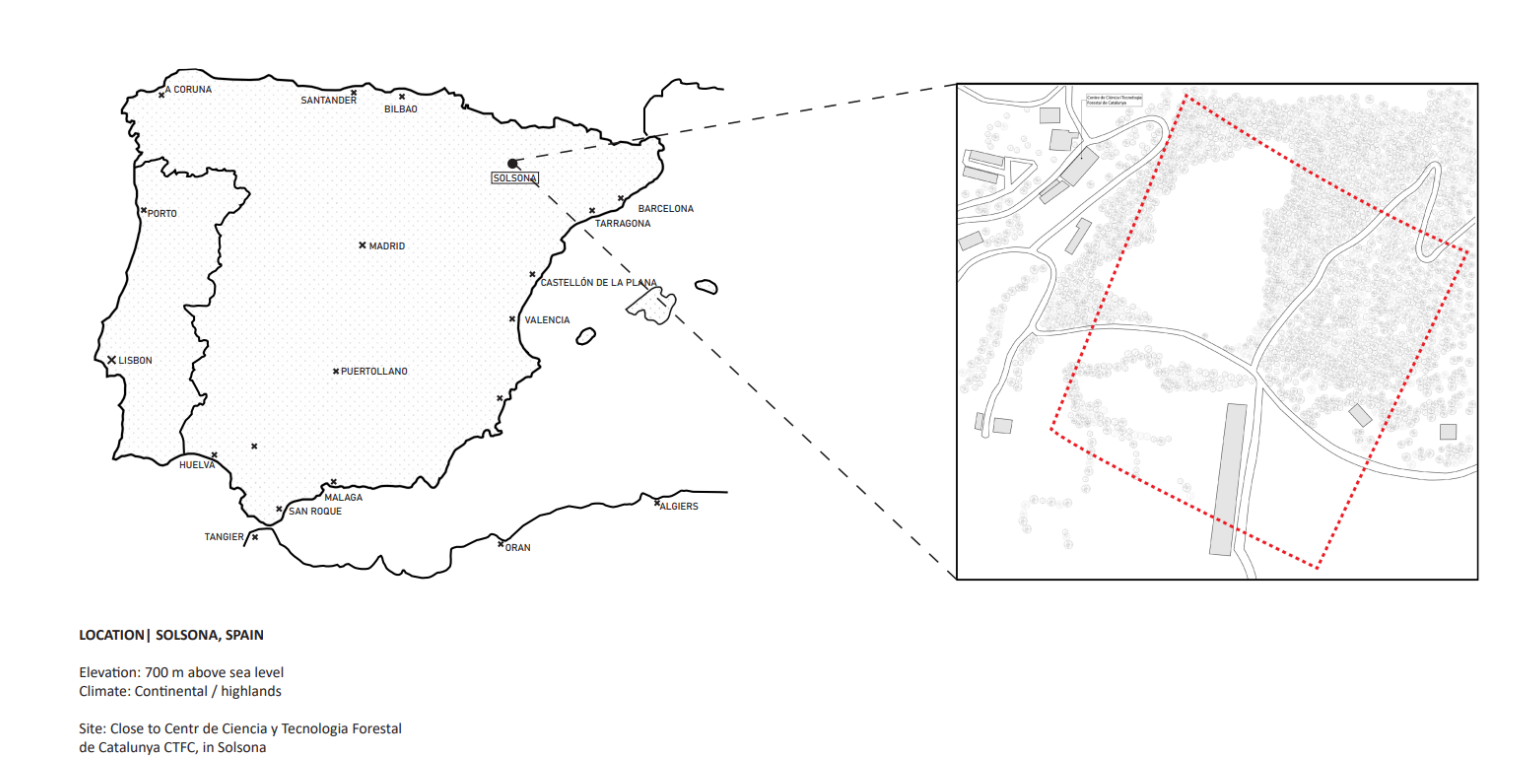
This project, titled Tree Line, is a factory located in Solsona, Spain that produces 20,000 m3 of lumber each year. Halfway between the Pyrenees and Barcelona, it’s one of the middle steps in the process of obtaining wood in Barcelona, the next step being giving planks to the next door CLT production factory.
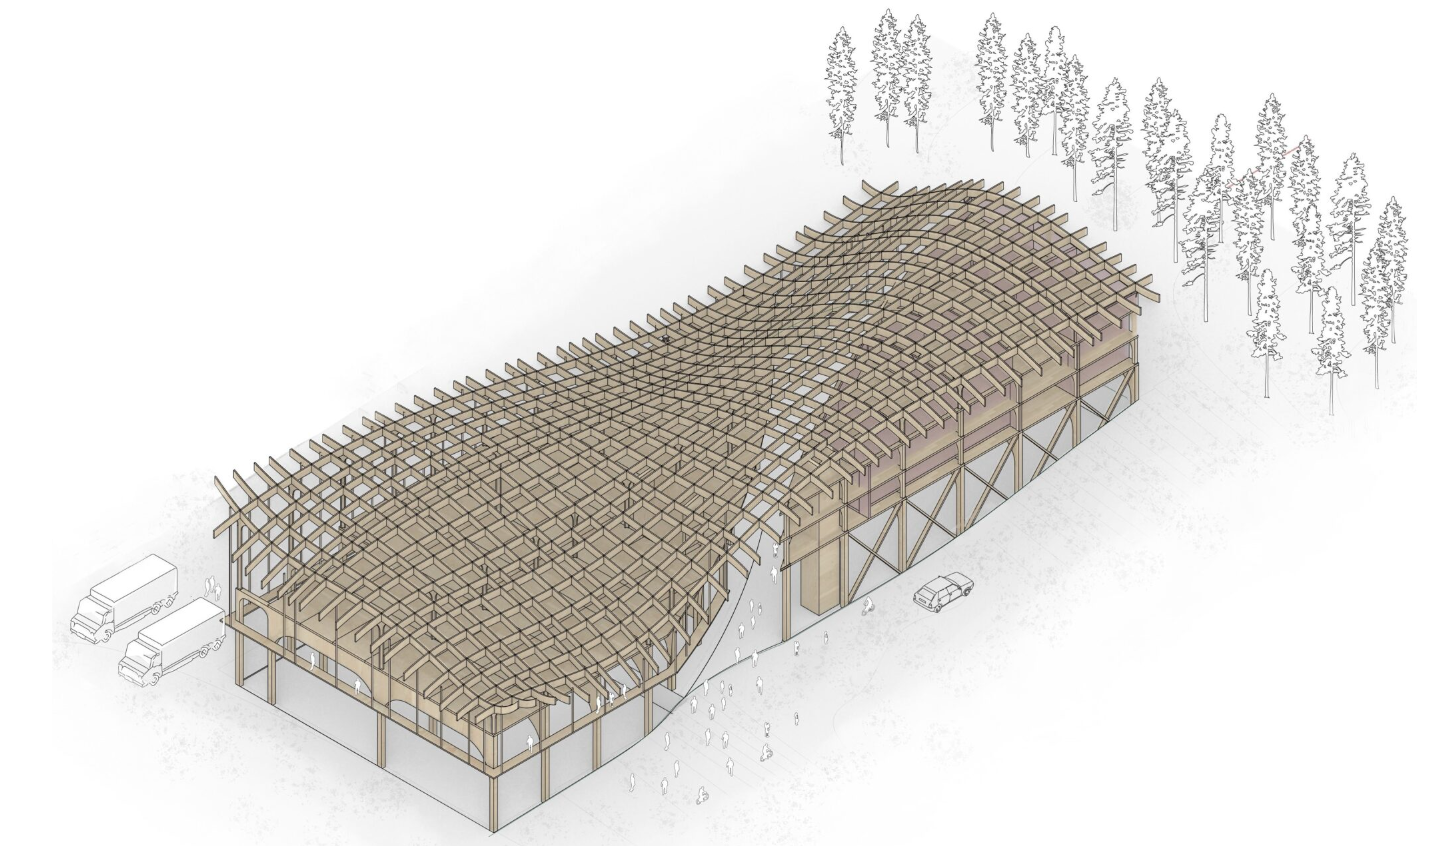
The climate in this region is Continental, and quite mild throughout the year with dryer summers and more humid winters. Our building sits at the edge of the forest, bringing nature up close and into the building hopefully giving visitors more of an understanding of where this wood comes from. The center of the building has a large channel providing ventilation throughout the year and cooling down the heavy machinery comprising the first floor of the building.
Building Program
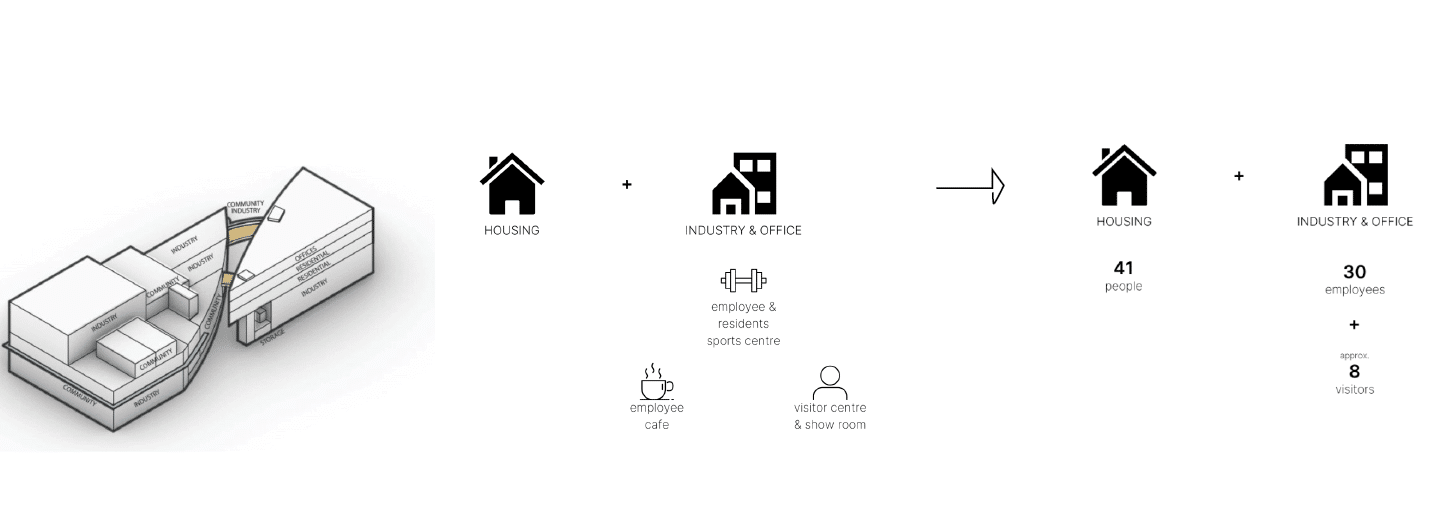
Our building is devised of three main programmatic areas. The housing for those working in our factory, the offices, for the business side behind the industry, and the industrial area which contains all of the mechanical and physical processes of milling the wood.
Within the housing, we calculated 41 people staying there at any given time throughout the year, which was based off the amount of units within our building. These units are comprised of studios for just one employee and family apartments for those that may have families living with them. Within the industry and offices we calculated only 30 people, due to the equipment doing many of the processes and only about 8 visitors each day of the year, knowing though that this will fluctuate based off of community events, etc.
Strategies
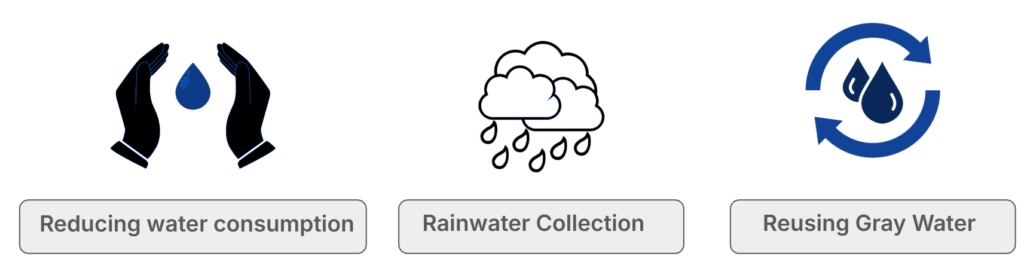
Reducing Water Consumption
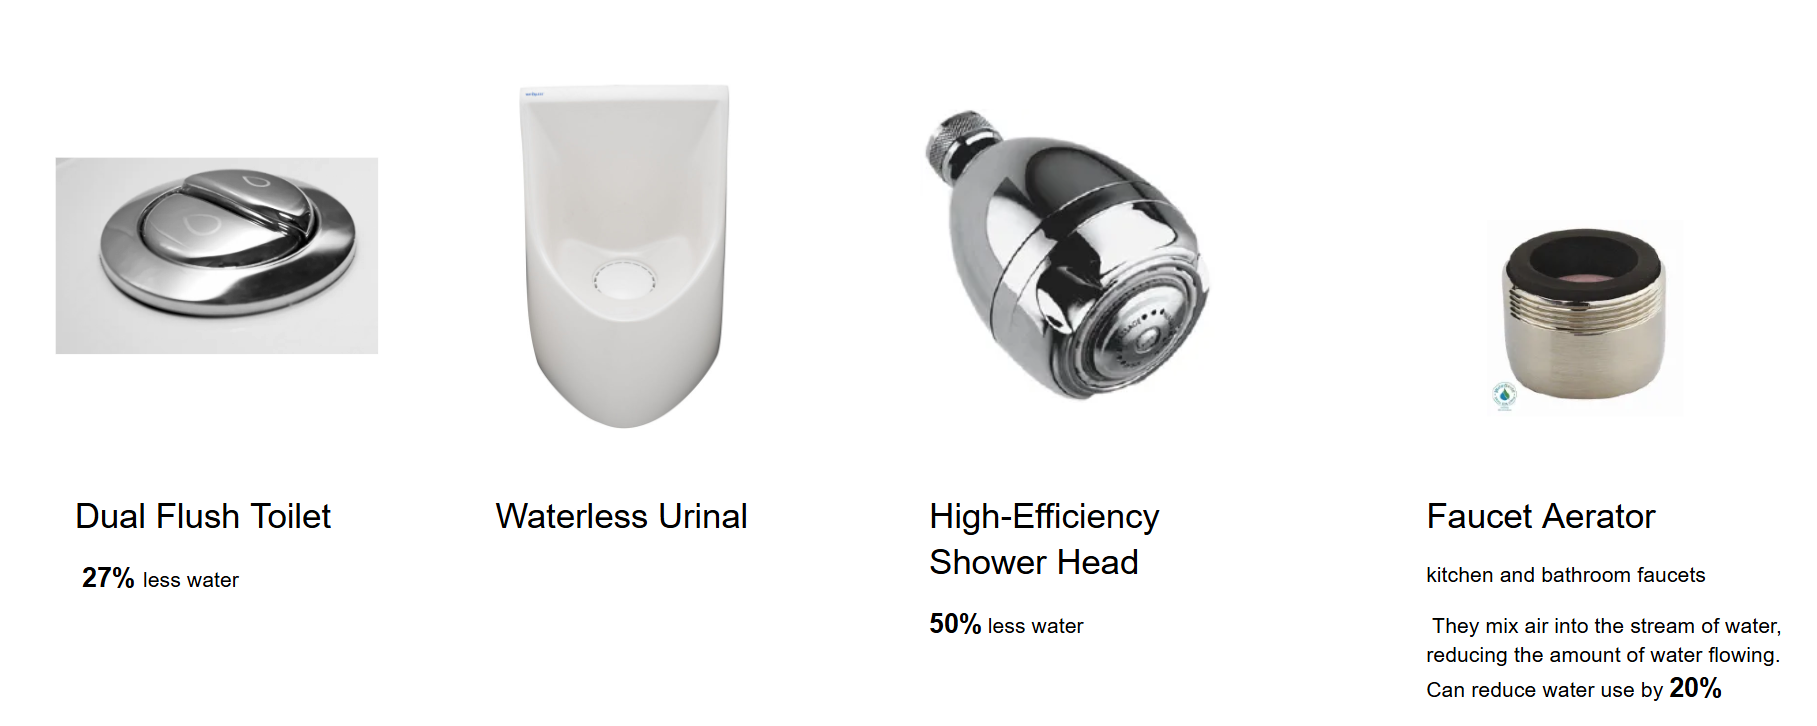
In order to reduce water usage with the types of appliances we have in our building, we focused on fixtures within the sinks and restrooms of our building to make an impact. A portion of water consumption comes from the residential units that are occupied year round at a steady rate, so water will always be being consumed in these spaces 365 days of the year.
Total Water Usage: Business as Usual and Reduced Use Appliances
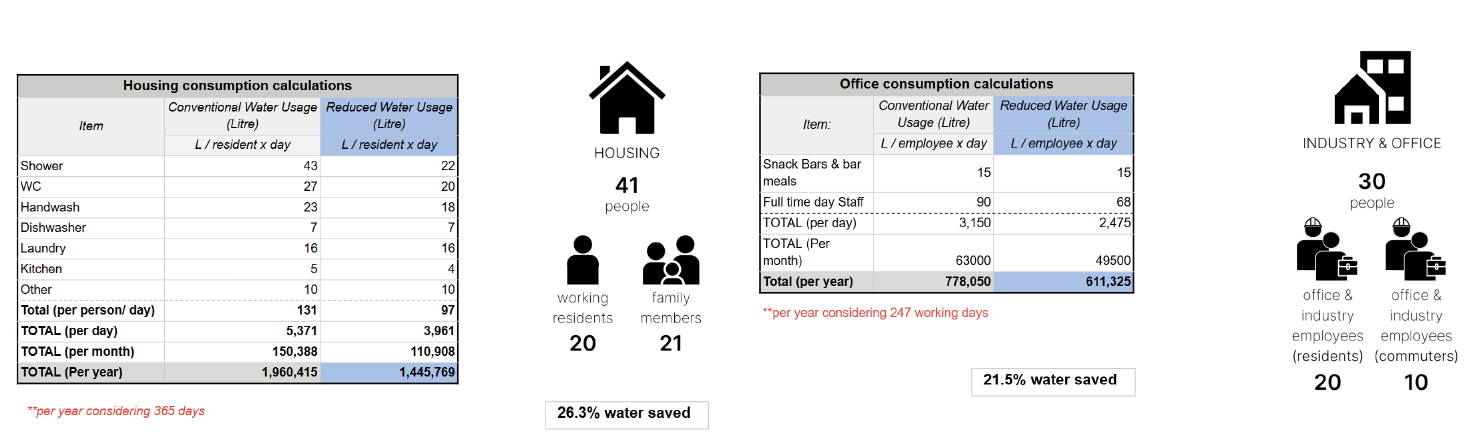
These charts display the water usage in a business as usual setting and with the new water saving appliances installed. The numbers are based on the previous amount of people we calculated in each space and where we estimate they would be in the building.
Within housing, the water usage in L was calculated 365 days out of the year, with the graph showing about 500,000 L of water saved each year. In the offices, we calculated only 247 working days in a year, and with water saving appliances, about 166,000 L of water are saved each year.
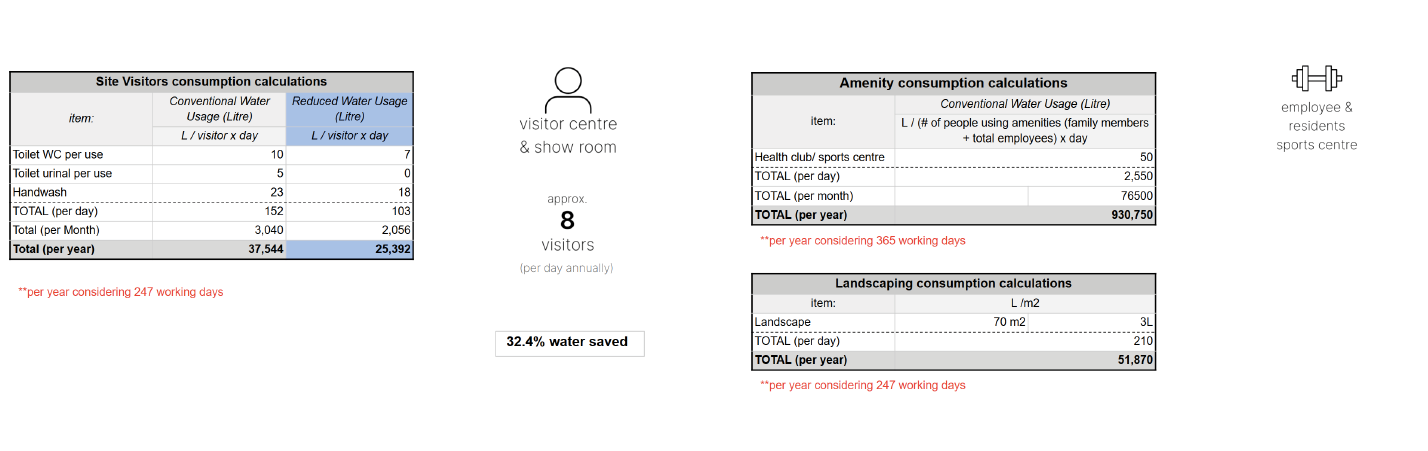
These chart highlight the same data calculations but for site visitors and the amenity spaces as well as the landscaping. For the 247 working days, about 12,000 L of water can be saved from those visiting the building, which is based on 8 people coming a day. Within the amenity and landscaping spaces we calculated that about 930,000 L would be used and 51,000 L on landscaping.
Overall, we concluded that aside from the industry and fire prevention we were able to save 20% of our water usage just through the appliances that we chose.
Sawmill and Fire Prevention Water Usage
When calculating the water usages in the other program areas, we quickly realized that the industry itself and the fire prevention system was use a drastically larger amount of water then anywhere else.
The only way we can apply water saving strategies within these areas is within the kiln of the sawmill, where we decided to go for a dehumidification kiln rather than a steam heated kiln, which uses far less water at only 864 L. With these changes, we’re able to save 16% of water usage in the industry per year.
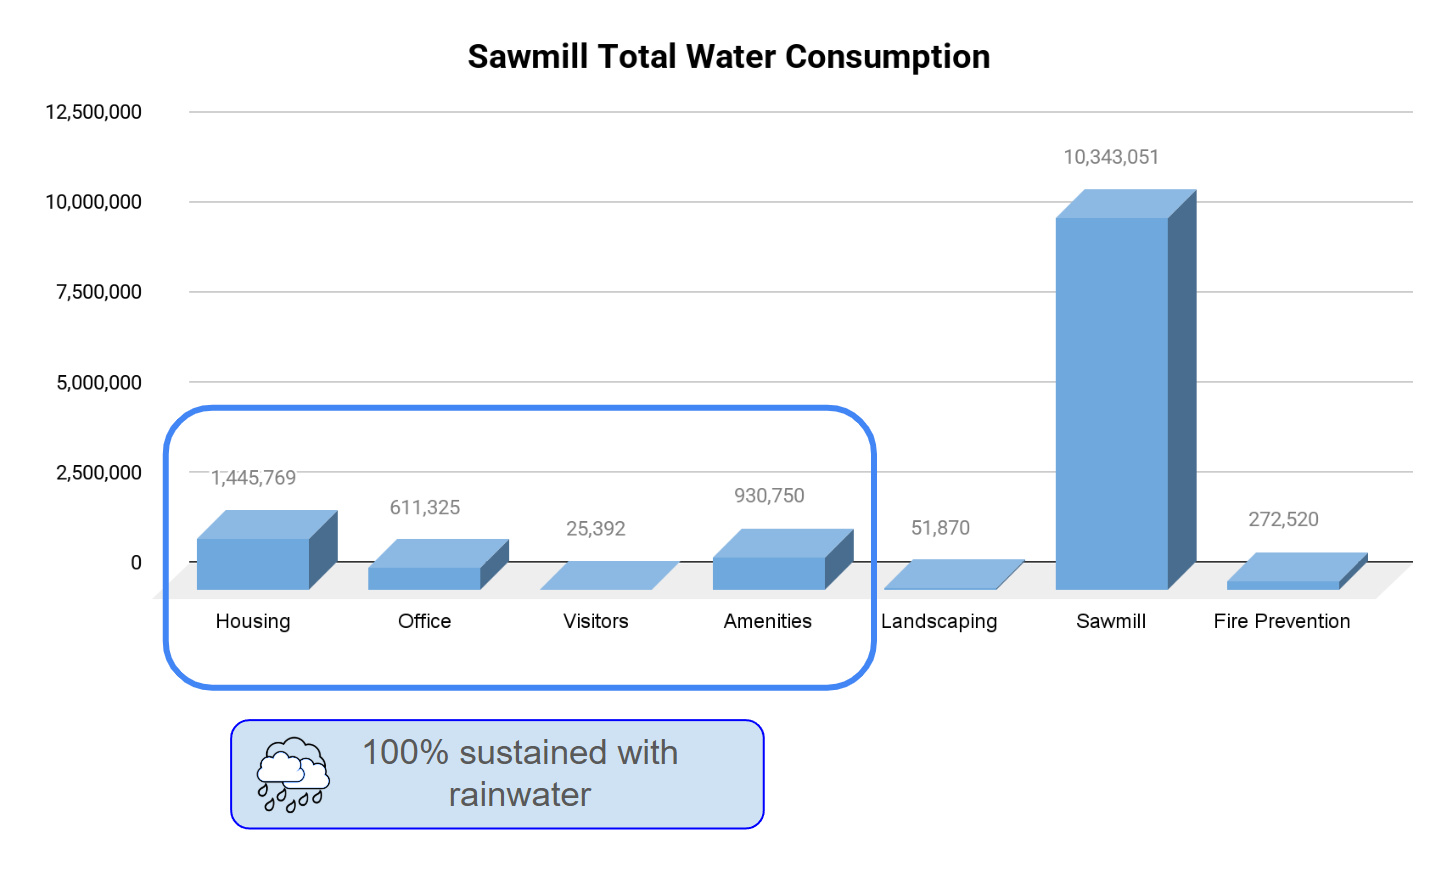
This diagram highlights the amount of water used in the sawmill compared to every other space within the building, which is drastically larger annually. This discovery informed which spaces we realized could utilize rainwater over others.
Rainwater Collection
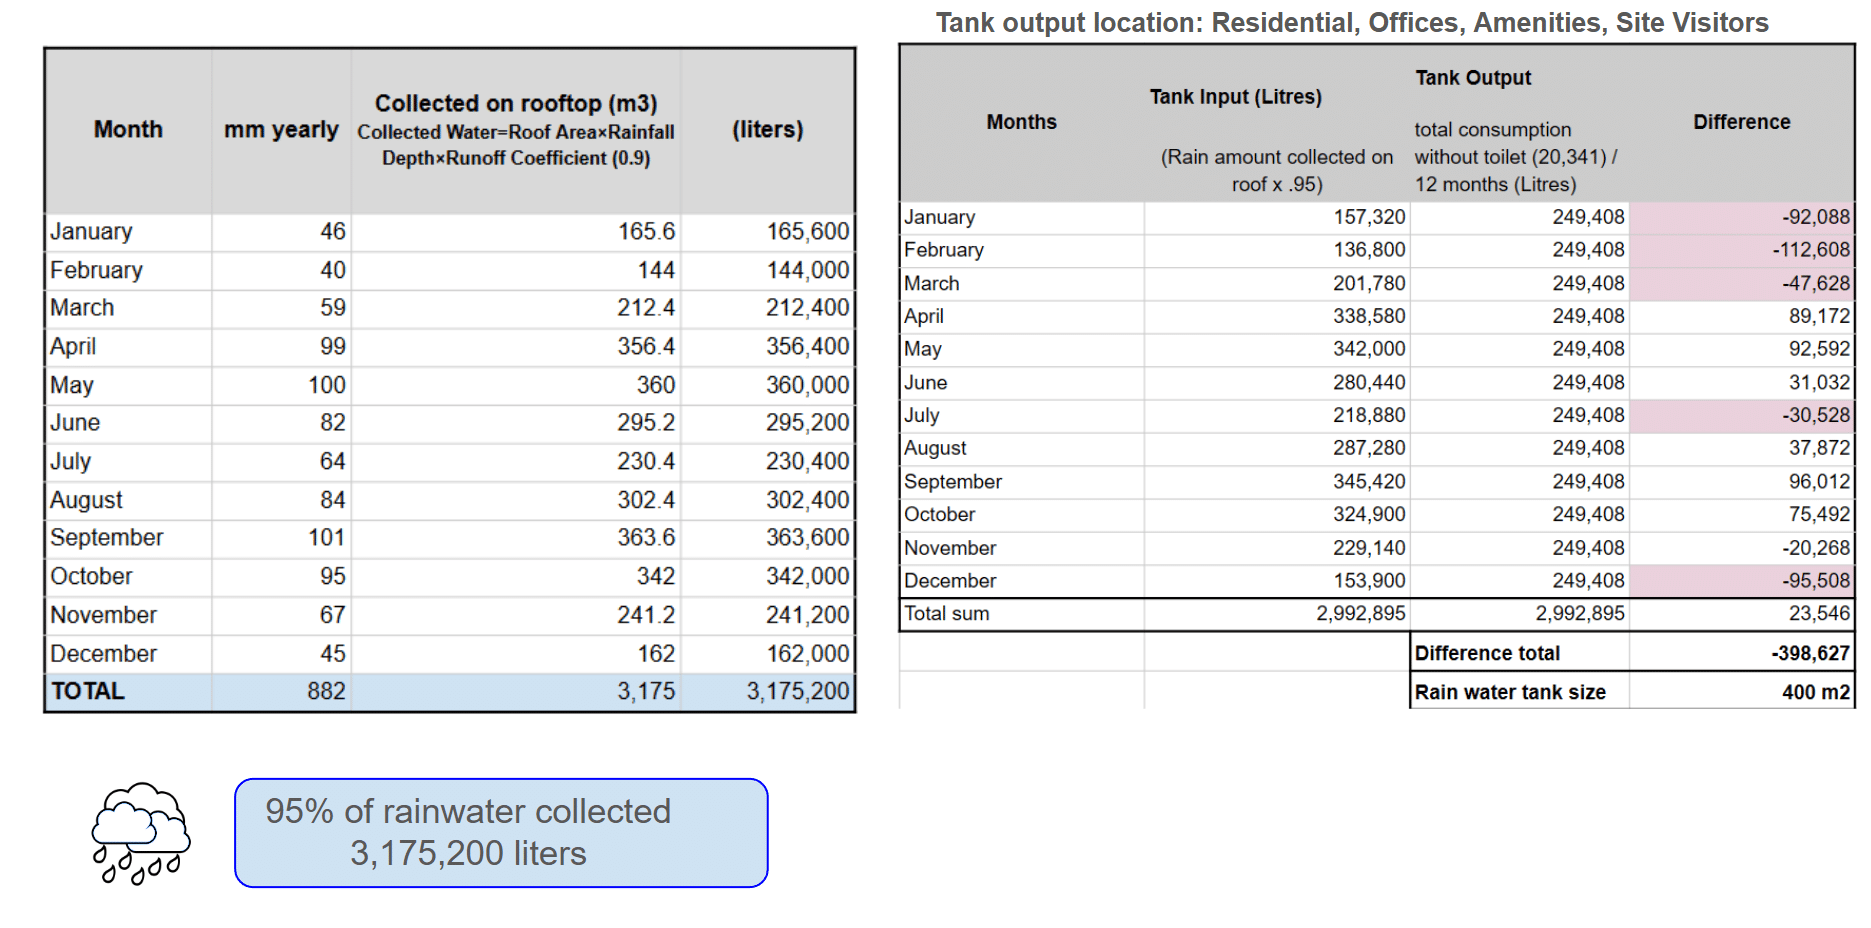
One of the strategies used to save water was rainwater harvesting due to our sloping roofs. Looking at the area of Solsona, and calculating for a loss of 5% water capturing on our roof we calculated the liters captured on our roof each month, which became the input of our rainwater capture over each year.
A perfect balanced output became the water usage per year within the residential, offices, amenities, and site visits. The tank size needed each year we found based on the total deficit over the course of the dry months where we would need to store more water from previous months to get the water supply through the dryer season. The total deficit of rainwater output compared to the input was around 400,000 L, which equates to 400m3 as the tank size.
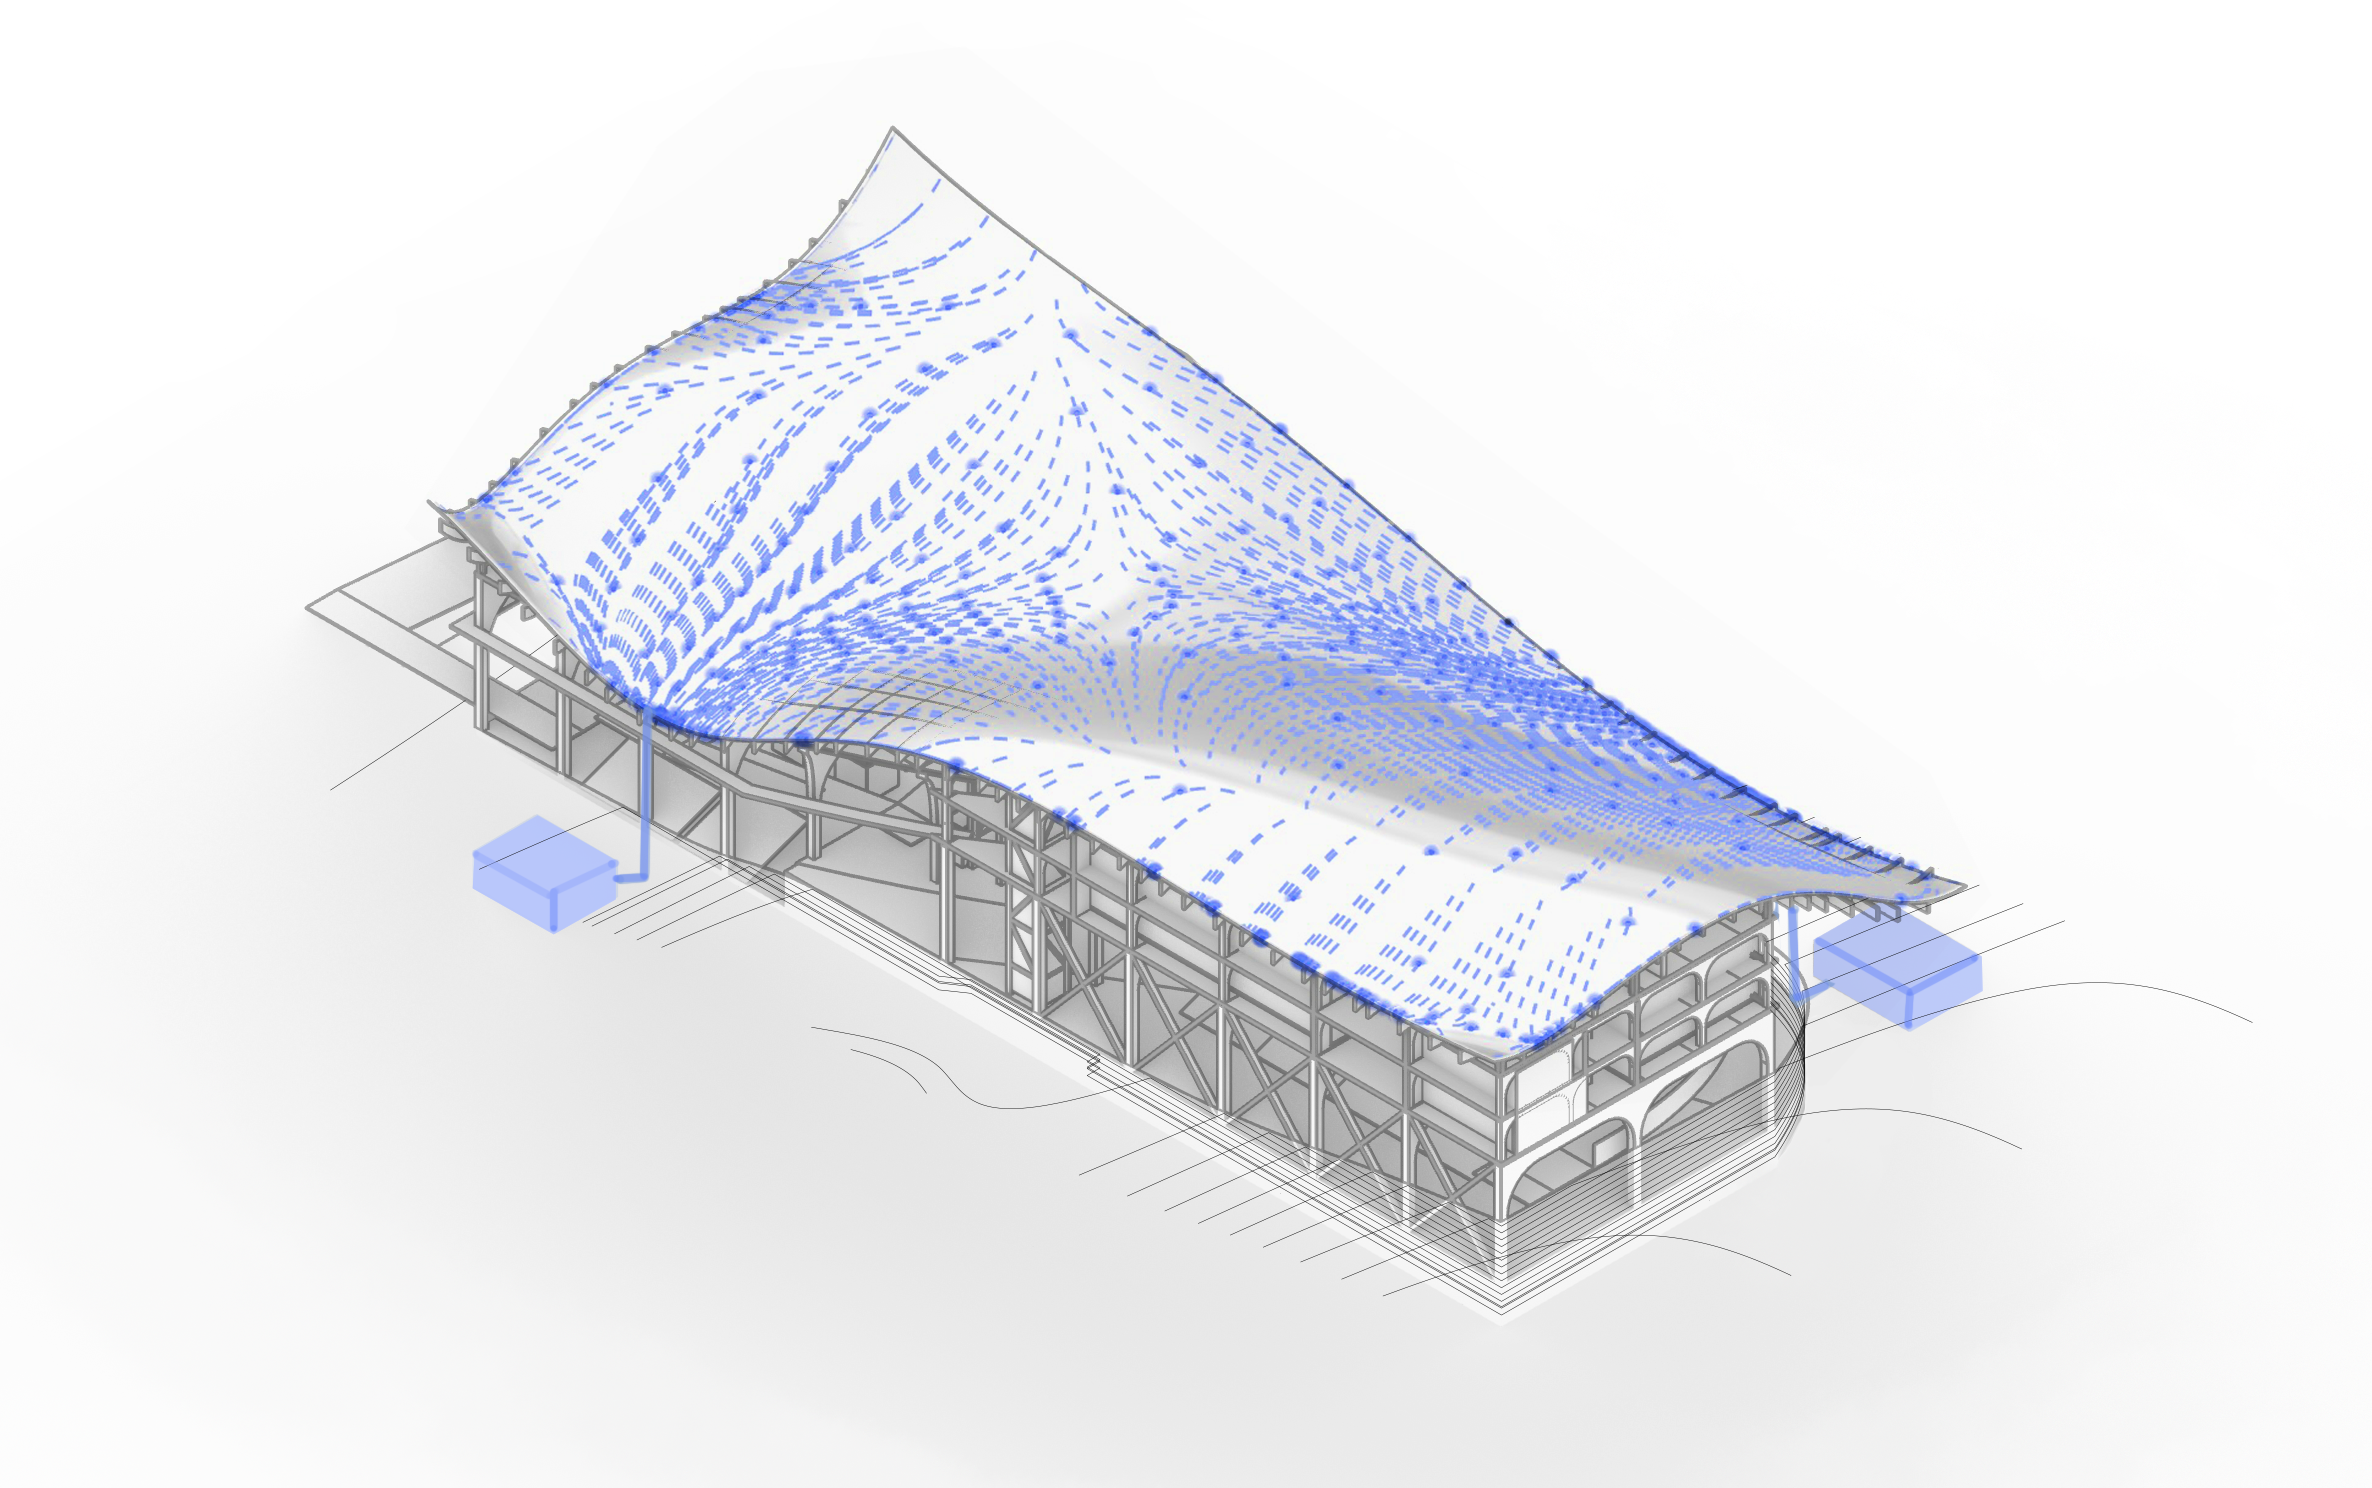
Based on where we saw the water flowing, that was how we decided to place our tanks. Due to our roof slope water predominantly pooled in two areas, giving us the conclusion of needing two tanks of 200m3 each for their size.
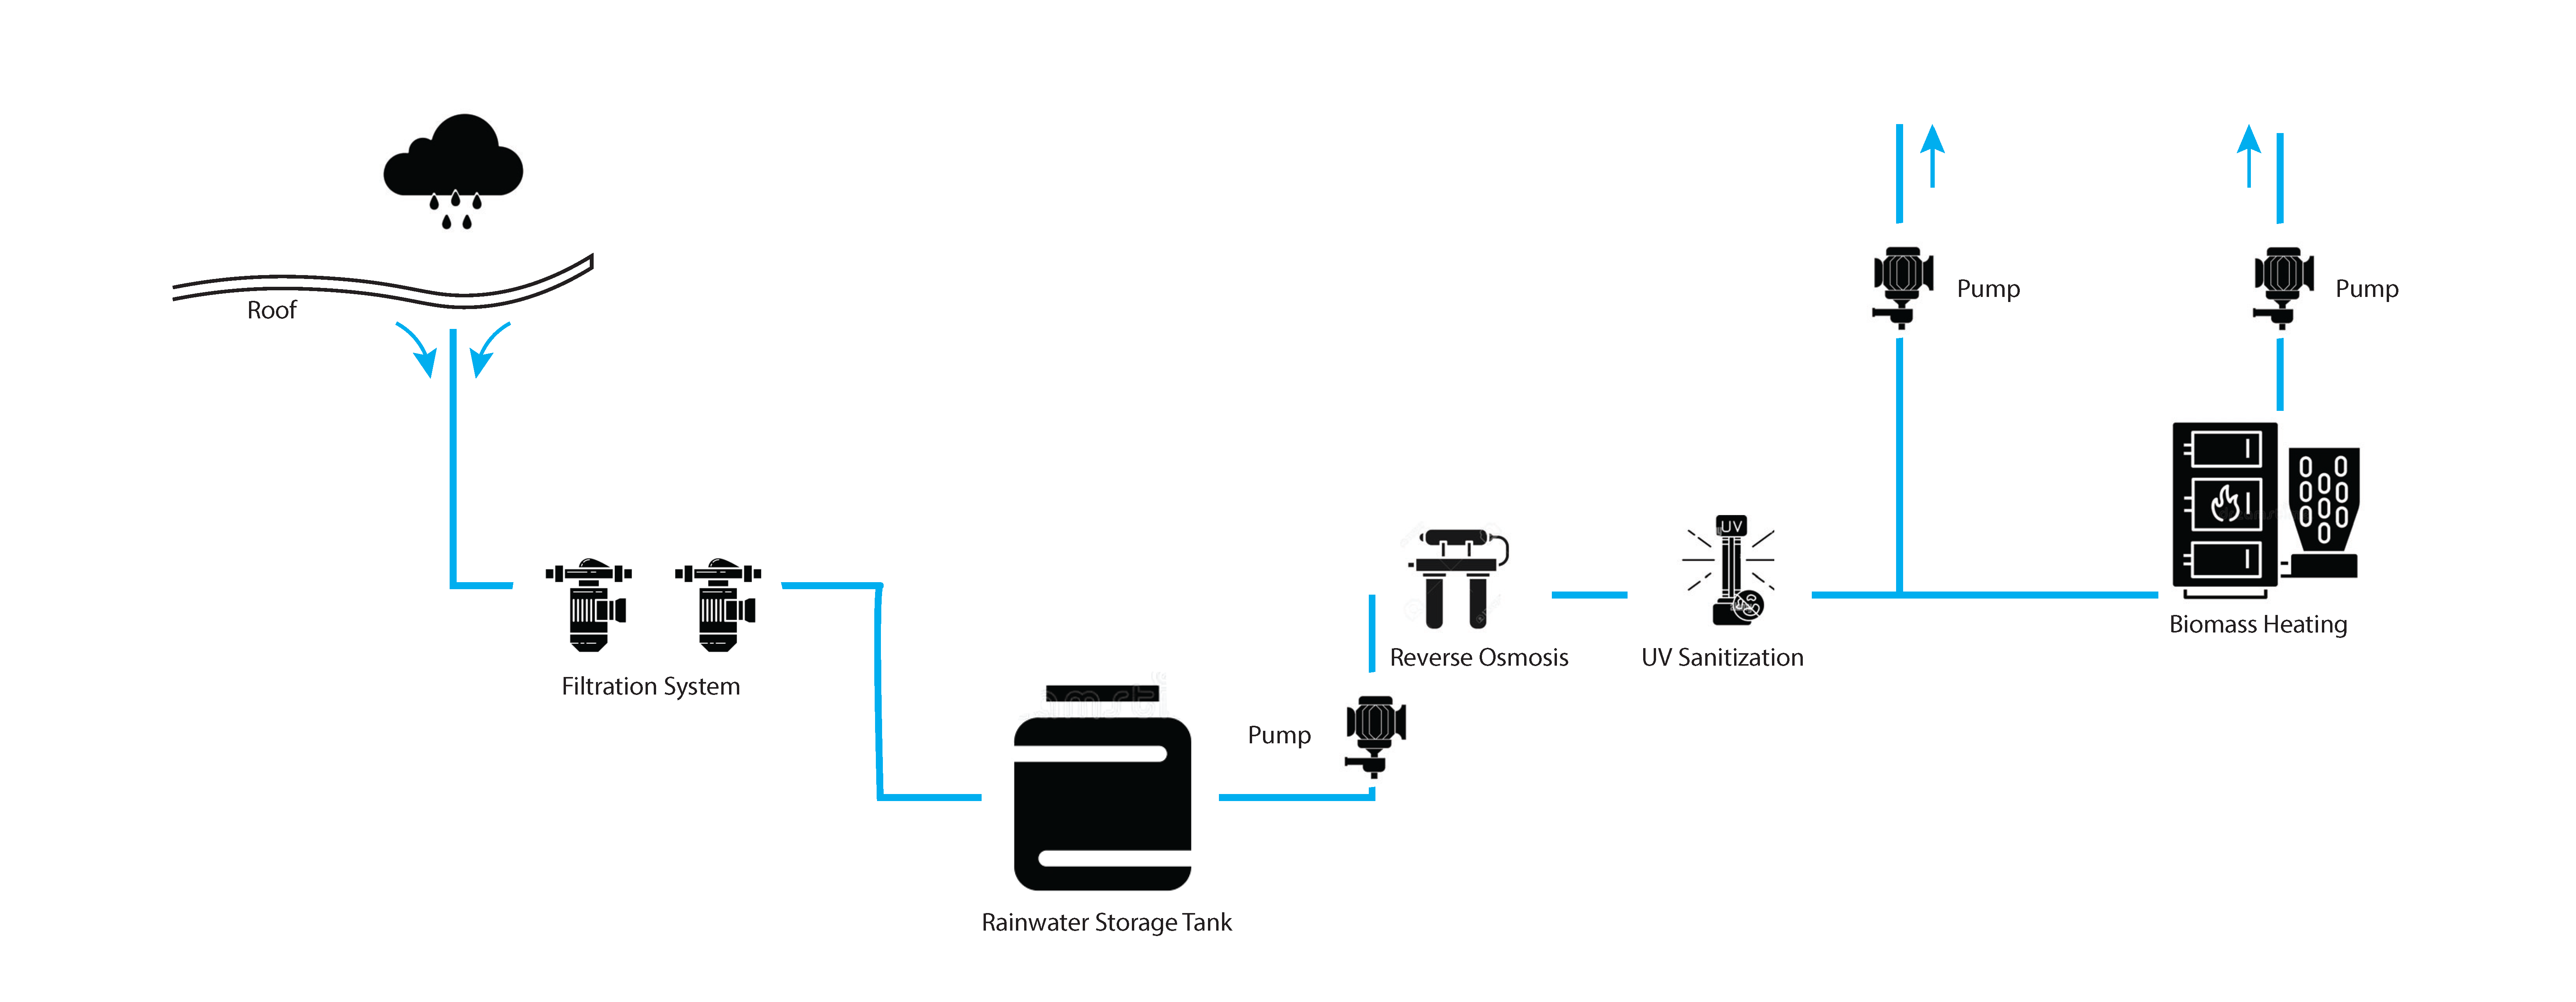
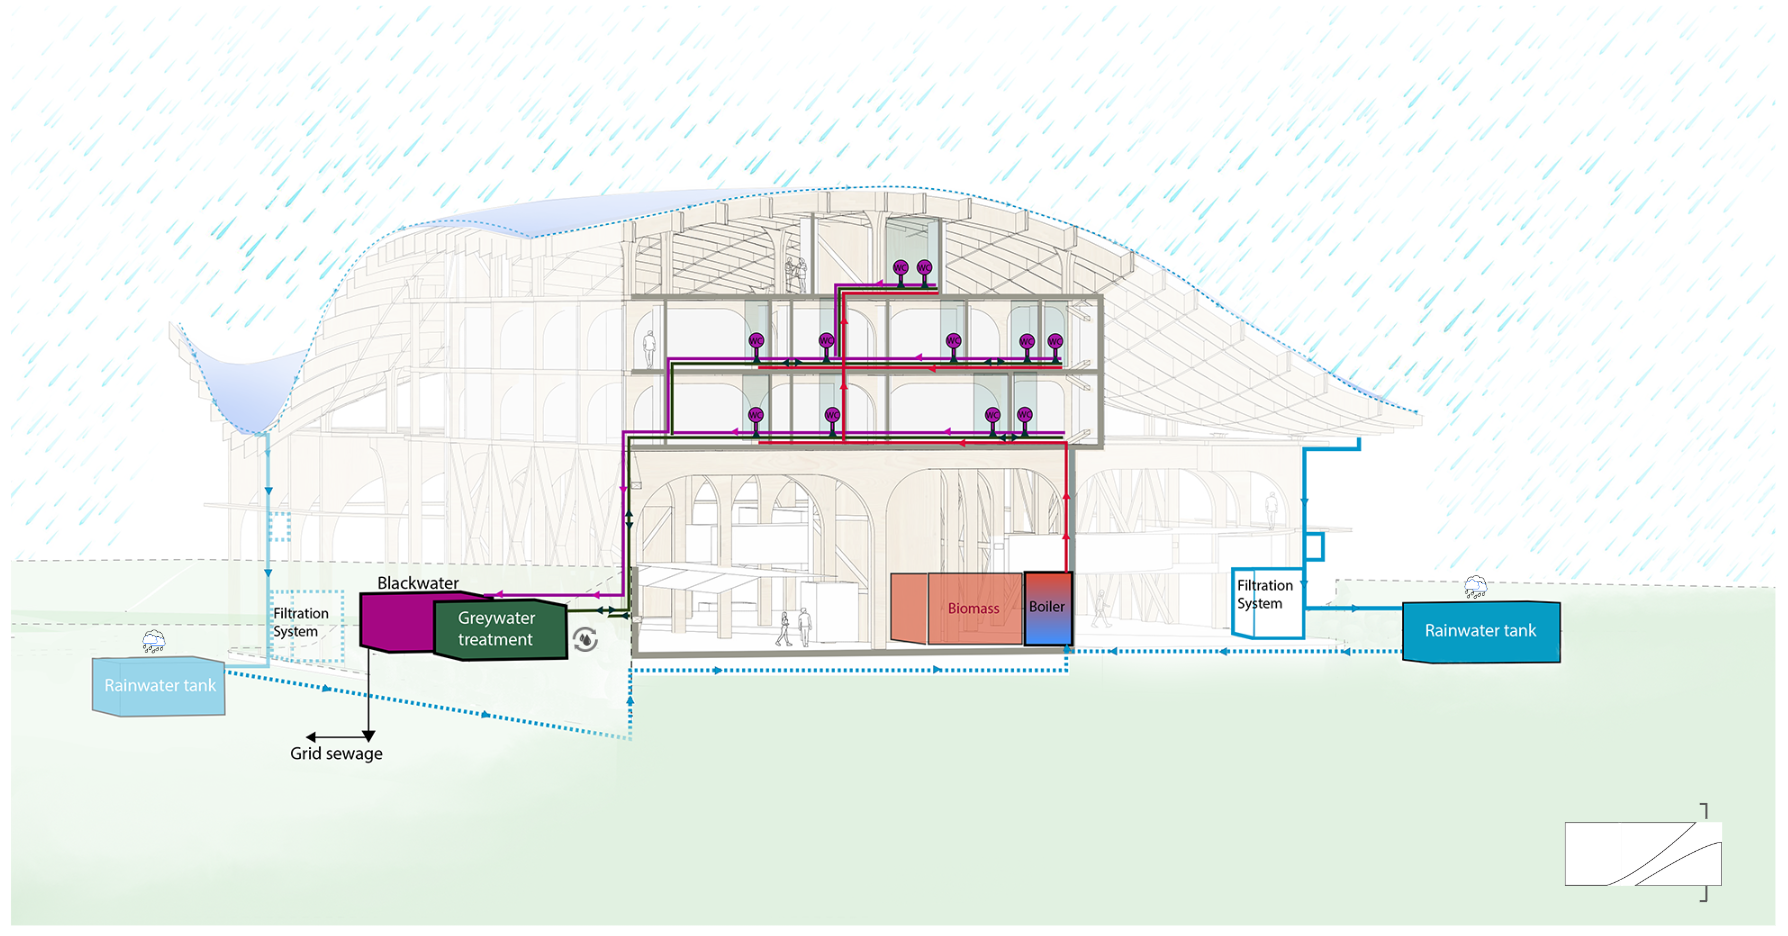
The filtration process for rainwater starts at the capture, and goes through a filtration process before being stored in the rainwater tank. When leaving the tank, the water goes through it’s final stages of purification, being reverse osmosis and UV sanitization. After that the water is pumped up to its needed location, and if water is needing to be heated it is done so with our biomass supply on the first floor.
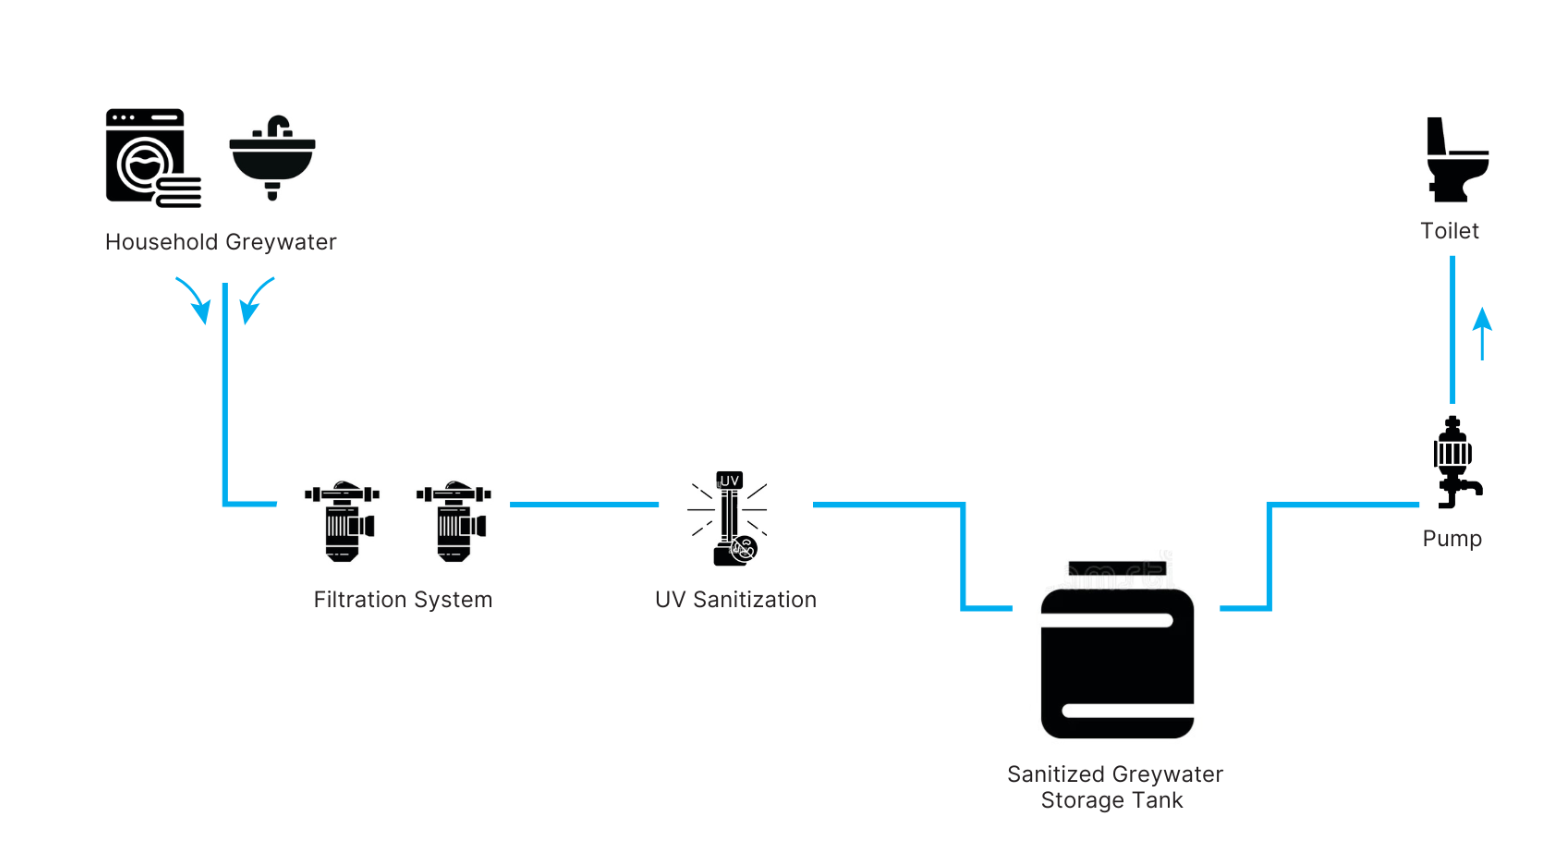
Greywater System
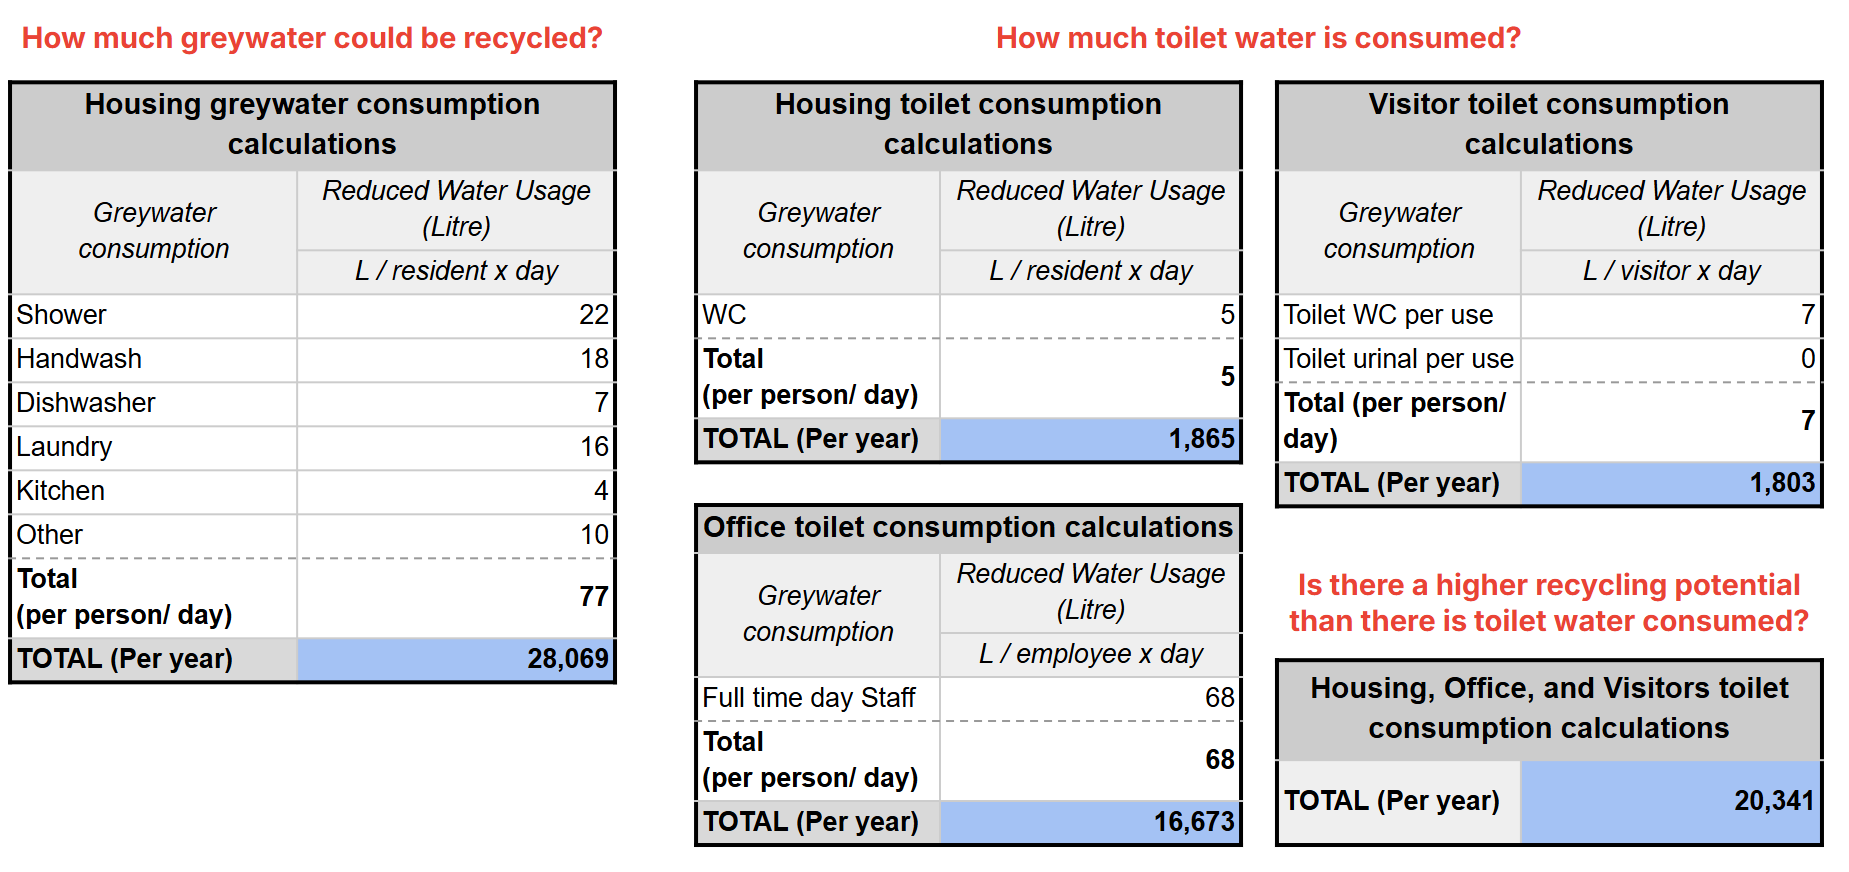
Within our greywater system, we discovered that the amount of water used in the housing program of all of the facilities is greater than the water need in the the toilets of the housing, offices, and visitor usages. This means that we can reuse that water once more in the toilets of all of these spaces.
Systems in Place
text text text
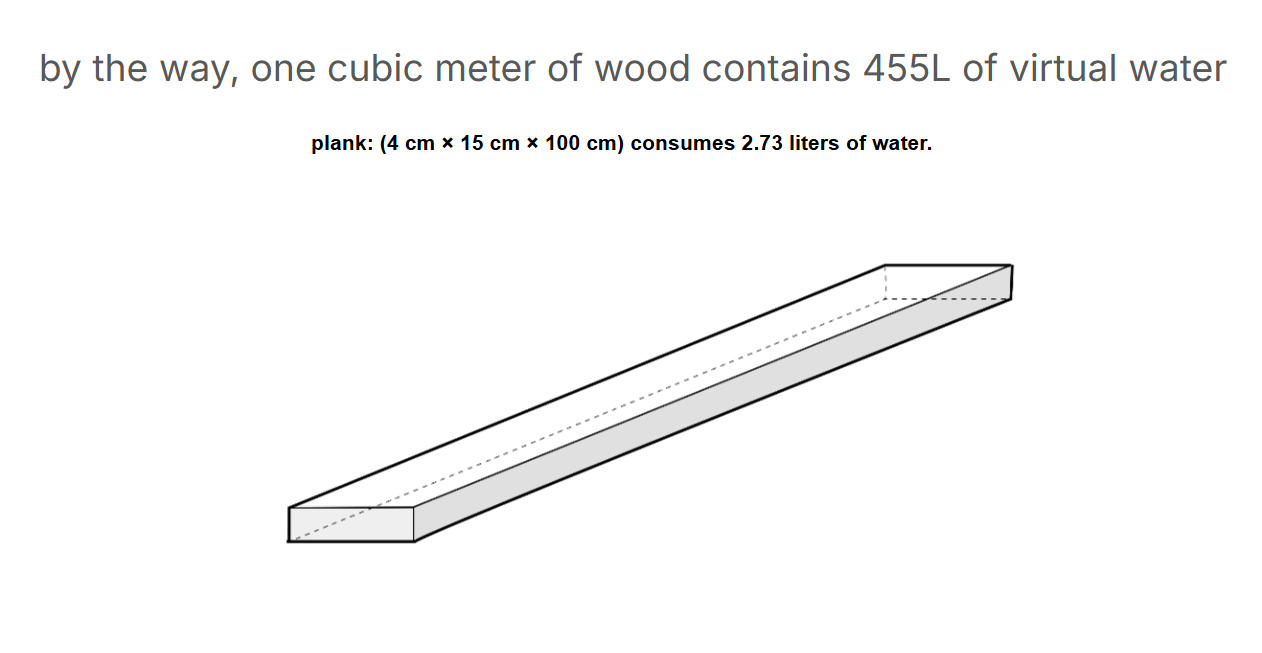
Virtual Water Usage