
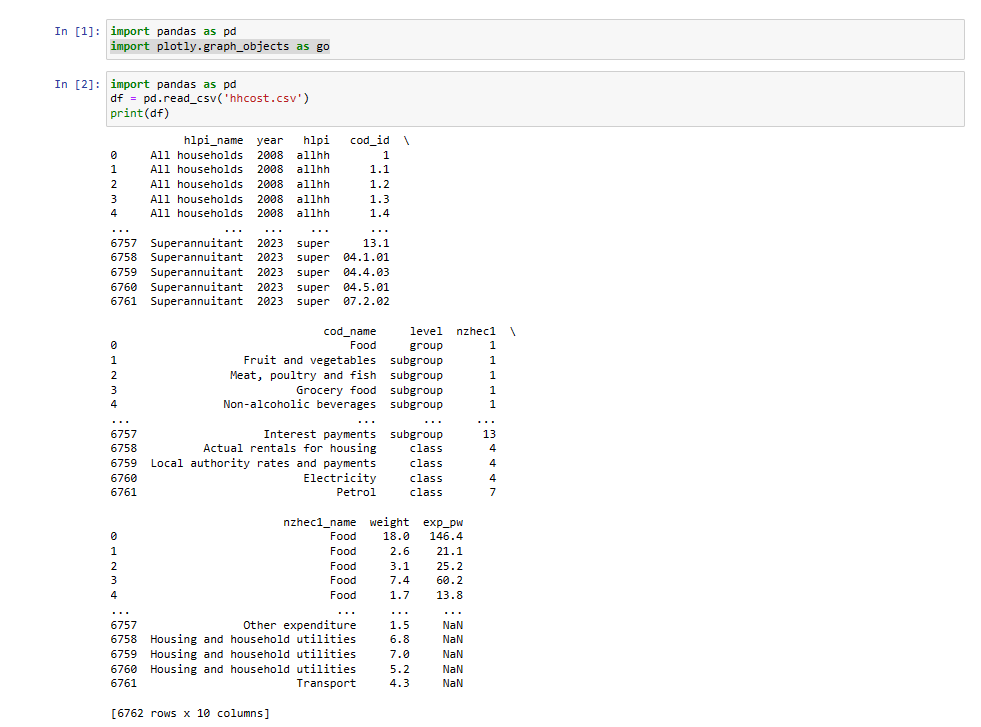
Using python as a digital tool to visualize and arrange datasets; trying to view household costs by accumulating various costs per week.
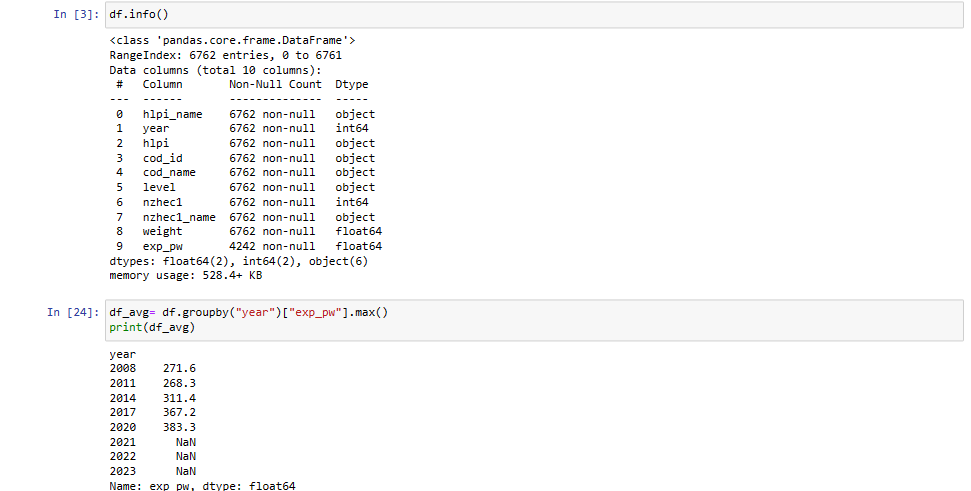
Using the dataset and visualizing the various indices and topics of concern and further pointing out the accumulated average cost of all expenses in a household.
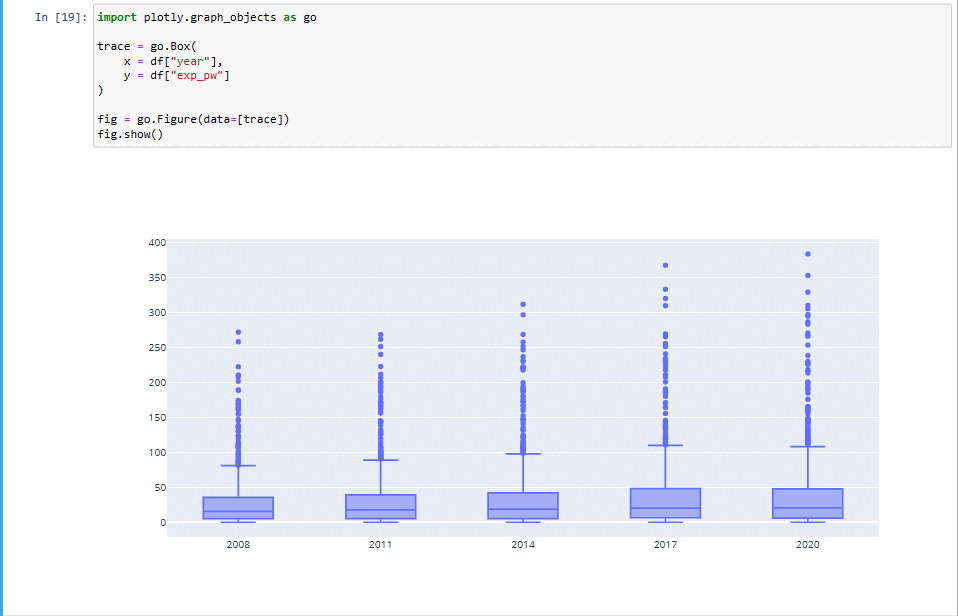
Further visualizing the desired data as plotting it in interactive graphs
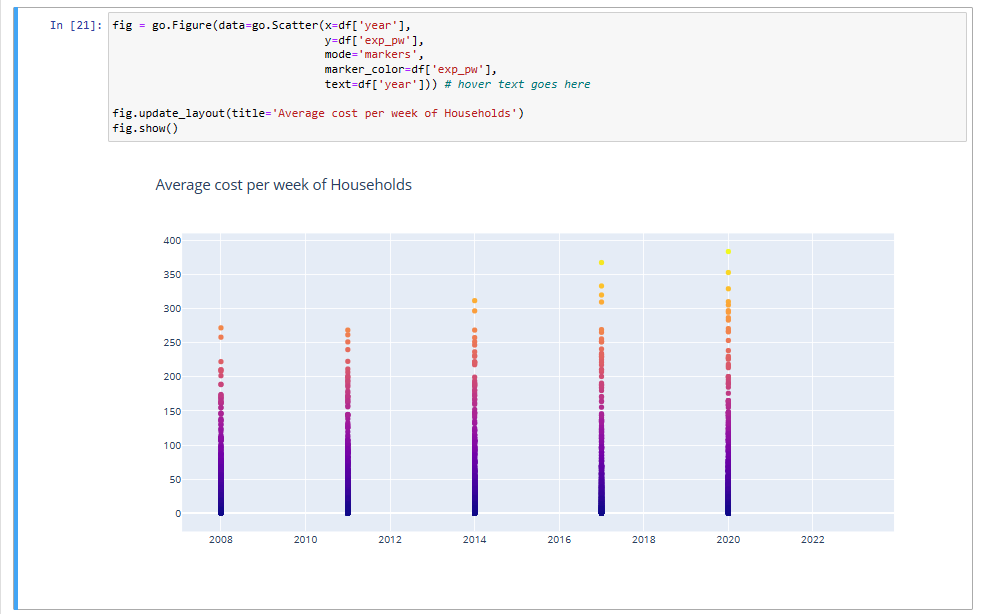
An alternative visuals of the data to be more streamlined in understanding it clearly
Conclusions
Python is a great tool to deduce and simplify data to be digested at various levels and would help plug in to a variety of practices to add structure and value to the practice to build on it further.
