
Our project website can be accessed at bit.ly/graphml
Introduction
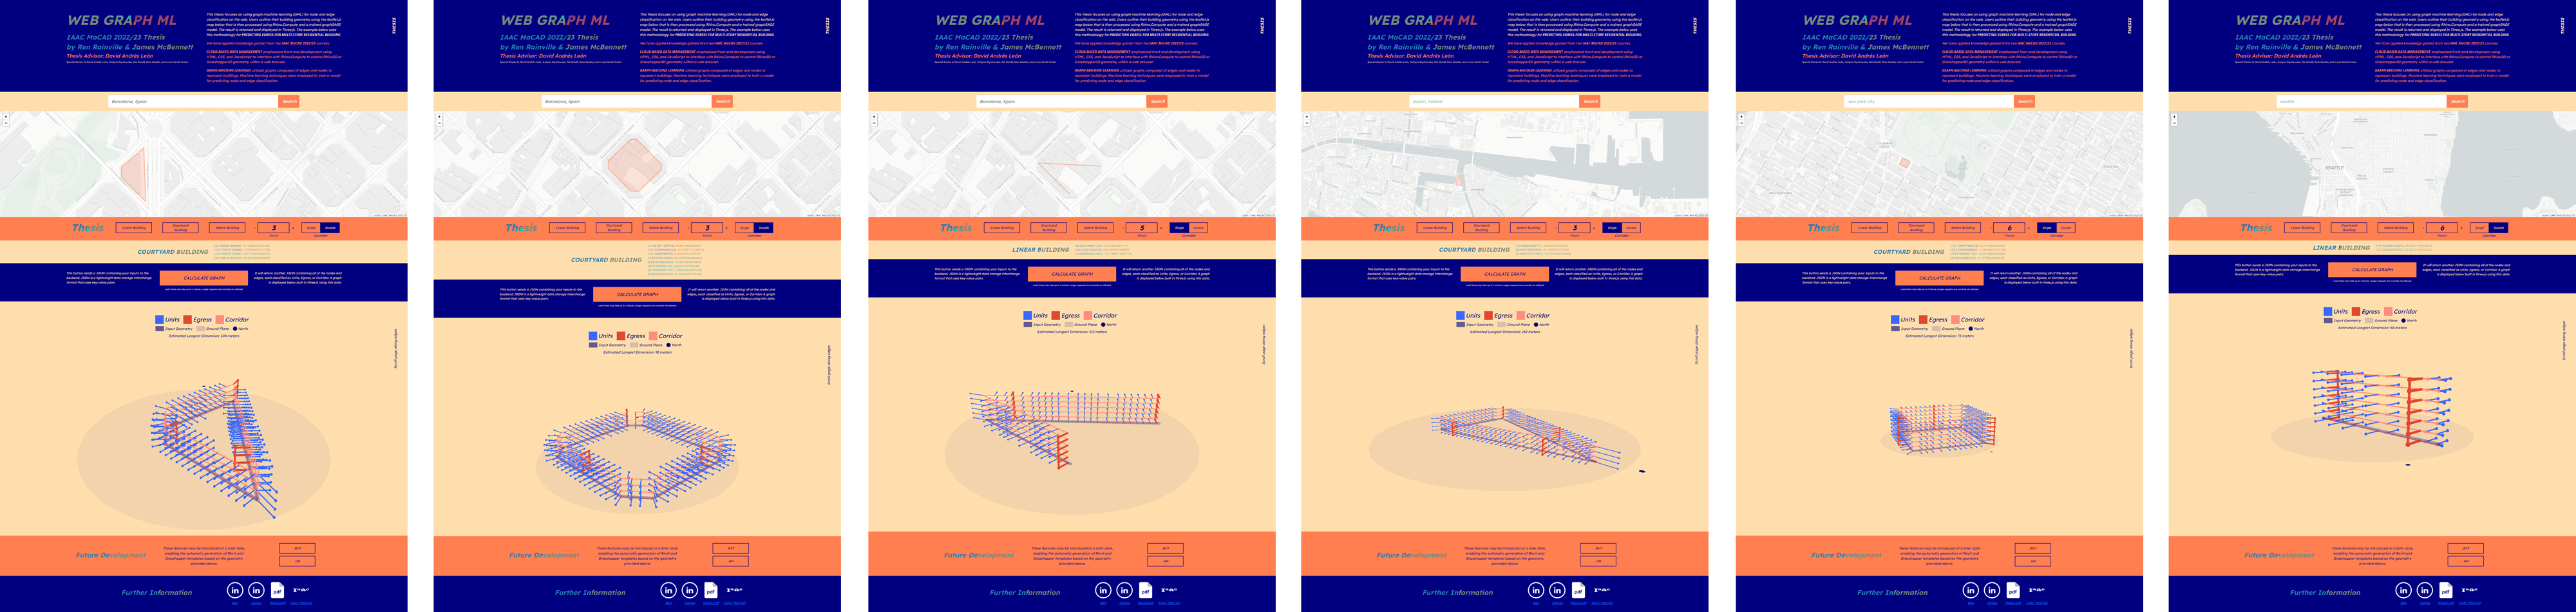
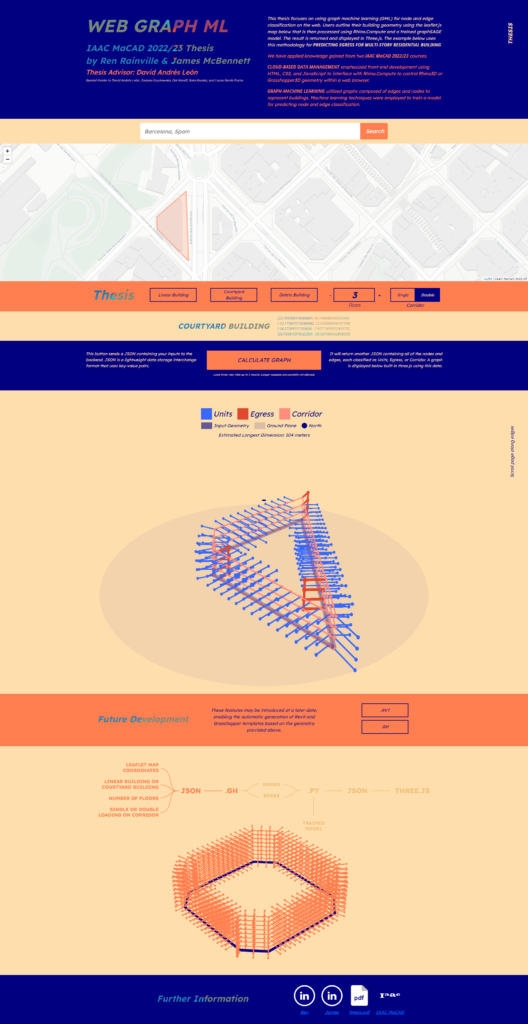
Our research focused on hosting a machine learning model on the web that accesses Rhino.Compute. It receives an input of a polyline drawn on a Leaflet.js map by a user to indicate the central corridor spine of a building and returns a graph of that building displayed in the browser using THREE.js. The future ambition of our research is that a similar process using the same tools and inputs can be used to create further complex outputs such as a downloadable Revit file automatically created from the user’s input geometry.
The tools required to successfully complete this project include HTML, CSS, Javascript, Leaflet.js, and Three.js for the frontend, and Python, Flask, Grasshopper3D, Rhino.Compute, Google Colab Notebooks, Deep Graph Library (DGL), NetworkX, and GraphSage for the backend. VSCode, Github, and Github Desktop were used by both frontend and backend for writing, editing, and sharing code. Postman was used for testing requests to the server both locally and when hosted on Fly.io. The final project was deployed using Github Pages for the frontend and Fly.io for the backend. Setting up a Rhino.Compute server was not part of our project and was instead provided by the Institute of Advanced Architecture Catalonia (IAAC). Exchanges between the frontend and backend were made in JSON.
Frontend:
https://github.com/jamesmcbennettIAAC/webgraphml
Backend:
https://github.com/RenRainville/CloudBasedGraphMachineLearningBackend
All AEC companies are sitting on data reserves that have gone mostly untapped, in the form of servers and data storage. These reservoirs present an opportunity to train further machine learning models. Most of this data is unstructured and housed within inaccessible or unrelated file formats. Time and effort is needed to gather and structure this data, yet this process is beyond the scope of this research.
Achieving a fully functional web-application was our primary goal of this thesis to prove the potential of operating machine learning models from within a browser. Our prototype shared on Github presents the opportunity for others to continue with other machine learning models that build on our workflow. Outside of academia, architects and designers in practice can also produce their own tools to be distributed either inside or shared outside of their organizations.
Web Apps
Our project is easily divided into two sections: the frontend and the backend. The frontend made use of insights gained from our Cloud-Based Data Management course. While the backend built upon Ren’s Graph Machine Learning project focused on egress location prediction.
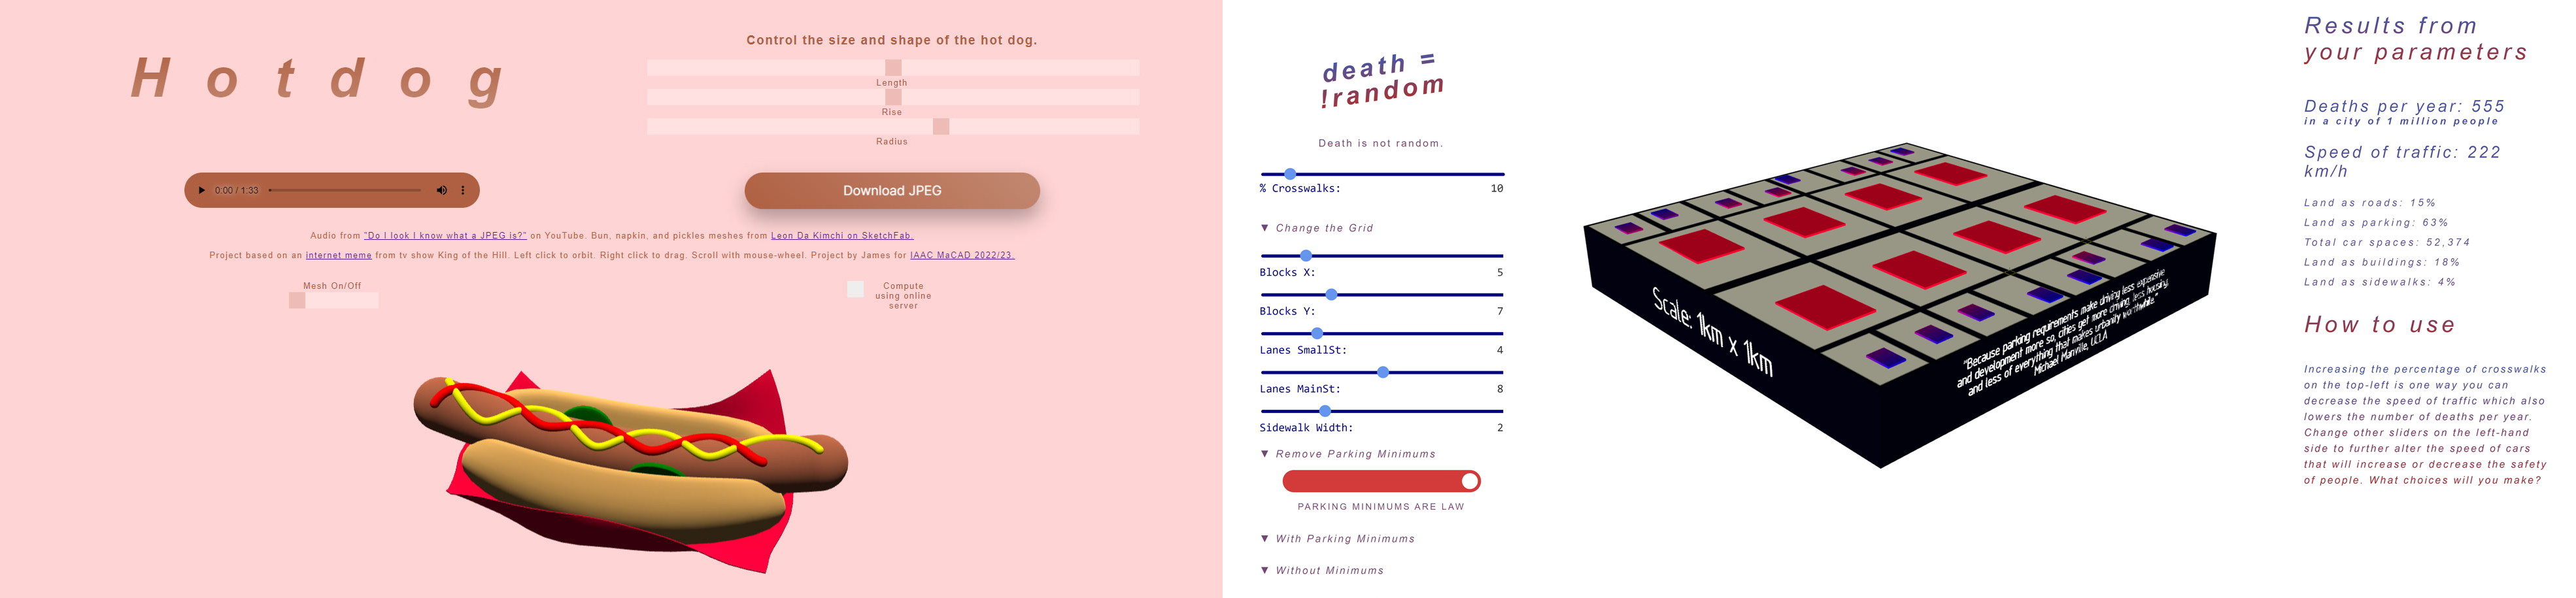
James created a hot dog using a NURBS curve manipulated through sliders in the browser. Rhino.Compute was used to manage the Grasshopper file, (McBennett, 2023). A pipe was offset from the curve converted to a mesh and then assigned colors to become the hot dog. The project was inspired by a meme song “Do I look like I know what a JPEG is, I just want a photo of a got-dang hot dog,” a musical remix of a line said by the character Hank Hill from the TV show King of the Hill, (Drofnasleinad,2015.) We immediately saw an overlap with this project rethinking the lyrics as “Do I look like I know what a JSON is?” This fun example sums up our core philosophy, that users shouldn’t need to be experts in technical details like JPEG or JSON to comprehend or craft intricate concepts.
A website provides numerous benefits, with one of the foremost being its accessibility from any device, anywhere, connecting a diverse range of individuals, from skilled professionals to enthusiastic amateurs, from inquisitive ten-year-old children to postgraduate researchers. The increasing prevalence of a web-centric mindset that welcomes all to participate is a trend we eagerly hope to witness more widespread adoption in the creation of both cities and buildings.
Graph Machine-Learning
In the course Graph Machine Learning from the IAAC MaCAD AI in Architecture term, Ren’s research group that included Sara Kessba and Lucas Sentís Fuster, developed an innovative pre-trained model specifically tailored for predicting egress locations (Rainville et Al, 2023). Due to unforeseen circumstances, the trained machine learning model produced for this project was lost on a failed laptop. Thus, a new model was created for this project using an identical dataset and codebase.
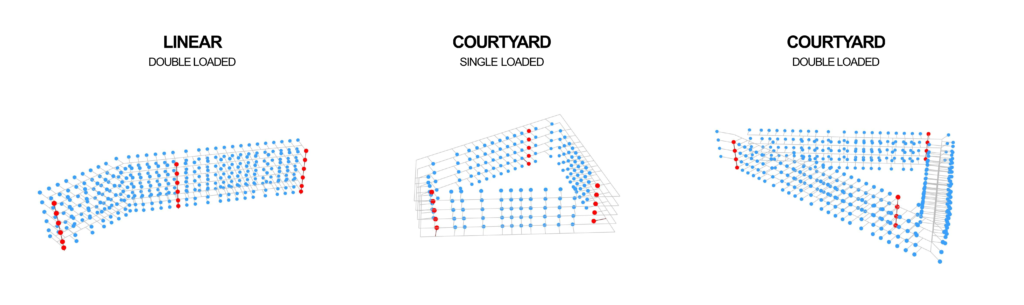
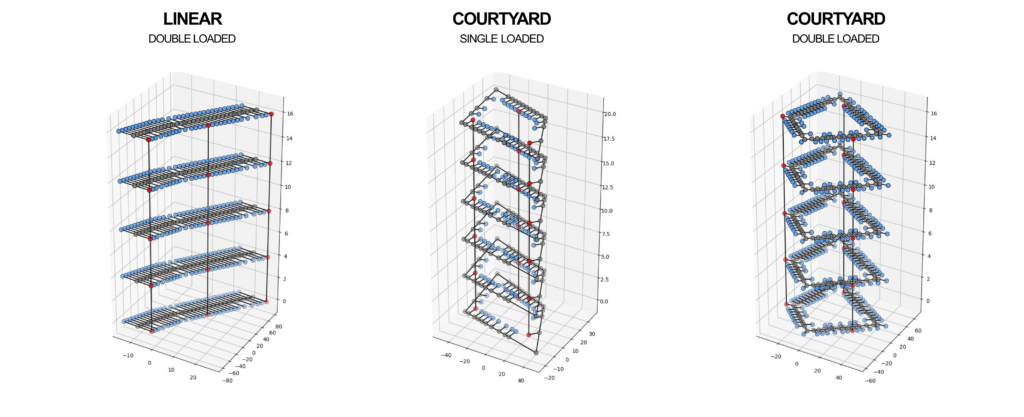
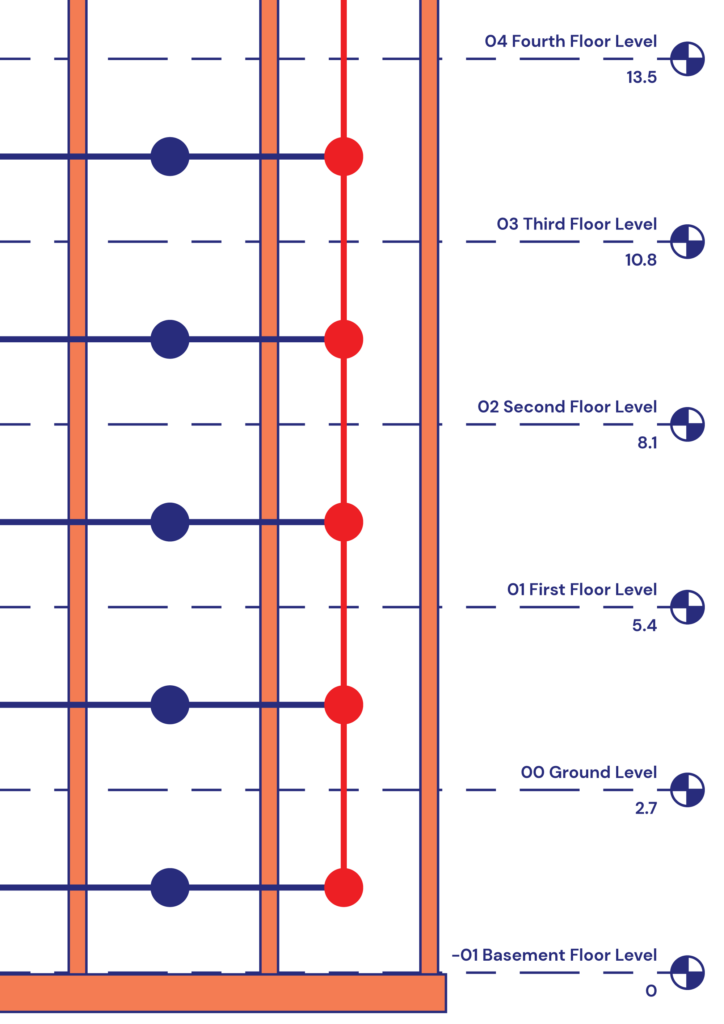
A comprehensive overhaul was made to the previous Grasshopper3D files. The initial project used three distinct grasshopper files that were consolidated into a single streamlined file. The resulting file could execute both linear and courtyard building configurations, accommodate either single or double-loaded corridors, and was flexible enough to support any given number of floors.
The algorithmic foundation of this research was bolstered by a synthetic dataset, which was diligently crafted utilizing the Sampler component of the Design Space Exploration plugin. This innovative component was instrumental in generating a vast array of input value combinations. It accomplished this by adhering to the specific ranges pre-selected by the team for each input parameter. A noteworthy achievement of this research was its ability to generate graph data independent of any other plugins. This meant that while operating on IAAC’s rhino.compute server, there was no imperative to introduce any new plugins, providing the best chance for a seamless integration and operation.
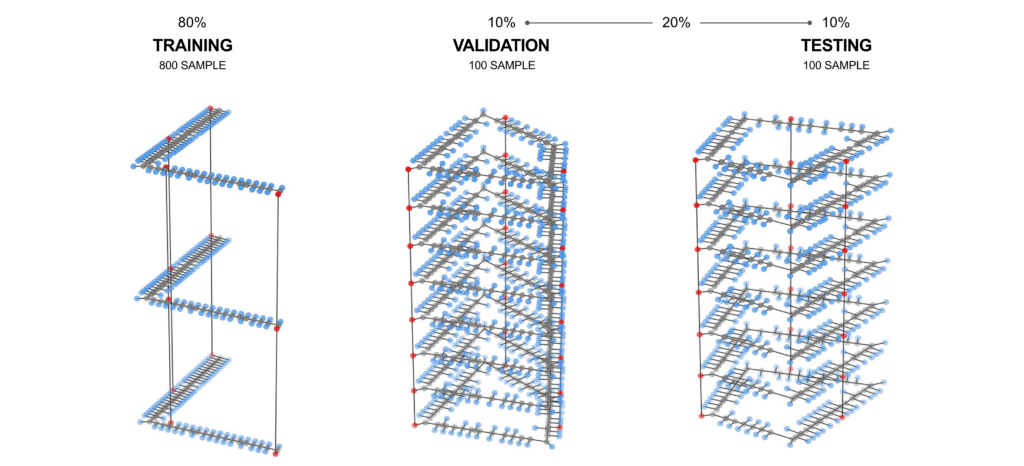
From the set of three thousand samples synthesized, a stratified sampling approach took a balanced representation of each typology resulting in a total of one thousand samples. The dataset was segregated with eighty percent for training while the remaining twenty percent was evenly split between testing and validation.
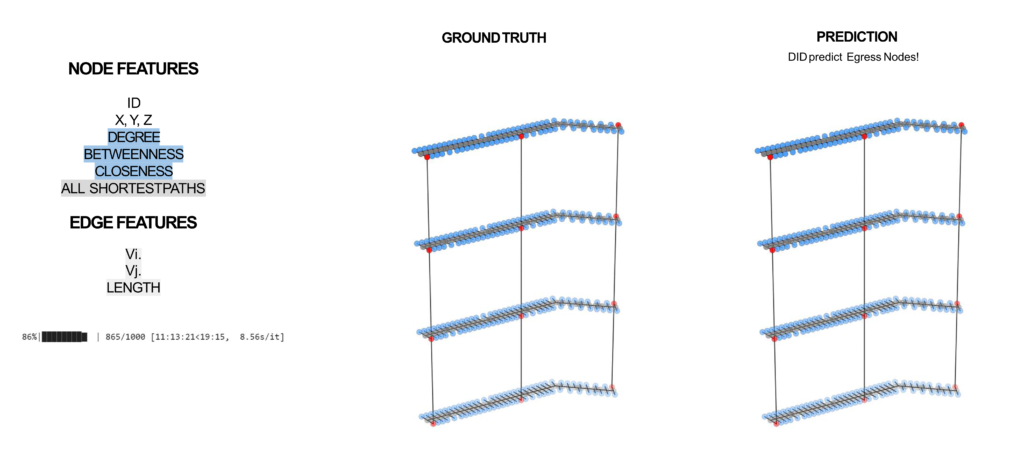
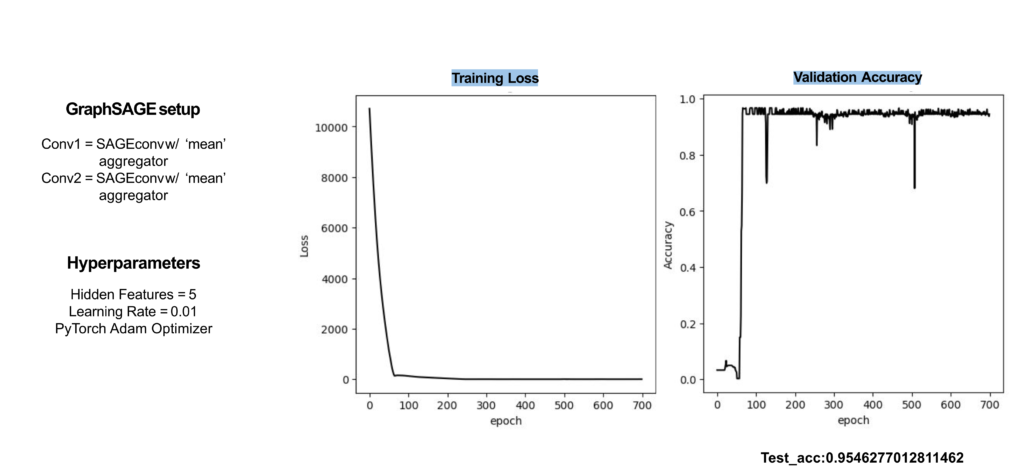
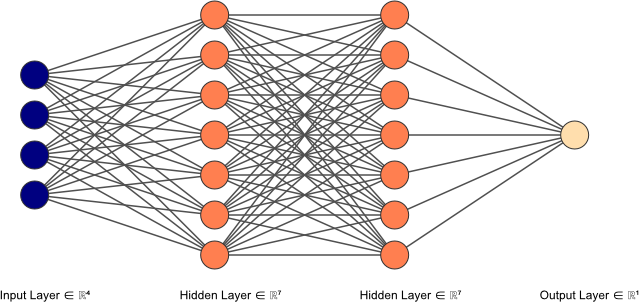
These processes generated zip files that contained CSV files. They were then imported into Google Colab Notebooks, an online Python development environment that offers the advantage of segmenting code into discrete cells. This granularity allows for individual execution and debugging of code segments. Within this environment, the data was transformed into NetworkX graphs. Subsequent transformations converted the graphs with DGL (Deep Graph Library), while attributes were assigned that optimize the machine learning process. This data-rich graph was eventually consolidated into a single input tensor, which was then channeled into the GraphSAGE neural network. The architecture of this network consisted of two convolutional layers, both equipped with a mean type aggregator, seven hidden features, a learning rate of 0.01, and a ReLu activation function. The model was trained for 700 epochs on four input features: degree, betweenness, closeness, and shortest paths. While the eccentricity feature was explored, it was observed to be inconsequential for enhancing egress location prediction.
The results were commendable. The testing phase yielded an accuracy rate of 95%, mirroring the results previously observed during both the training and testing phases of the seminar project. The residual 5% discrepancy manifested as minor inaccuracies in the prediction of node class, especially when tested on the web application. These minor issues would be able to be cleaned up by the end user if they were to affect their generation.
Our Project
Artificial Intelligence (AI) is becoming an integral part of the architectural field, and our research has a dual purpose. Firstly, it aims to make machine learning accessible to everyone by creating a web-based application. In our case, we’ve developed a prototype for egress prediction to demonstrate how browser-based graph machine learning can be applied in architecture. Secondly, our goal is to establish a framework that empowers individuals at all skill levels to create and deploy their own web-based machine learning applications. They can achieve this by branching off from our project and further developing other trained models, not limited to egress prediction, using the same or similar structure and codebase. Our code is available on Github for anyone to use.
Many architects and designers pride themselves on the uniqueness of their creations, likening each of their projects to a newborn baby. A closer introspection often reveals underlying systematic approaches. These methodologies, when deciphered and codified, can unveil predictable patterns and programmatic components. There is an unprecedented opportunity to utilize all textual artifacts, inclusive of architects’ reflective commentaries, by channeling these information reservoirs of discrete data into advanced AI tools likeDiffusion or Large Language Models (LLM) and other AI technologies. This digital documentation preserves legacy knowledge and equips the next generation with a robust foundation, catalyzing architectural innovations beyond contemporary imagination.
Building a working website that successfully returned an accurate 3D model proved significantly challenging requiring the acquisition of new skills as the project progressed. Our prototype was divided into the frontend and backend with the backend facing more challenges. The code was built iteratively, getting each component tested and working before moving onto the next. Collaboration between James and Ren was done by regular pushes to respective Github repositories.

The Frontend
The frontend is a single-page application built using HTML (HyperText Markup Language), CSS (Cascading Style Sheet) and Javascript that communicates with the backend using JSON (JavaScript Object Notation).This research developed a unique JSON schema for the data transfer from the frontend to the backend and for the graphs and returning data to the frontend used an adapted JSON Graph Format specification obtained from https://github.com/jsongraph/json-graph-specification. Further files were linked to the HTML document as needed. Bootstrap was used to take advantage of already created CSS code, Leaflet.js was used for the map, and Three.js to render a 3D model in the browser.
The body of the HTML file is structured from top to bottom using div containers that resemble the order of elements as displayed on the website. Containers are full width visually differentiated using different standard HTML colors, Navy (#00008A), Coral (#FF7F50), and Navajo White (#FFDEAD).
CSS is used to modify style properties of various elements, columns, and containers. Properties such as text, color, padding, and margin are all edited from the CSS file. The coordinates and 3D model containers load as hidden by default until activated using JavaScript to change the CSS property from hidden to visible. Leaflet maps set a number of the default buttons to hidden that were recreated outside of the map area and controlled using JavaScript.
There was an initial attempt to obtain the coordinates from the map as decimal degrees, this caused issues when sending point coordinates to Grasshopper in Rhino.Compute. An easier route was found using pixel coordinates that are processed using a number of functions in JavaScript to scale the coordinates to real-world dimensions, relocate points to the origin, and ensure the points are listed counter-clockwise.
The principal action of the website is activated by clicking the calculate graph button. This button when initiated consolidates all input information as a custom JSON to transmit to the backend, and then unhides the three.js container and waits until another JSON is returned to build the three.js model.
The Backend
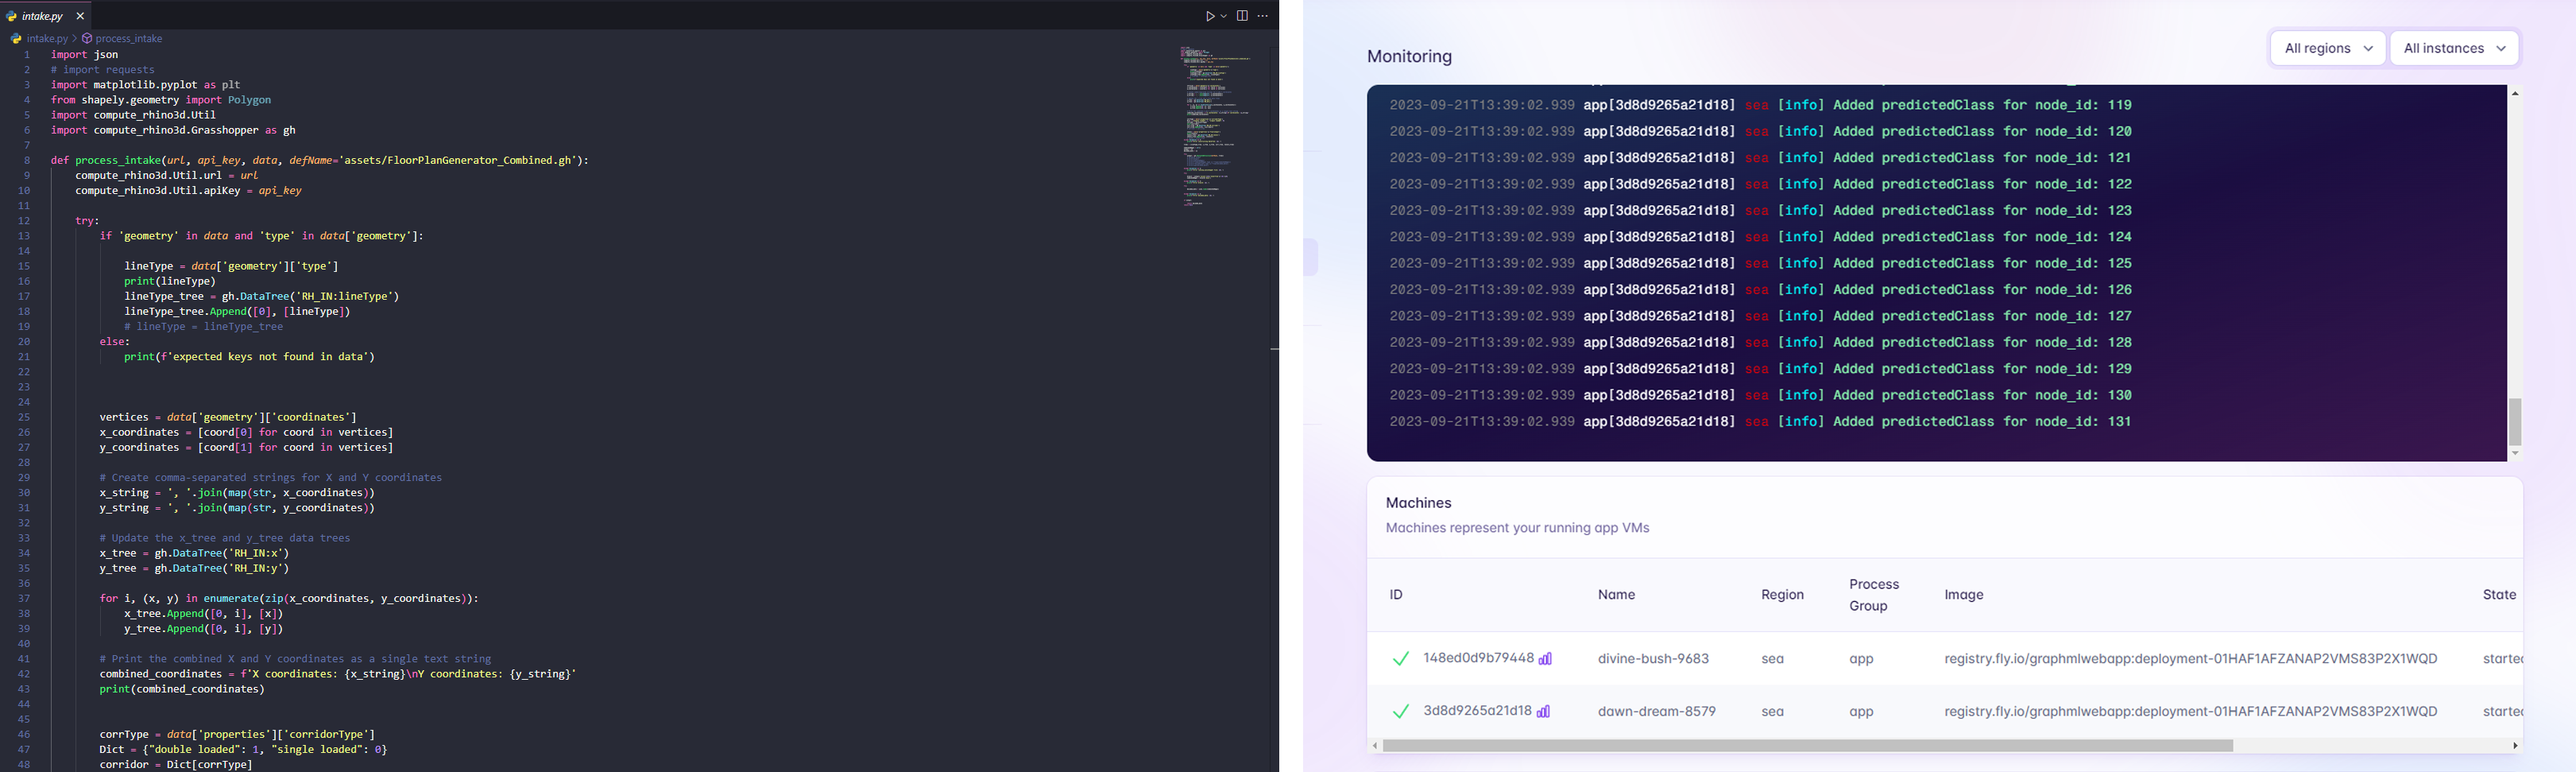
On the backend, the research introduces a robust framework anchored on a Python Flask server. The architecture is complemented by defined Python functions separated by use into different .py files, ensuring ease of integration with the Flask server and facilitating future teams to build upon this foundation. The web application is orchestrated through three pivotal Python files: intake.py, predict.py, and server.py. These files, aptly named reflecting their core functionalities, collectively ensure seamless data intake, prediction, and server operations. While intake.py manages data extraction and preparation, predict.py is tailored for specific prediction mechanisms. The nerve center, server.py, handles the initial HTTP request, choreographs the functions, ensures logical progression and eventually appends the ‘predictedClass’ property to nodes. The enriched graph data is subsequently relayed to the frontend, offering users a visual insight.
JSON
A definition from JSON.org “JSON (JavaScript Object Notation) is a lightweight data-interchange format. It is easy for humans to read and write. It is easy for machines to parse and generate. It is based on a subset of the JavaScript Programming Language Standard ECMA-262 3rd Edition – December 1999. JSON is a text format that is completely language independent but uses conventions that are familiar to programmers of the C-family of languages, including C, C++, C#, Java, JavaScript, Perl, Python, and many others. These properties make JSON an ideal data-interchange language.
JSON is built on two structures:
- A collection of name/value pairs. In various languages, this is realized as an object, record, struct, dictionary, hash table, keyed list, or associative array.
- An ordered list of values. This is realized as an array, vector, list, or sequence.
These are universal data structures. Virtually all modern programming languages support them in one form or another. It makes sense that a data format that is interchangeable with programming languages also be based on these structures,” (Introducing JSON, 2023)
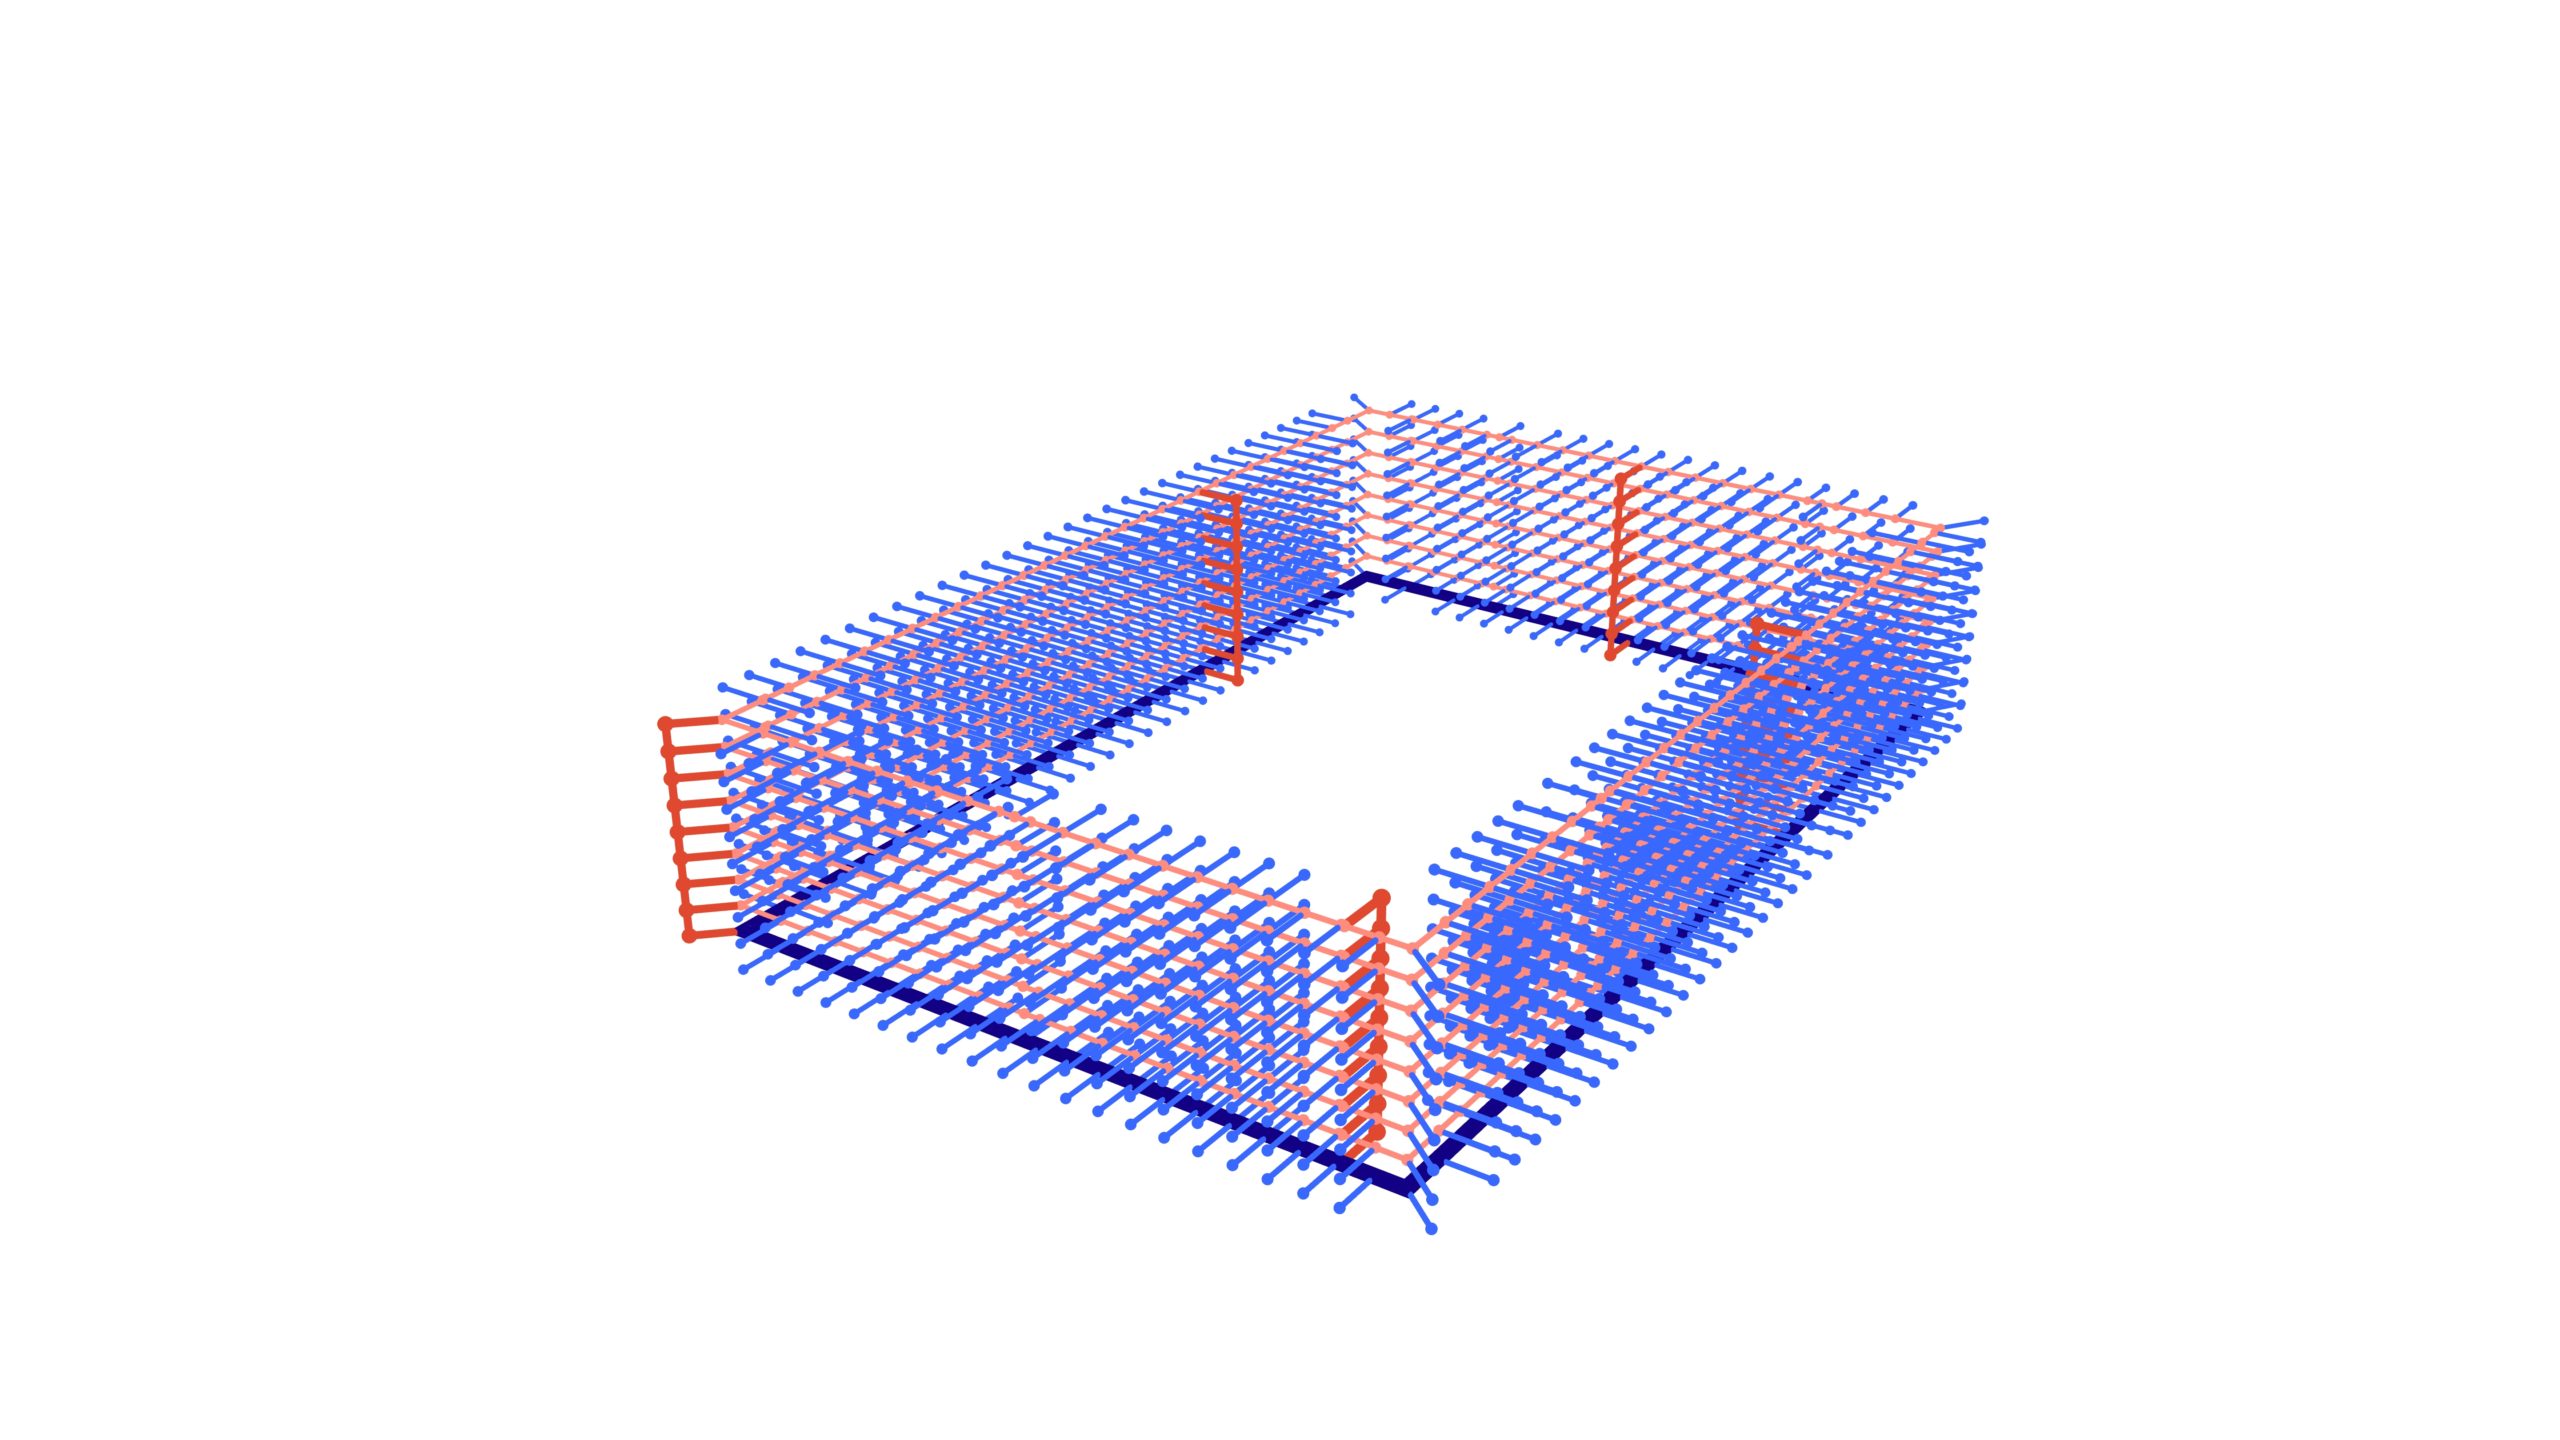
JSON was used to transmit data from our frontend to our backend sending coordinates, the number of floors, whether the input geometry is a linear or a courtyard building, and whether the user has a single or double loaded corridor. The JSON received from the backend is much longer and in a different schema containing the xyz coordinates and predicted class of every node, as well as the source node and the target node for every edge.
JSON From Frontend in Raw Format
{“type”:”feature”,”geometry”:{“type”:”LineString”,”coordinates”:[[-35.20054899143092,-60.109
41204892655],[38.18364636358612,8.800137247857743],[-2.983097372155147,51.3092748010
6883]]},”properties”:{“corridorType”:”single loaded”,”typology”:”linear”,”floorsInput”:2}}
JSON From Backend in Raw Format
{“features”:[{“node”:{“properties”:{“degree”:1,”label”:0,”metadata”:{“geometry”:{“coordinates”:[
-24.599187741604354,-60.442788188858195,0.0],”type”:”Point”},”type”:”Feature”},”predicted
Class”:”0”},”type”:”object”}},{“node”:{“properties”:{“degree”:1,”label”:1,”metadata”:{“geometry”:{
“coordinates”:[-20.954275278351616,-57.02012648555987,0.0],”type”:”Point”},”type”:”Feature”
},”predictedClass”:”0”},”type”:”object”}},{“node”:{“properties”:{“degree”:1,”label”:2,”metadata”:{
“geometry”:{“coordinates”:[-15.48690658347251,-51.88613393061243,0.0],”type”:”Point”},”type
”:”Feature”},”predictedClass”:”0”},”type”:”object”}},{“node”:{“properties”:{“degree”:1,”label”:3,”
metadata”:{“geometry”:{“coordinates”:[-10.01953788859339,-46.75214137566497,0.0],”type”:”
Point”},”type”:”Feature”},”predictedClass”:”0”},”type”:”object”}},{“node”:{“properties”:{“degree”:
1,”label”:4,”metadata”:{“geometry”:{“coordinates”:[-6.374625425340645,-43.32947967236666,
0.0],”type”:”Point”},”type”:”Feature”},”predictedClass”:”0”},”type”:”object”}},{“node”:{“propertie
s”:{“degree”:1,”label”:5,”metadata”:{“geometry”:{“coordinates”:[-0.9072567304615461,-38.1954
87117419226,0.0],”type”:”Point”},”type”:”Feature”},”predictedClass”:”0”},”type”:”object”}},{“node
”:{“properties”:{“degree”:1,”label”:6,”metadata”:{“geometry”:{“coordinates”:[4.560111964417579,
-33.06149456247177,0.0],”type”:”Point”},”type”:”Feature”},”predictedClass”:”0”},”type”:”object”
}},{“node”:{“properties”:{“degree”:1,”label”:7,”metadata”:{“geometry”:{“coordinates”:[8.2050244
27670304,-29.638832859173462,0.0],”type”:”Point”},”type”:”Feature”},”predictedClass”:”0”},”
type”:”object”}},{“node”:{“properties”:{“degree”:1,”label”:8,”metadata”:{“geometry”:{“coordina
tes”:[11.849936890923049,-26.216171155875163,0.0],”type”:”Point”},”ype”:”Feature”},”predicted
Class”:”0”},”type”:”object”}},{“node”:{“properties”:{“degree”:1,”label”:9,”metadata”:{“geometry”:{
“coordinates”:[15.494849354175793,-22.793509452576842,0.0],”type”:”Point”},”type”:”Feature
”},”predictedClass”:”0”},”type”:”object”}},{“node”:{“properties”:{“degree”:1,”label”:10,”metadata”:
{“geometry”:{“coordinates”:[20.962218049054922,-17.659516897629377,0.0],”type”:”Point”},”
type”:”Feature”},”predictedClass”:”0”},”type”:”object”}},{“node”:{“properties”:{“degree”:1,”label”:
11,”metadata”:{“geometry”:{“coordinates”:[30.07449920718677,-9.102862639383625,0.0],”type
”:”Point”},”type”:”Feature”},”predictedClass”:”0”},”type”:”object”}},{“node”:{“properties”:{“degre
e”:1,”label”:12,”metadata”:{“geometry”:{“coordinates”:[33.7194116704395,-5.680200936085314,
0.0],”type”:”Point”},”type”:”Feature”},”predictedClass”:”0”},”type”:”object”}},{“node”:{“propertie
s”:{“degree”:1,”label”:13,”metadata”:{“geometry”:{“coordinates”:[39.18678036531861,-0.5462083
811378747,0.0],”type”:”Point”},”type”:”Feature”},”predictedClass”:”0”},”type”:”object”}},{“node”:{“
properties”:{“degree”:1,”label”:14,”metadata”:{“geometry”:{“coordinates”:[44.83282315637598,11.
905482524031891,0.0],”type”:”Point”},”type”:”Feature”},”predictedClass”:”0”},”type”:”object”}},{
“node”:{“properties”:{“degree”:1,”label”:15,”metadata”:{“geometry”:{“coordinates”:[34.89932306
24893,22.972480569024924,0.0],”type”:”Point”},”type”:”Feature”},”predictedClass”:”0”},”type”:
”object”}},{“node”:{“properties”:{“degree”:1,”label”:16,”metadata”:{“geometry”:{“coordinates”:[31.
…………………………….
Debugging
ChatGPT helped us understand each line of code in great detail, often pointing us in the right direction on how to move forward.
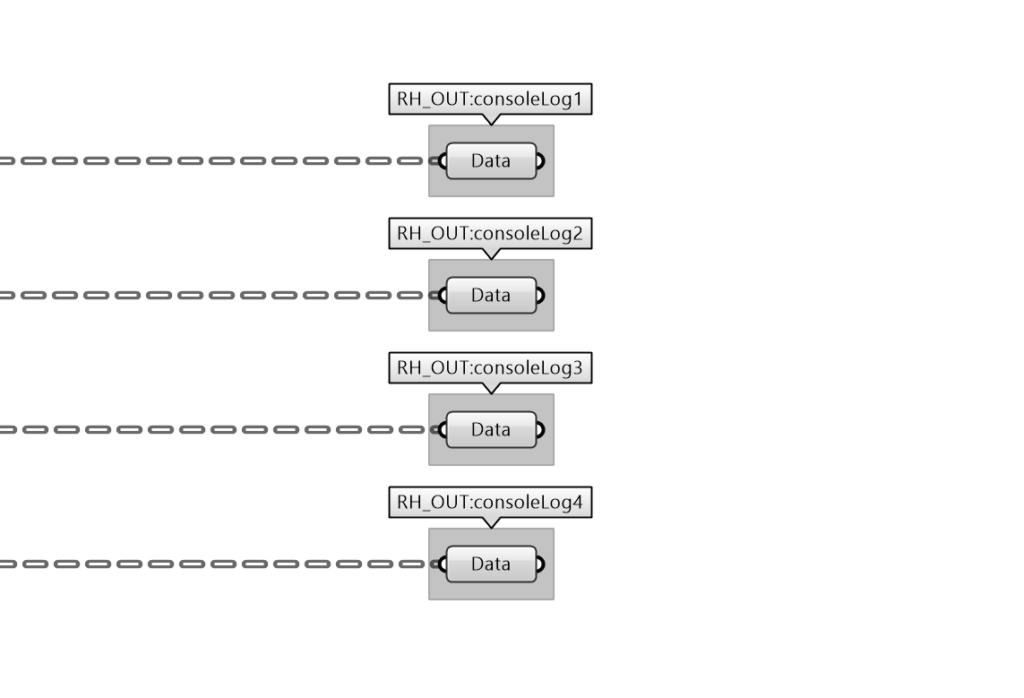
Unfortunately, our initial attempt did not yield the correct 3D Model in the browser. The Fly.io server returned a JSON with coordinates that came from the default coordinates assigned in the Grasshopper file instead of those obtained from the Leaflet.js map. Rhino.Compute was not successfully receiving the accurate values as expected. One of our troubleshooting approaches involved creating multiple console outputs within our Grasshopper file to pinpoint the specific components causing problems to the file. When we posted a request to the server, we were able to monitor the server on Fly.io, enabling us to identify which components in Grasshopper were successfully transmitting information and which ones were not.
Monitoring Server on Fly.io
2023-09-16T11:29:08.580 app[32874279f634d8] sea [info] LineString
2023-09-16T11:29:08.580 app[32874279f634d8] sea [info] X coordinates: 30.80369581211719, -30.80369581211719
2023-09-16T11:29:08.580 app[32874279f634d8] sea [info] Y coordinates: -80.16383488454595, 80.16383488454595
2023-09-16T11:29:08.581 app[32874279f634d8] sea [info] 0
2023-09-16T11:29:08.581 app[32874279f634d8] sea [info] 2
2023-09-16T11:29:08.584 app[32874279f634d8] sea [info] [DEBUG] Starting new HTTPS connection (1): compute-server.iaac.net:443
2023-09-16T11:29:11.891 app[32874279f634d8] sea [info] [DEBUG] https://compute-server.iaac.net:443 “POST /grasshopper HTTP/1.1” 200 None
2023-09-16T11:29:12.193 app[32874279f634d8] sea [info] {‘absolutetolerance’: 0.0, ‘angletolerance’: 0.0, ‘modelunits’: ‘Millimeters’, ‘algo’: ‘’, ‘pointer’: ‘md5_4F538FFD13D2CB72F8A8C1F082A90B9B’, ‘cachesolve’: False, ‘recursionlevel’: 0, ‘values’: [{‘ParamName’: ‘RH_OUT:output’, ‘InnerTree’: {‘{0}’: [{‘type’: ‘System.String’, ‘data’: ‘”{\”title\”: \”Graph Start\”, \”type\”: \”FeatureCollection\”, \”features\”: [{\”node\”: {\”properties\”: {\”label\”: 0, \”metadata\”: {\”type\”: \”Feature\”, \”geometry\”: {\”coordinates\”: [35.114451827550731, -70.472736774661669, 0.0], \”type\”: \”Point\”}}, \”degree\”: 1}, \”type\”: \”object\”}}, {\”node\”: {\”properties\”: {\”label\”: 1, \”metadata\”: {\”type\”: \”Feature\”, \”geometry\”: {\”coordinates\”: [33.321004462733782, -65.805452066222372, 0.0], \”type\”: \”Point\”}}, \”degree\”: 1}, \”type\”: \”object\”}}, {\”node\”: {\”properties\”: {\”label\”: 2, \”metadata\”: {\”type\”: \”Feature\”, \”geometry\”: {\”coordinates\”: [30.630833415508352, -58.804525003563448, 0.0], \”type\”: \”Point\”}}, \”degree\”: 1}, \”type\”: \”object\”}}, {\”node\”: {\”properties\”: {\”label\”: 3, \”metadata\”: {\”type\”: \”Feature\”, \”geometry\”: {\”coordinates\”: [27.940662368282911, -51.803597940904524, 0.0], \”type\”: \”Point\”}}, \”degree\”: 1}, \”type\”: \”object\”}}, {\”node\”: {\”properties\”: {\”label\”: 4, \”metadata\”: {\”type\”: \”Feature\”, \”geometry\”: {\”coordinates\”: [26.147215003465973, -47.136313232465263, 0.0], \”type\”: \”Point\”}}, \”degree\”: 1}, \”type\”: \”object\”}}, {\”node\”: {\”properties\”: {\”label\”: 5, \”metadata\”: {\”type\”: \”Feature\”, \”geometry\”: {\”coordinates\”: [23.457043956240554, -40.135386169806296, 0.0], \”type\”: \”Point\”}}, \”degree\”: 1}, \”type\”: \”object\”}}, {\”node\”: {\”properties\”: {\”label\”: 6, \”metadata\”: {\”type\”: \”Feature\”, \”geometry\”: {\”coordinates\”: [20.766872909015149, -33.134459107147407, 0.0], \”type\”: \”Point\”}}, \”degree\”: 1}, \”type\”: \”object\”}}, {\”node\”: {\”properties\”: {\”label\”: 7, \”metadata\”: {\”type\”: \”Feature\”, \”geometry\”: {\”coordinates\”: [18.973425544198186, -28.467174398708096………………………
Expanding Graph-Based Predictions
The journey of this research was embarked upon with soaring aspirations, some of which necessitated exploration beyond the confines of the current project scope. Future work to further the progress already made would involve a novel concept of generating dual graphs. The first graph, from the research, is dedicated to discerning egress locations, while in contrast, the future counterpart would encapsulate the spatial positioning of walls. A consideration is to mix the graph data if the nodes from the egress location graph were paired with edges that existed between the nodes or rooms; these edges would represent the building’s walls. This proposed design utilizes the results of inductive node classification upon the egress location graph. Consequently, the ‘predictedClass’ property, once deduced, is combined with the wall graph, serving as edge features. This intricate layering aids in ascertaining the requisite wall type based on the specific uses flanking it.
This, future, secondary graph, would also be crafted in the team’s adapted JSON Graph Format. In the frontend application, users could seamlessly download this graph via a button located beneath the 3D viewport. Accompanying this would be a tailored Grasshopper (.gh) file, compatible with Rhino.Inside.Revit, which adeptly transmutes data from the JSON file, generating floors, walls, doors, windows, rooms, and roofs, thereby sketching the rudimentary blueprint of the building. Such outputs bridge the chasm between conceptual ideation and digital realization, streamlining the transition. Furthermore, this approach resonates with diverse skill spectrums within the architectural domain, democratizing access to advanced tools.
The Renaissance of Bi-Directional Mentoring
Bi-Directional Mentoring has witnessed its popularity oscillate over time. A seminal Stanford paper from 2003, titled “Mentoring Models in Support of P5 BL in Architecture/Engineering/Construction Global Teamwork,” (Fruchter and Lewis, 2003) elucidates this concept in detail. It articulates, “This study presents an analysis of mentoring models in scaffolding the students’ cross-disciplinary teamwork design process, as well as a description of students’ roles in scaffolding the mentors’ understanding of cutting-edge collaboration technologies.” The monumental significance of AEC students immersing themselves in cross-disciplinary endeavors, enriched by geographical, cultural, and proficiency diversities, is indisputable. This project-oriented initiative bore fruit for both students and industry veterans who mentored and collaborated within the program. Telecommunications and video conferencing of that era were heralded as harbingers of a “technology-rich environment”, nudging students out of their comfort zones to engage across temporal, geographical, and disciplinary divides.
The echoes of this two-decade-old research are palpable today, as we navigate a virtual academic realm, leveraging a plethora of digital tools with participants spanning the globe. Whether it’s interdisciplinary collaborations or pairing seasoned architects with novice staff, these interactions yield mutual benefits. Bi-directional mentoring, whether realized across disciplines or spanning age and skill gradients, has the potential to rejuvenate our teams and architectural firms.
Drawing from firsthand experiences, the efficacy of bi-directional mentoring in the workplace is evident. There have been instances where seasoned architects have generously imparted their wisdom, and in a refreshing reversal of roles, have also sought assistance, recognizing their constraints and the expertise of their junior counterparts in areas where they lack. A potential impediment to the widespread adoption of bi-directional mentoring might be the misplaced notion among veterans that they stand to gain little from their younger colleagues. Such a perspective is a stark departure from reality. It’s imperative for the architectural domain to recalibrate its understanding, recognizing the intrinsic value each team member brings to the table. Every individual, with their unique experiences and knowledge reservoirs, enriches the collective tapestry of the profession.
This research aims to bridge the gap between architectural knowledge and technological knowledge, while remaining valuable for individuals with both knowledge bases. By providing an accessible interface for a wide array of users’ skills and abilities the web application is considered a stepping stone for bi-directional mentoring.
Conclusions
In retrospect, the journey of this research has been both enlightening and productive, marking significant strides in integrating machine learning within a user-friendly web framework. The outcomes of this study stand testament to the potential of budding researchers, showcasing that even a duo of graduate students can masterfully construct a single-page application that efficiently harnesses a machine learning model.
The framework birthed by this research promises to serve as a foundational platform for subsequent academic pursuits. In an architectural landscape that often revels in the allure of crafting each building as a distinct masterpiece, there emerges an imperative for introspection. The profession must pivot towards identifying those recurring motifs and patterns that can be predicted, drawing insights from historical firm data. However, the utilization of legacy data is not without its challenges. The meticulous task of curating, cleansing, and structuring this data to render it compatible for a machine learning setting cannot be understated.
Indeed, the oft-quoted adage resonates profoundly with our experiences: data preparation, which encompasses cleaning and structuring, often consumes a staggering eighty percent of the total effort, relegating the actual machine learning process to the remaining twenty percent. Our academic sojourn during the third term, “AI in Architecture”, offered us a vivid illustration of this reality. A significant amount of effort is invested in the meticulous process of sourcing apt data and meticulously refining it to ensure its seamless integration with the designated algorithm.
References
Drofnasleinad, Youtuber. Do I look like I know what a JPEG is? (Club Remix). YouTube. YouTube, 2015. https://www.youtube.com/watch?v=ZXVhOPiM4mk&t=11s.
Fruchter, Renate, and Sarah Lewis. “Mentoring Models in Support of P^ 5BL in Architecture/Engineering/Construction Global Teamwork.” International Journal of Engineering Education, January 2003.
Harness, Clifton, and Ryan Griege. “Real Estate Feasibility Platform.” TestFit. Accessed September 23, 2023. http://www.testfit.io/.
“Introducing JSON.” JSON. Accessed September 24, 2023. https://www.json.org/json-en.html.
Keough, Ian, and Anthony Hauck. Hypar. Accessed September 23, 2023. https://hypar.io/.
LeNail, Alexander. “NN-Svg: Publication-Ready Neural Network Architecture Schematics.” Journal of Open Source Software 4, no. 33 (2019): 747. https://doi.org/10.21105/joss.00747.
McBennett, James. “Death?!= Random.” IAAC BLOG, May 4, 2023. https://blog.iaac.net/death-random/.
Rainville, Ren, Sara Kessba, and Lucas Sentís Fuster. “Egress Prediction.” IAAC Blog, July 2, 2023. https://blog.iaac.net/egress-prediction/.
Suleyman, Mustafa, and Michael Bhaskar. The Coming Wave: Technology, power, and the twenty-first century’s greatest dilemma. New York: Crown, 2023.
