
The Computational Evolution of CAD and BIM (1750–2025)
The Visualization Research Diagram traces the historical and technological evolution of computer-aided design (CAD) and Building Information Modeling (BIM) as part of architecture’s broader shift from representation to computation. Organized as a linear timeline, the diagram identifies key phases; from the mechanization of drawing during the Industrial Revolution to the emergence of intelligent, AI-driven design systems today, illustrating how each period redefined the relationship between geometry, information, and design practice.
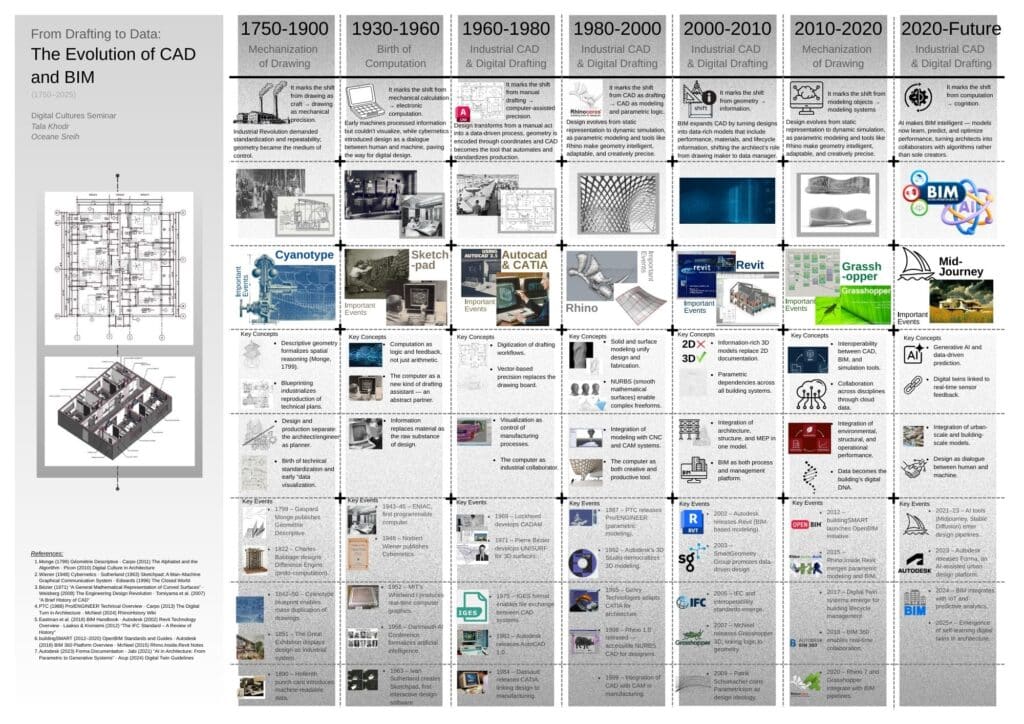
Ultimately, the diagram presents visualization as an evolving infrastructure of thought. What began as an act of representation has become a computational process: an interface where information, material, and intelligence continuously negotiate the making of space.
The Tool
The tool we propose represents the next evolutionary step in architectural and engineering digital practice, extending the usefulness of CAD and BIM far beyond their traditional roles. Today, these tools dominate the design and construction phases, enabling precise modeling, coordination, and documentation. Yet once a building is completed, the digital model often becomes static, frozen in time despite the fact that buildings themselves are continuously evolving entities. This disconnect between digital representation and physical reality weakens collaboration between disciplines and allows critical issues to go undetected. Our tool directly addresses this gap by transforming BIM into a living, dynamic ecosystem that supports the building throughout its entire lifecycle.
At the core of our system is the integration of a dense network of sensors embedded within the building’s structure, materials, and mechanical systems. These sensors function as the building’s “nervous system,” constantly monitoring conditions related to moisture, load, temperature, vibration, energy consumption, airflow, and more. Rather than relying on periodic inspection or responsive maintenance, the building becomes capable of self-diagnosis. When an anomaly occurs, such as prolonged humidity inside a wall, a stressed beam after a storm, a leaking pipe, or an electrical irregularity, the system identifies it at its earliest stage. This data is then processed through an AI-driven digital twin that updates the BIM model in real time, allowing the digital representation to remain accurate and reflective of the building’s ongoing performance.
To communicate this information effectively, the tool includes a wearable device, a lightweight wristband, that sends a tactile alert to the architect, engineer, or facility manager. When the user raises their arm, a holographic projection of the building appears, presenting a fully interactive 3D model layered with real-time diagnostic data. Users can zoom into specific walls or systems, peel back structural layers, trace the origin of a failure, and visualize the timeline of a developing issue. This holographic interface unifies all disciplines within a single shared environment, eliminating the fragmentation that currently exists between architectural, structural, mechanical, and operational domains. All professionals view the same data, interpret the same model, and collaborate through a synchronized digital platform.
By enabling continuous communication, the tool not only enhances maintenance and safety but also redefines the role of architects and engineers after construction. Architects gain insight into how their design performs in real-world conditions, learning how materials age, how users occupy space, and how environmental factors interact with the building’s form. Engineers, in turn, benefit from precise system-level feedback that allows for predictive maintenance rather than reactive repair. Facility managers gain a comprehensive command of building health, reducing long-term costs and improving reliability.
Most importantly, this tool shifts BIM from a design-stage representation to an active, evolving digital companion. It closes the historical divide between drawing and building, allowing digital models to finally accompany architecture throughout its entire lifespan. By merging real-time sensing, AI interpretation, and holographic visualization, our tool creates a new paradigm of interdisciplinary coordination, one where buildings can speak, professionals can respond collaboratively, and design does not end at completion but continues as an ongoing dialogue with the built environment.
