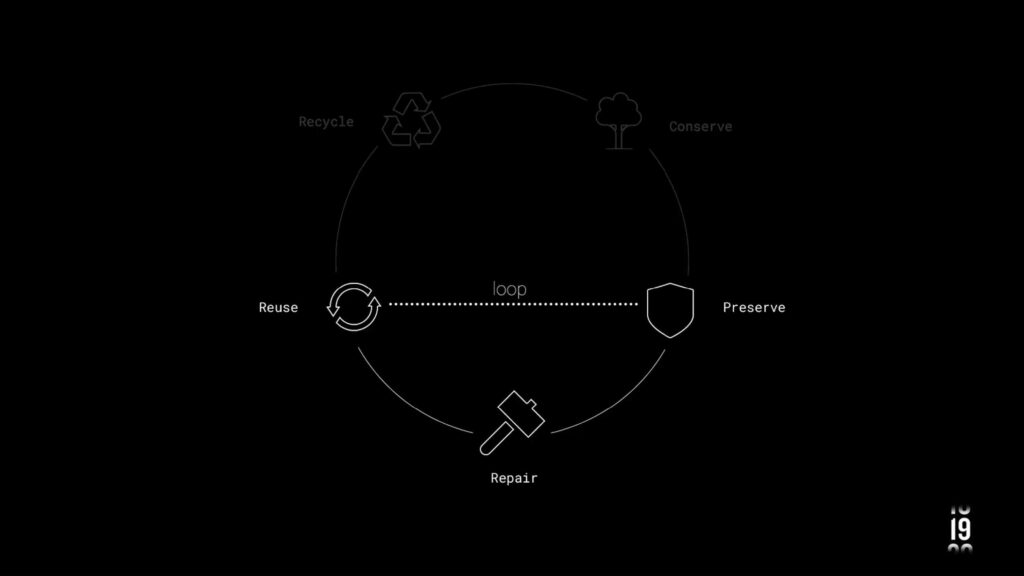
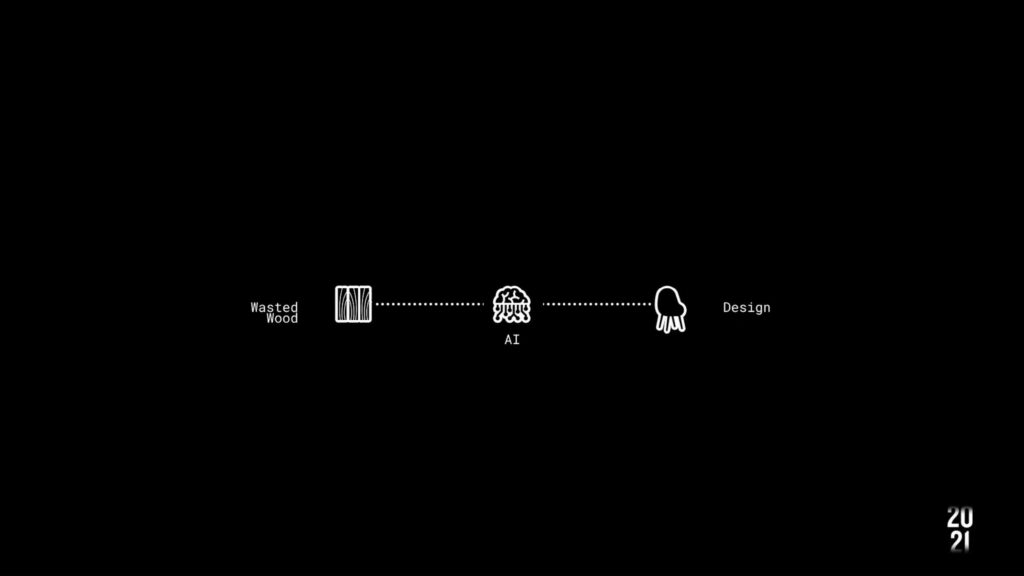
WoodID is a revolutionary project aiming to transform the utilization and reutilization of wood in the industry. Leveraging artificial intelligence (AI) technology, WoodID targets to enhance the circular model of reutilization by operating within a smaller loop, converting wood into various useful products.
The WoodID process commenced with gathering industry insights from Barcelona related to wood, serving as valuable guidance for methodology development. This methodology is delineated into a four-step chain, meticulously defined using extracted guidelines. Steps encompass guideline definition, nesting design modification, dataset collection, and nesting detection utilizing AI algorithms like YOLO and U2Net.
Complementing this process, WoodID employs heuristic techniques for result optimization. This approach integrates constant values such as K – 2 from prior container packing research, enhancing project efficiency and precision.
Data classification stands as a pivotal aspect of WoodID. Different datasets categorize wood by species, type, and defects identification. This precise classification is essential to ensure quality and sustainability throughout all process stages.
Additionally, WoodID benefits from mapping and design technology to streamline the nesting process. Incorporating two additional layers for Warping and Remapping into the U2Net implementation further specialized data, resulting in significant performance improvements.

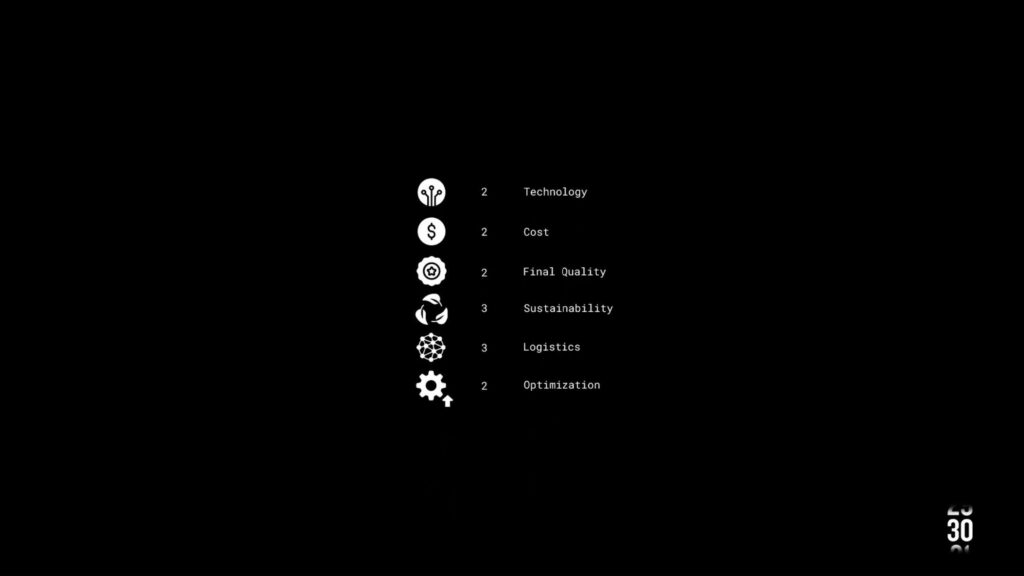
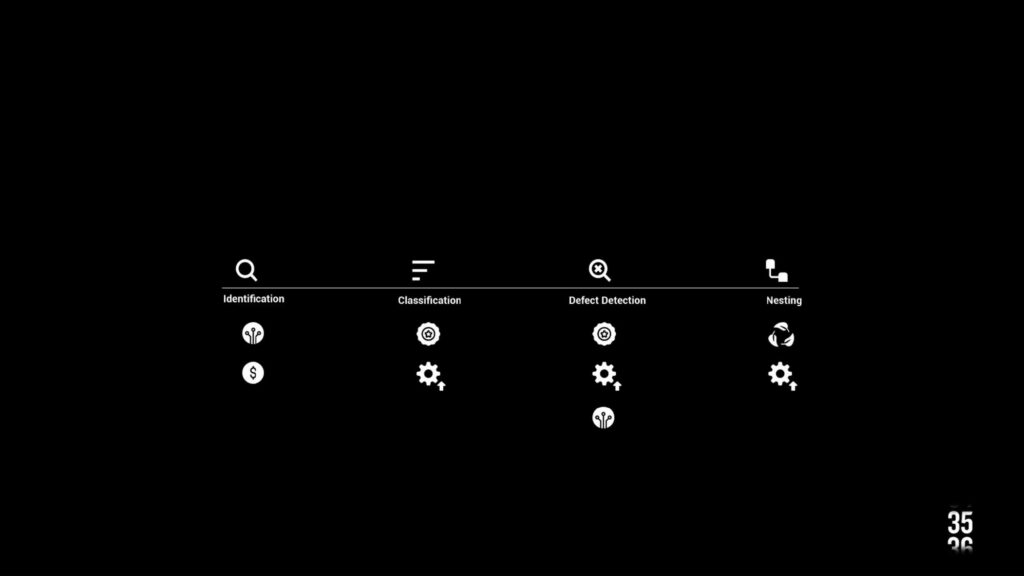
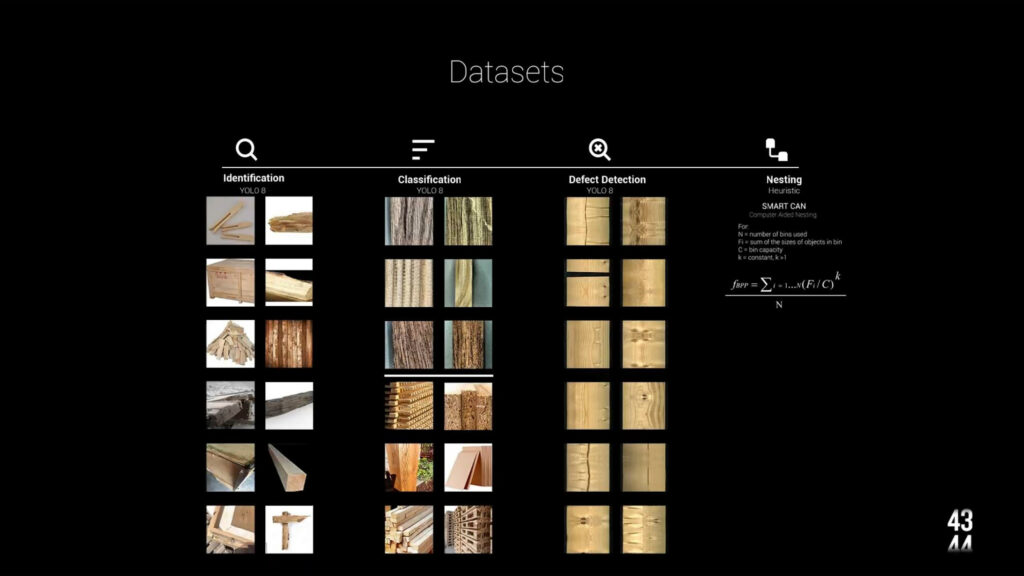
TERM. 02

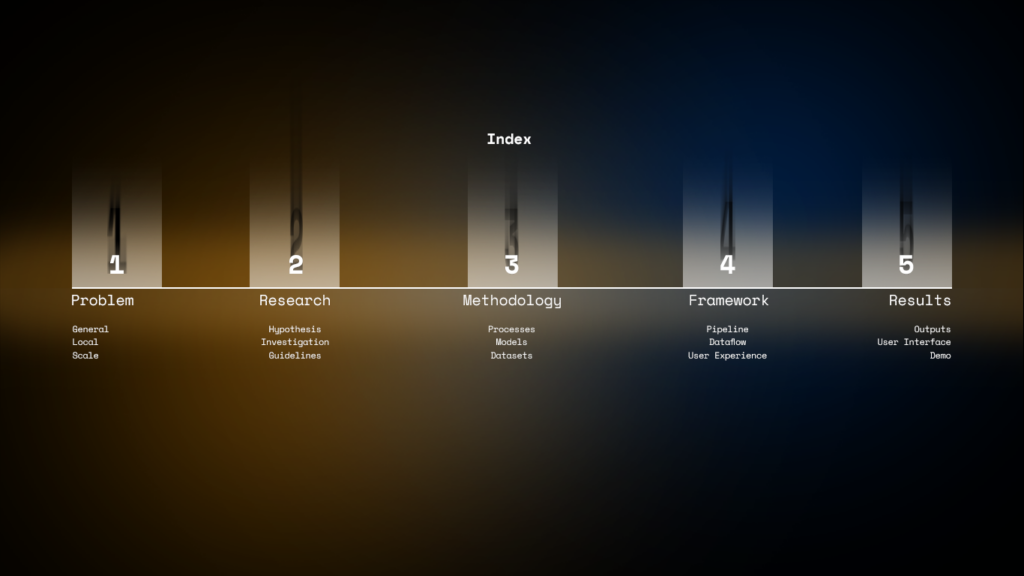
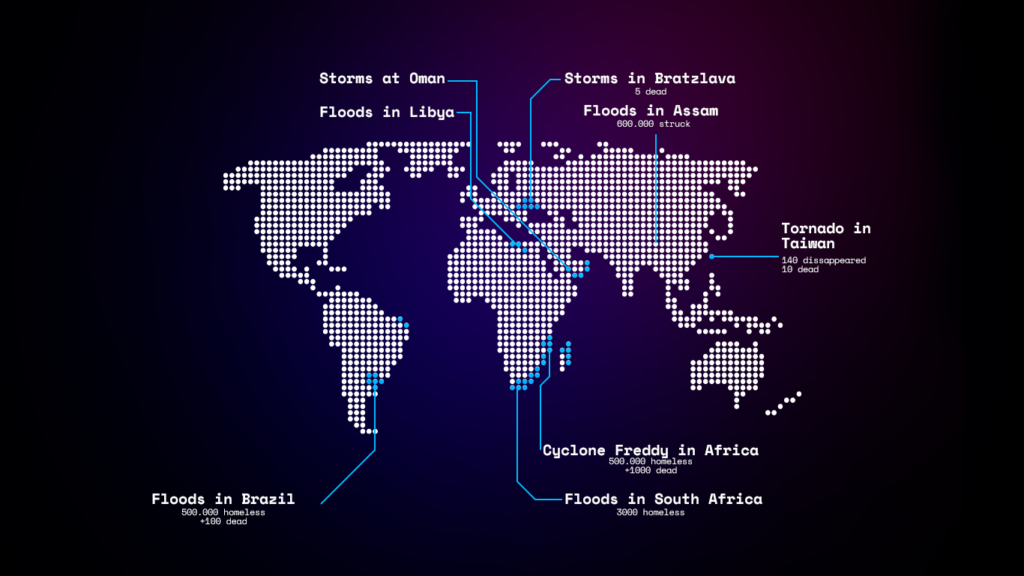
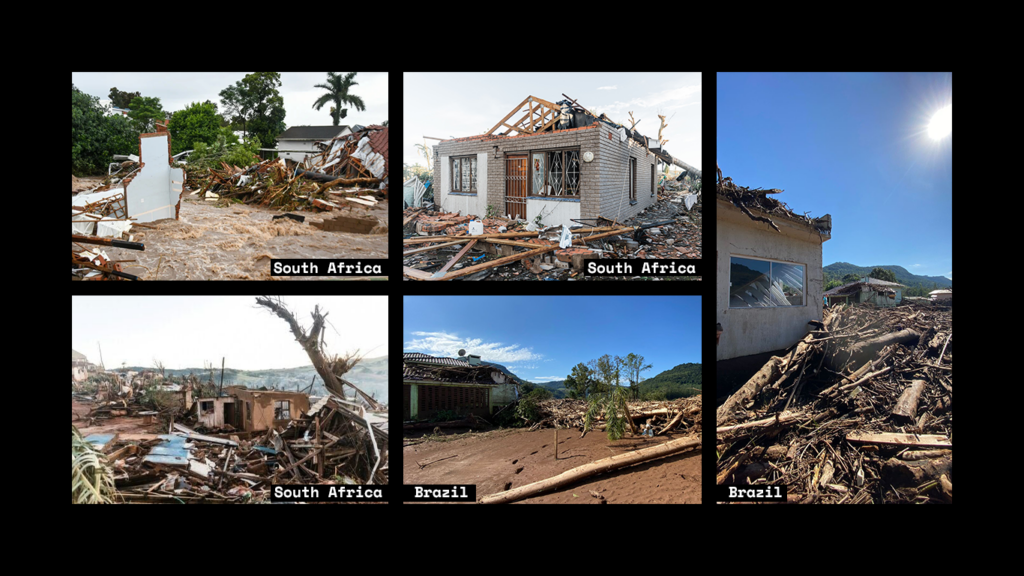
During the course of the 2nd term, a new demand was assessed and tackled: Which was adapting the tool for leveraging emergency environments. Such a demand was largely, a response for the floods that were taking place in different places and different times.
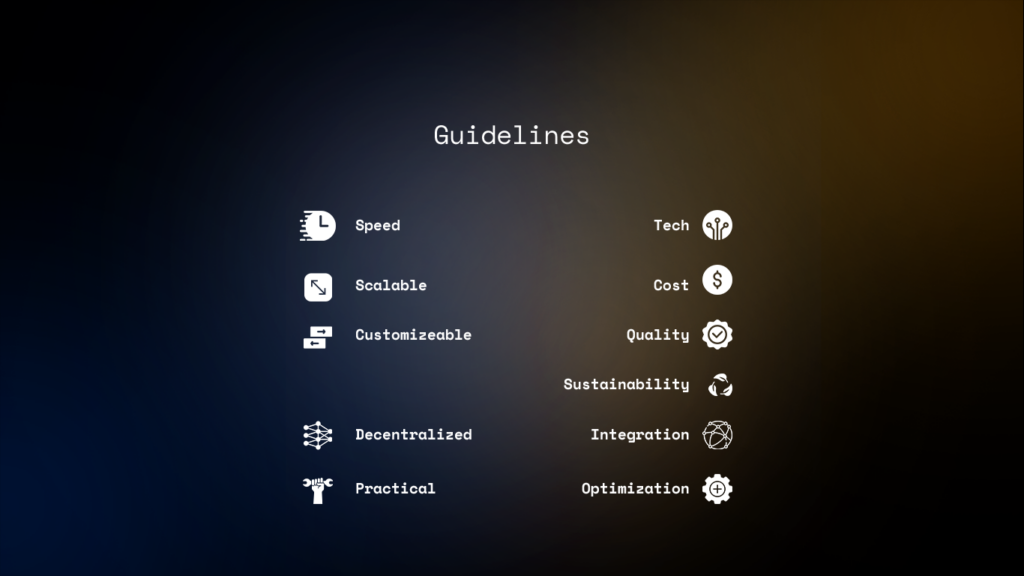
We traced the following sequence dealing in a specific while expansive approach – basing them off of those said guidelines. Each one of them has its own MODEL.
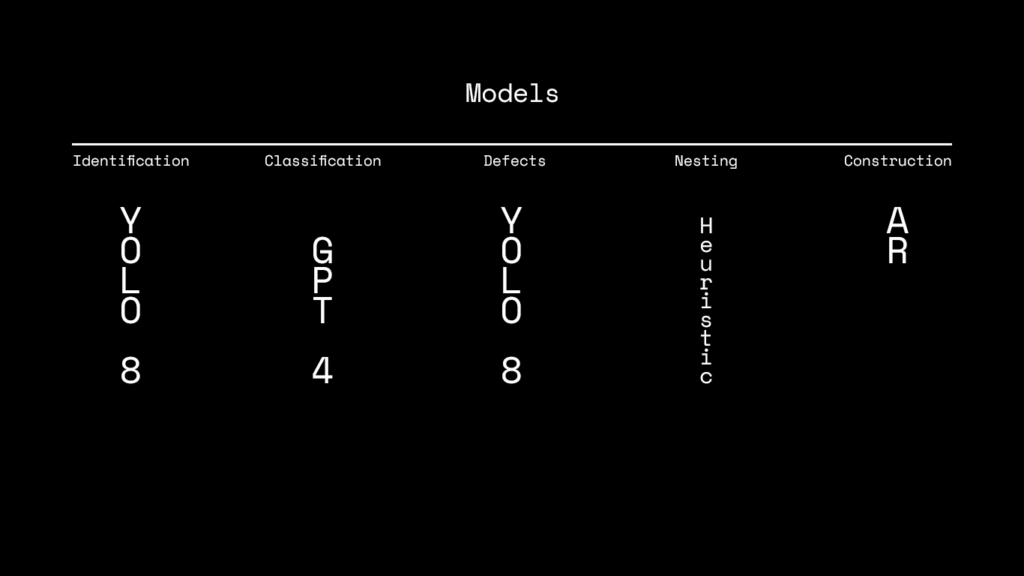
And, when we talk about models we talk about DATA right?
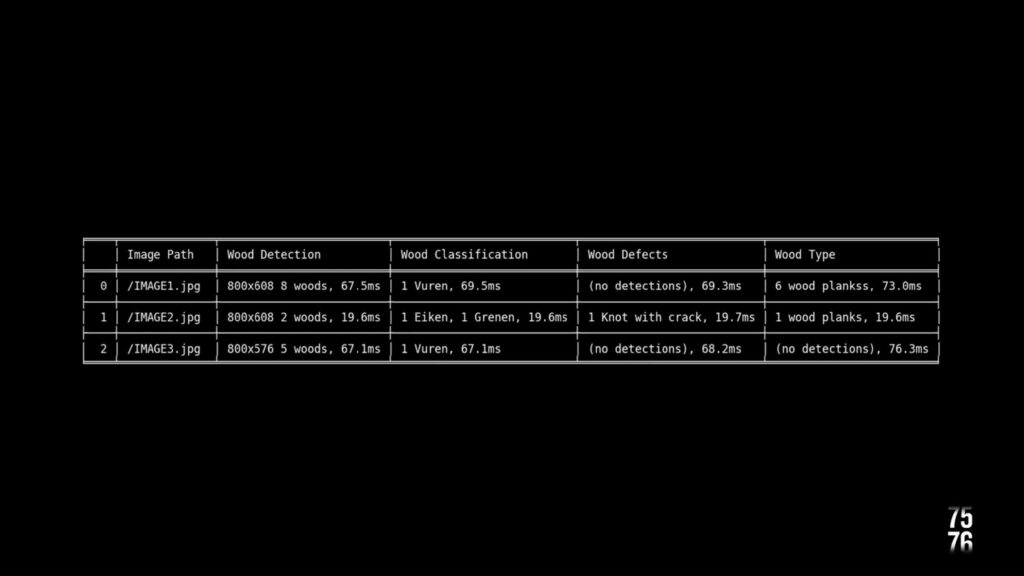
We are using 2 local datasets for identifying the wood and its defects. For the type classification though, we went with a GPT 4 API. The Nesting runs with a HEURISTIC algorithm which is akin to the ones used in industry today. And finally, for the construction we developed the modular structure you guys can see right there by optimizing 5 different options out of galapagos and Karamba
So how do we do that?
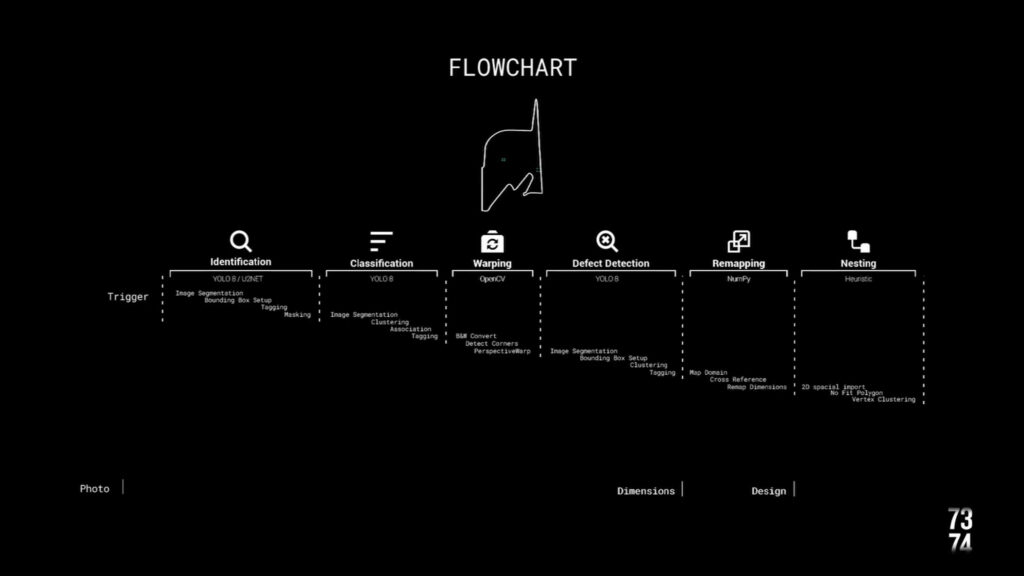
Due to the different types of data in there, we were required adding new processes.
Warping
Mapping
From there, we just need a picture as an INPUT.
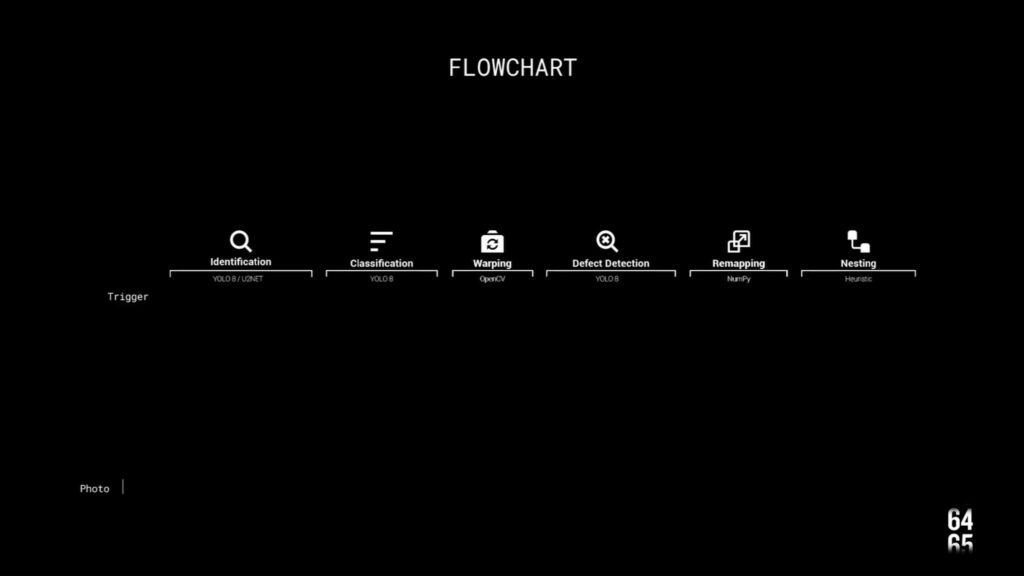
The following cascade diagram is the complete pseudocode for the processes and it goes from IDENTIFYING the wood. CLASSIFYING the type, WARPING perspective, DETECTING DEFECTS, REMAPING DIMENSIONS, NESTING the designs and, last but not least, DISPLAYING it all.
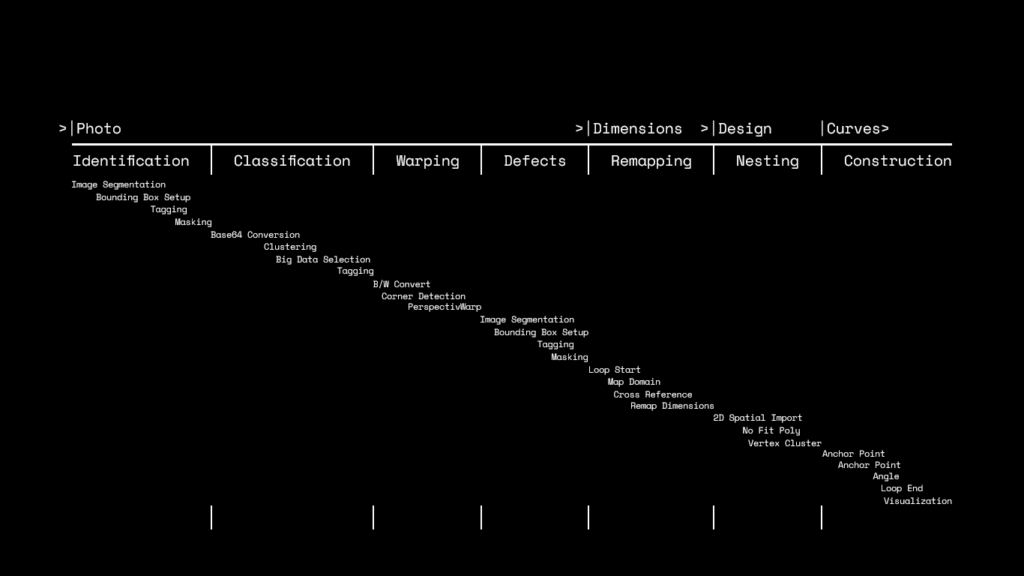
So lets give a fast flythrough arround everything thats going on:
The user sees wood
First cv model Ids and masks it
Than it base64 converts the file and it crosses the data on GPT4 – as we had better results there than with smaller, local, datasets.
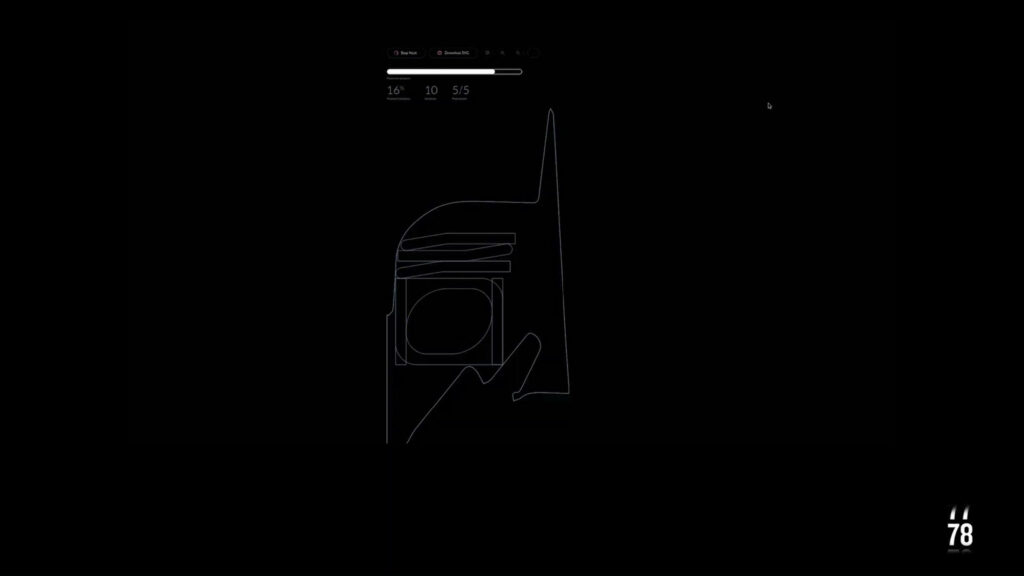
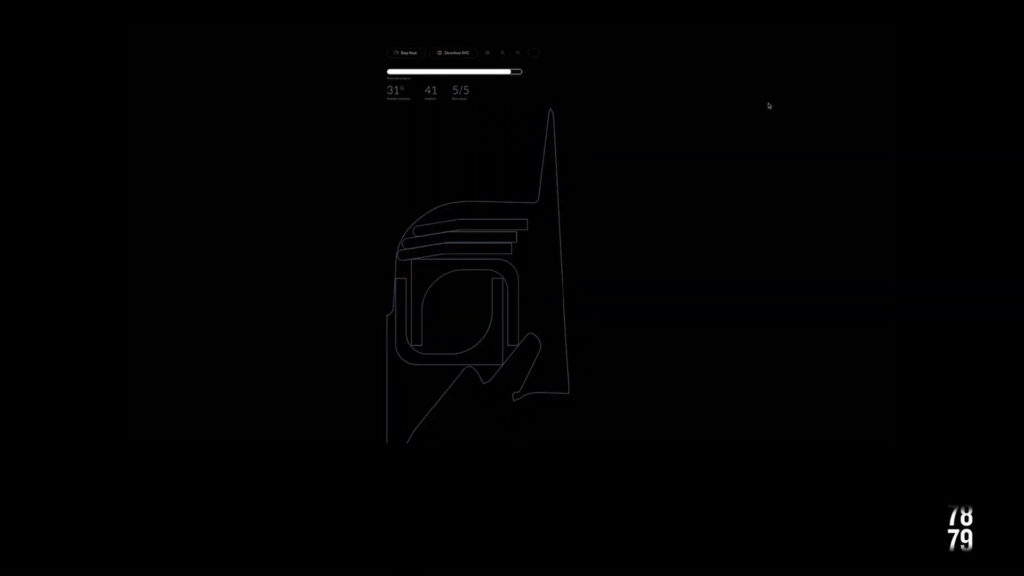
The 2nd cv scans from defects and, over that mask, the nesting can happen. For the nesting we are using a bin set up in a priorities system by size, so that its nests the larger pieces first and the smaller later.
The said pieces are fom the EMERGENCY SHELTERS we designed by using the UN RECOMENDATIONS. Each module is a housing for up to 2 people and a workstation.
Our output is then a CSV that converts into vertex coordinates for polylines. We recommend using a CNC but, in emmergencies? Cant really do that right?
So we worked a little more over the OUTPUT and we would like to review it with u on the perspective of the user.
Capture or upload a picture of wood.
Upload your design or use one of our mockups
While it loads I would like to point out the interface you see is a work in progress
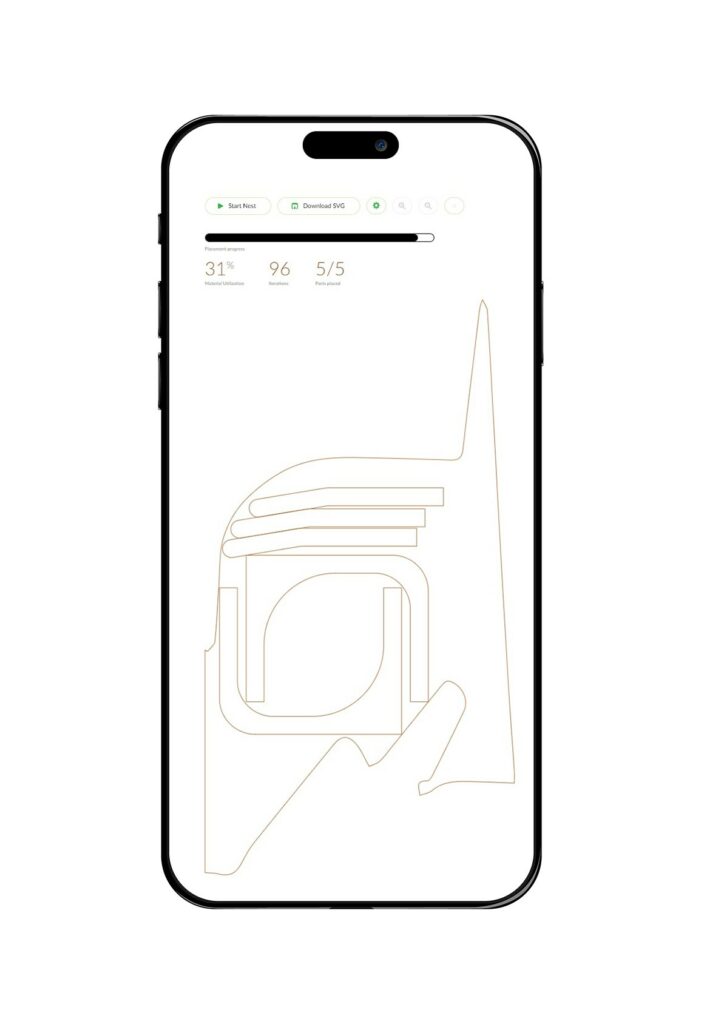
Up there u can see the progress of the algorithms as they run through the steps, until
Youre transfered to Fologram interface where the loop can happen. The optical scale process is how we can, then, gather the dimensions as the last input for the nesting – which is fully responsive and constantly re running.
The complete presentation can be watched in our final video:

