
Unpacking the flood crisis
By exploring the whys
why:
floods? now? Asia? India? Urban India? Mumbai?
Floods: From 1920 to 2020, out of total 15,406 natural disasters, hydrological disasters have been the highest accounting for 42%, amongst which floods have the highest percentage of 34.8%.Now: In the last two decades the rate of increase in hydrological and meteorological is substantial in all the continents from a maximum count of 1 in 1920 to a maximum count of 800.Asia:In addition, the trend shows that the number of disasters in the Asian continent is more than the other four continents in terms or hydrological and geophysical disasters (Palanbek Yavas, Baysan,& Önal, 2022).India is the second most affected country in Asia as in India’s 10 most populous cities 35% of new urban development from 2000-2015 within 20km of city center radius has been on low lying, vegetated , high rechange potential zones. Urban India: . As per study, for every 1% increase in impervious surface area there is a 3.3% increase in urban flood magnitude and in these cities Built-up cover has increase from between 30% to 412%.Urban flooding causes faster destruction as dense urbanization causes developed catchments, which increases the flood peaks from 1.8 to 8 times and flood volumes by up to 6 times.
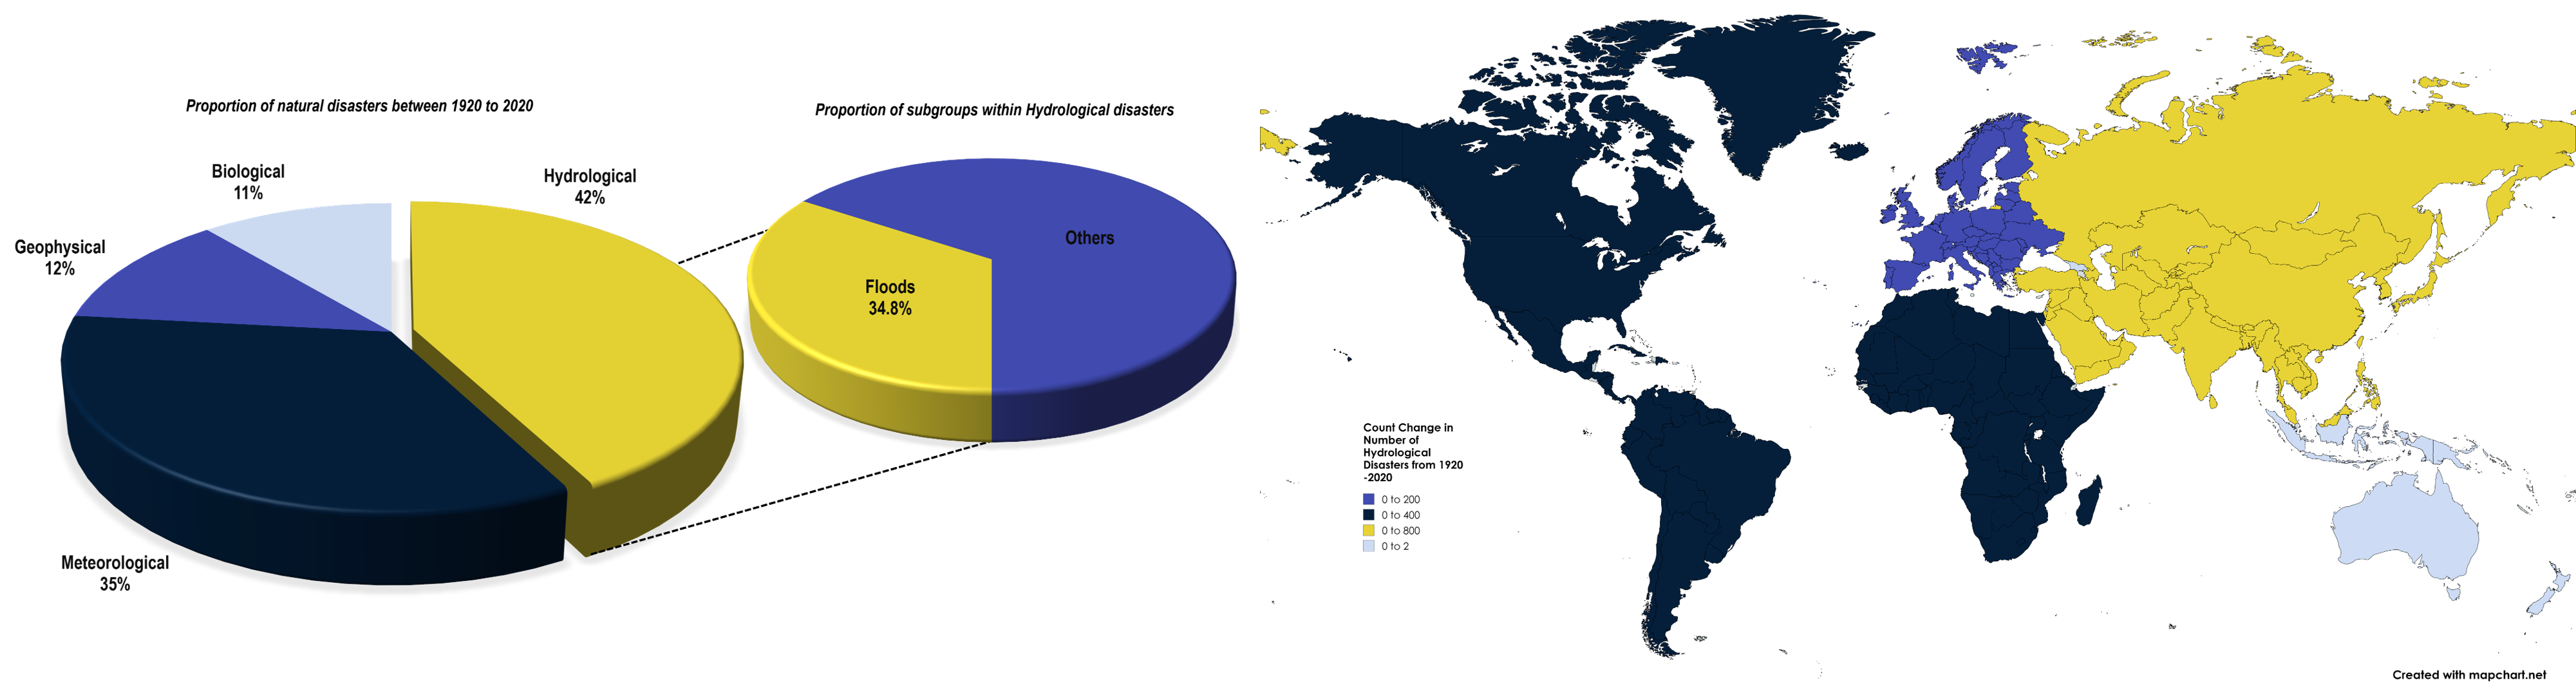
from 1920 – 2020. Made by author.
As per research factors causing floods in Urban India which concur to conditions in Mumbai (Zope, Eldho, & Jothiprakash, 2015)(Sansare & Mhaske, 2020)
- Meteorological Factors such as concentrated heavy rainfall: Average precipitation of 800mm/hour in Mumbai during July.
- Hydrological Factors: Surface runoff is significantly greater than soil infiltration rate due to decrease in pervious surfaces: Mumbai has lost 40% of its mangroves in the past decade and increase in built up land by 59.66% in the last 15 years,
- Anthropogenic Factors: Encroachments on water bodies obstructing the natural flow of water, Mumbai has had 25% of water bodies lost and
- Outdated Grey Infrastructure: Mumbai has an antique drainage system capable of only carrying 25ml of water/hour.
Chosen strategy
Learning from past precedents
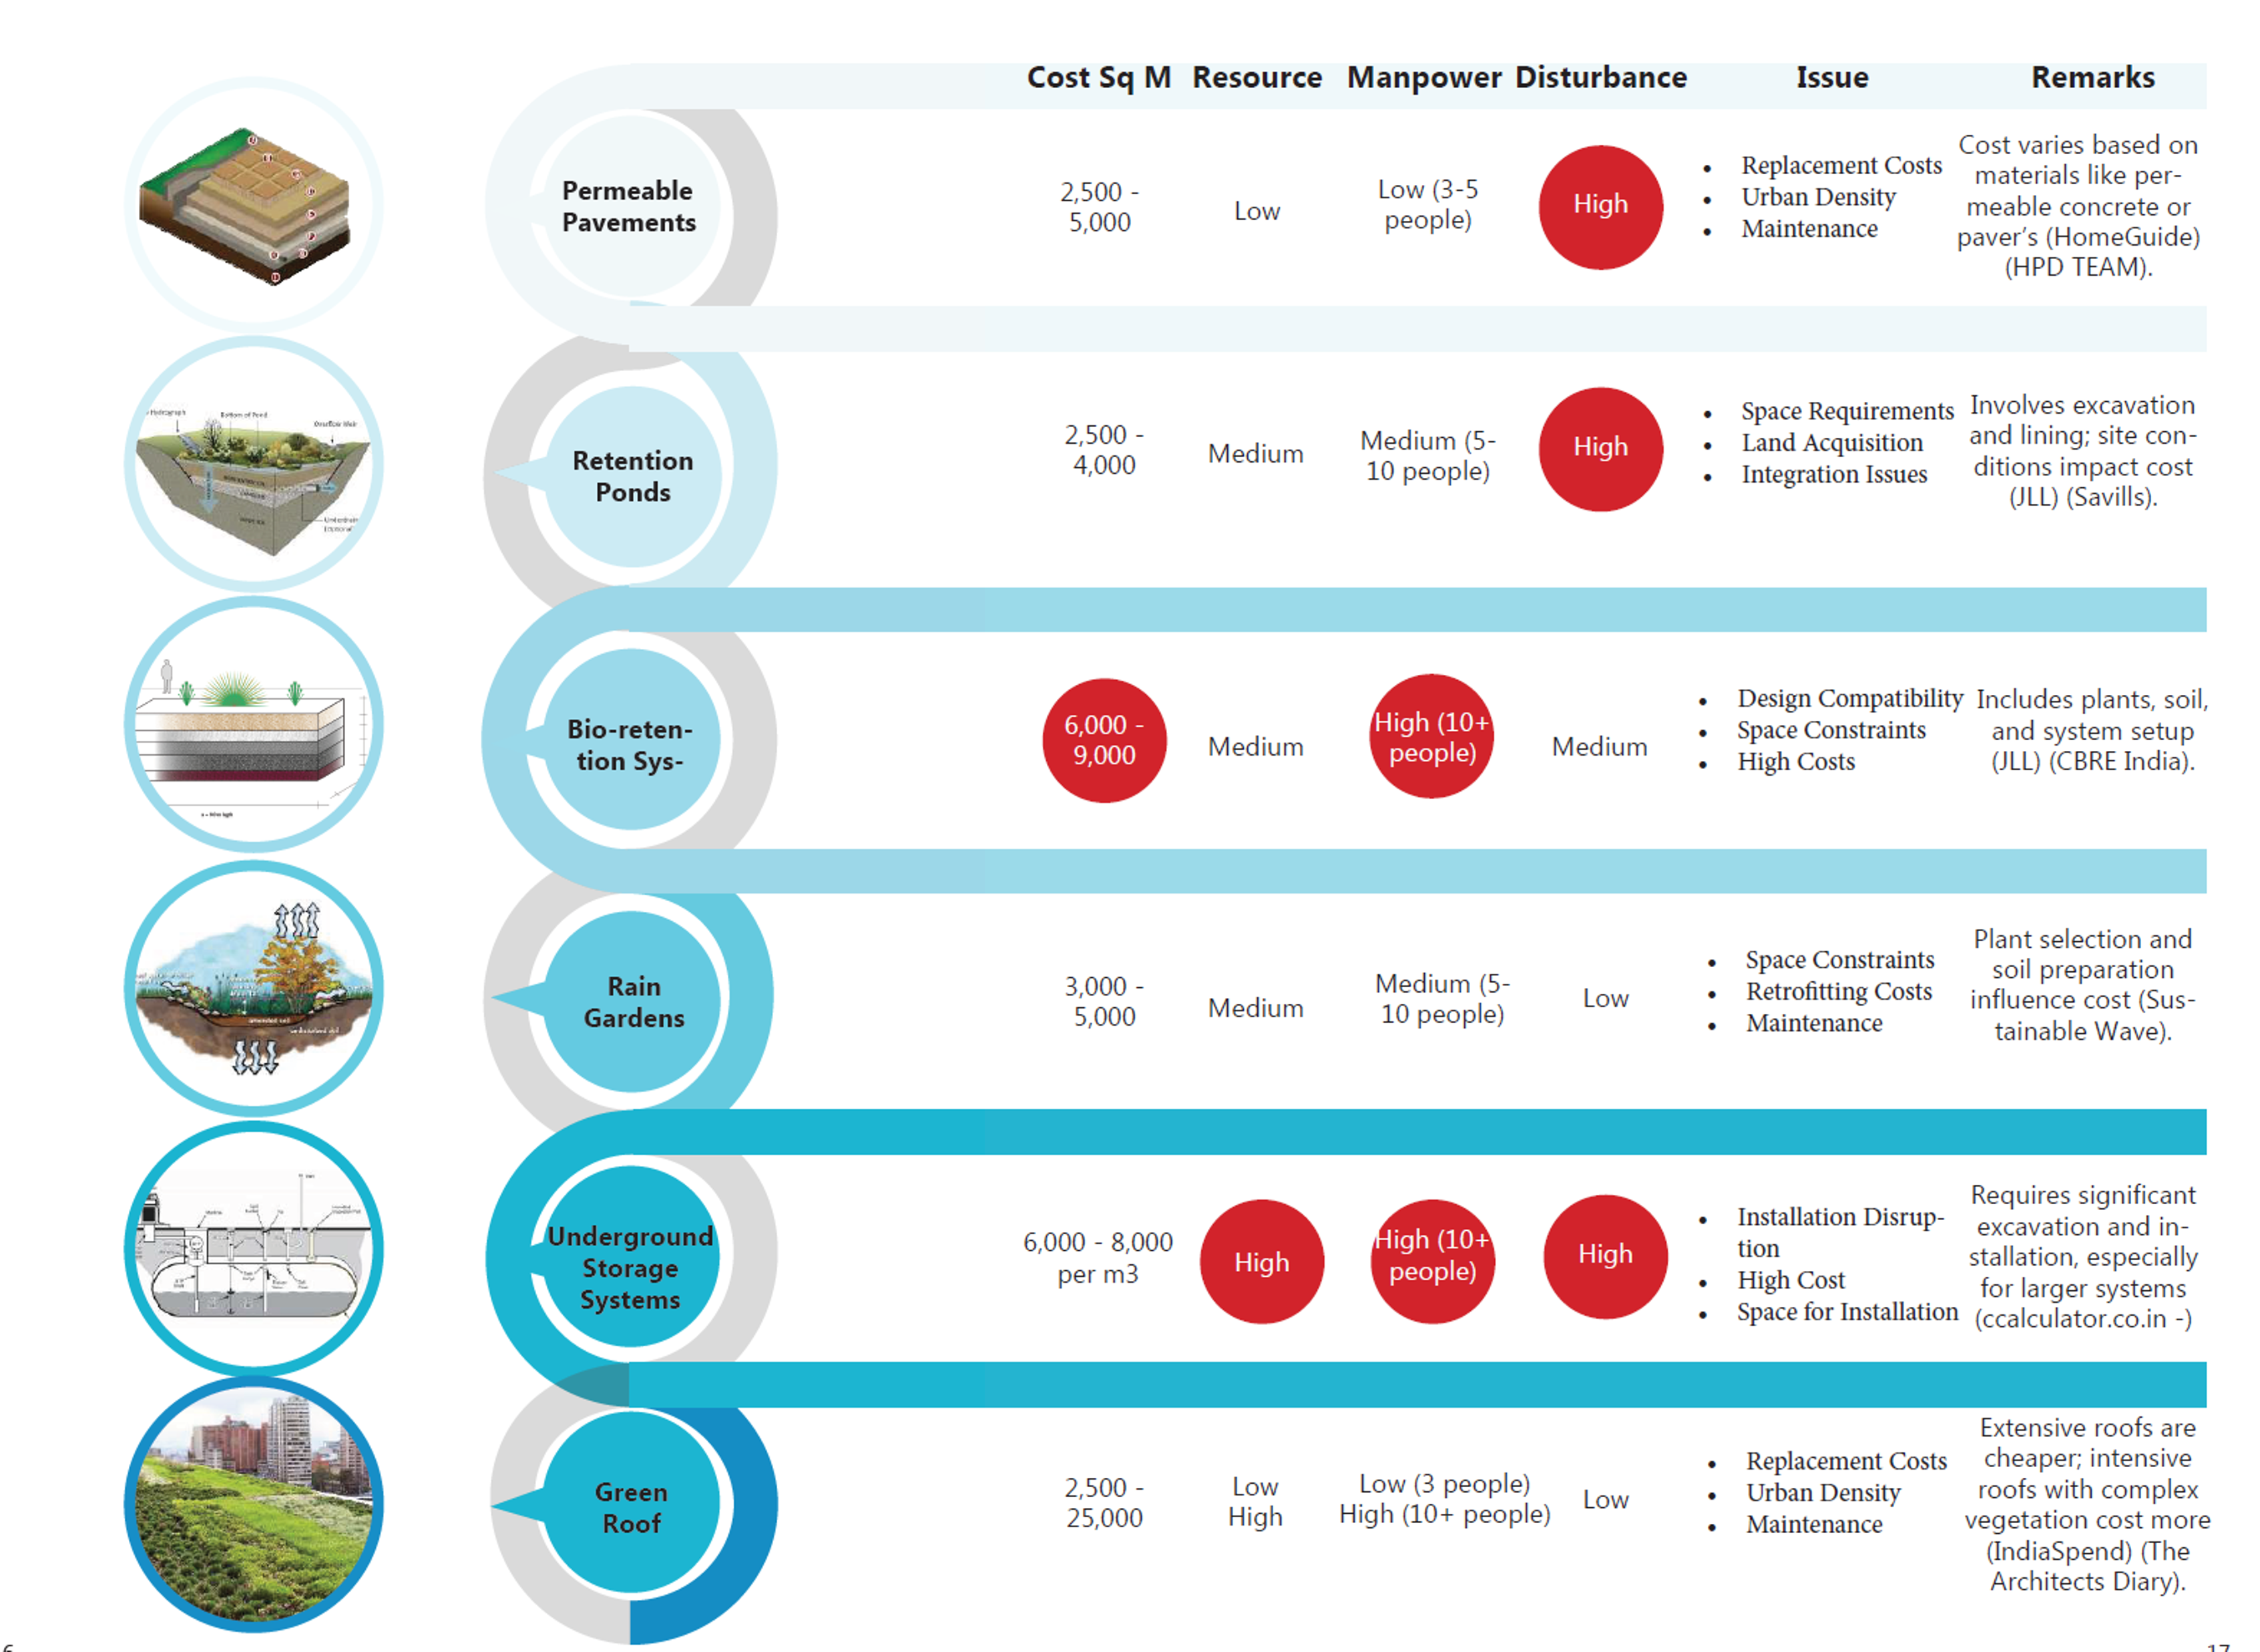
The Sponge City in Wuhan, China was analyzed in which the results indicated that indicated that the best-performing sponge city scenario with a 14.8–46.8% is green roofs (area ratio) + 10% herbaceous basins +10% permeable pavements.
Upon delving into deeper into these systems as seen in Figure 2 green roof had a good balance of all the aspects analyzed thus resulting in the best performing option.
Computational Methodology
Stepped Green Roofs over target regions
The following flowchart (Figure 3) illustrates the methodology adopted for our project hypothesis, the neighborhood region 3D file is developed using Overpass Turbo for the GeoJSON with height modulated as per real case satellite imagery.
Project Scale and Focus Users
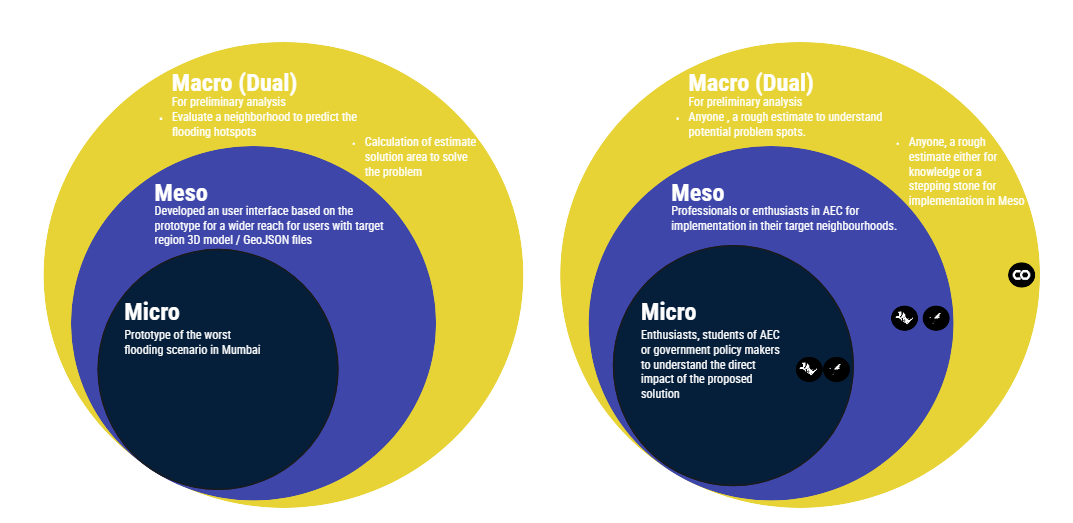
For the micro level a prototype was developed based on the above computational methodology for the worst case scenario in Mumbai, this research would be useful for other urban enthusiasts or government policy makers to understand the direct impact of the proposed solution, seeing the impact it created the scope was then broadened to develop an interface for professionals in AEC industry to evaluate their region and measure impact using either a 3D model of a GEOJSON of their targeted area. The scope was further broadened for dual reasons, first where anyone can evaluate their neighborhood to see where the potential flood hotspots could be and the second being a rough estimate of the green roof required to attain a target surface runoff reduction by differing the input parameters. This is represented in Figure 4
Macro Scale
The macro-scale of this thesis serves two key purposes: first, to provide an estimate of the green roof area required to meet surface runoff reduction targets without the need for a 3D model; and second, to offer an initial benchmark for further optimization in subsequent design stages.
Supervised Machine Learning Model
The urban maps referenced later in Chapter 2 were used as base GeoJSON files for the 1,445 datasets generated. Each locality was subdivided into regions of varying sizes to capture a broad spectrum of urban densities. The wide variation in total ground surface area—ranging from 2.7% to 12%—across flood-prone localities in Mumbai made this approach ideal for dataset creation. The inputs were as follows –
Inputs
- Total Focus region area
- Areas within neighborhoods which the user can focus on, for the dataset generation these points are placed randomly throughout the neighborhood with varying radii to create a fair mix, this is the starting point for other datasets inputs as all of them are relative to this area.
- Total Building Roof Area
- Rainfall per hour
- Green roof percentage and Green roof Area
- Green roof Soil type
Ouput
- Surface Runoff Reduction
Trained Model and Deployment
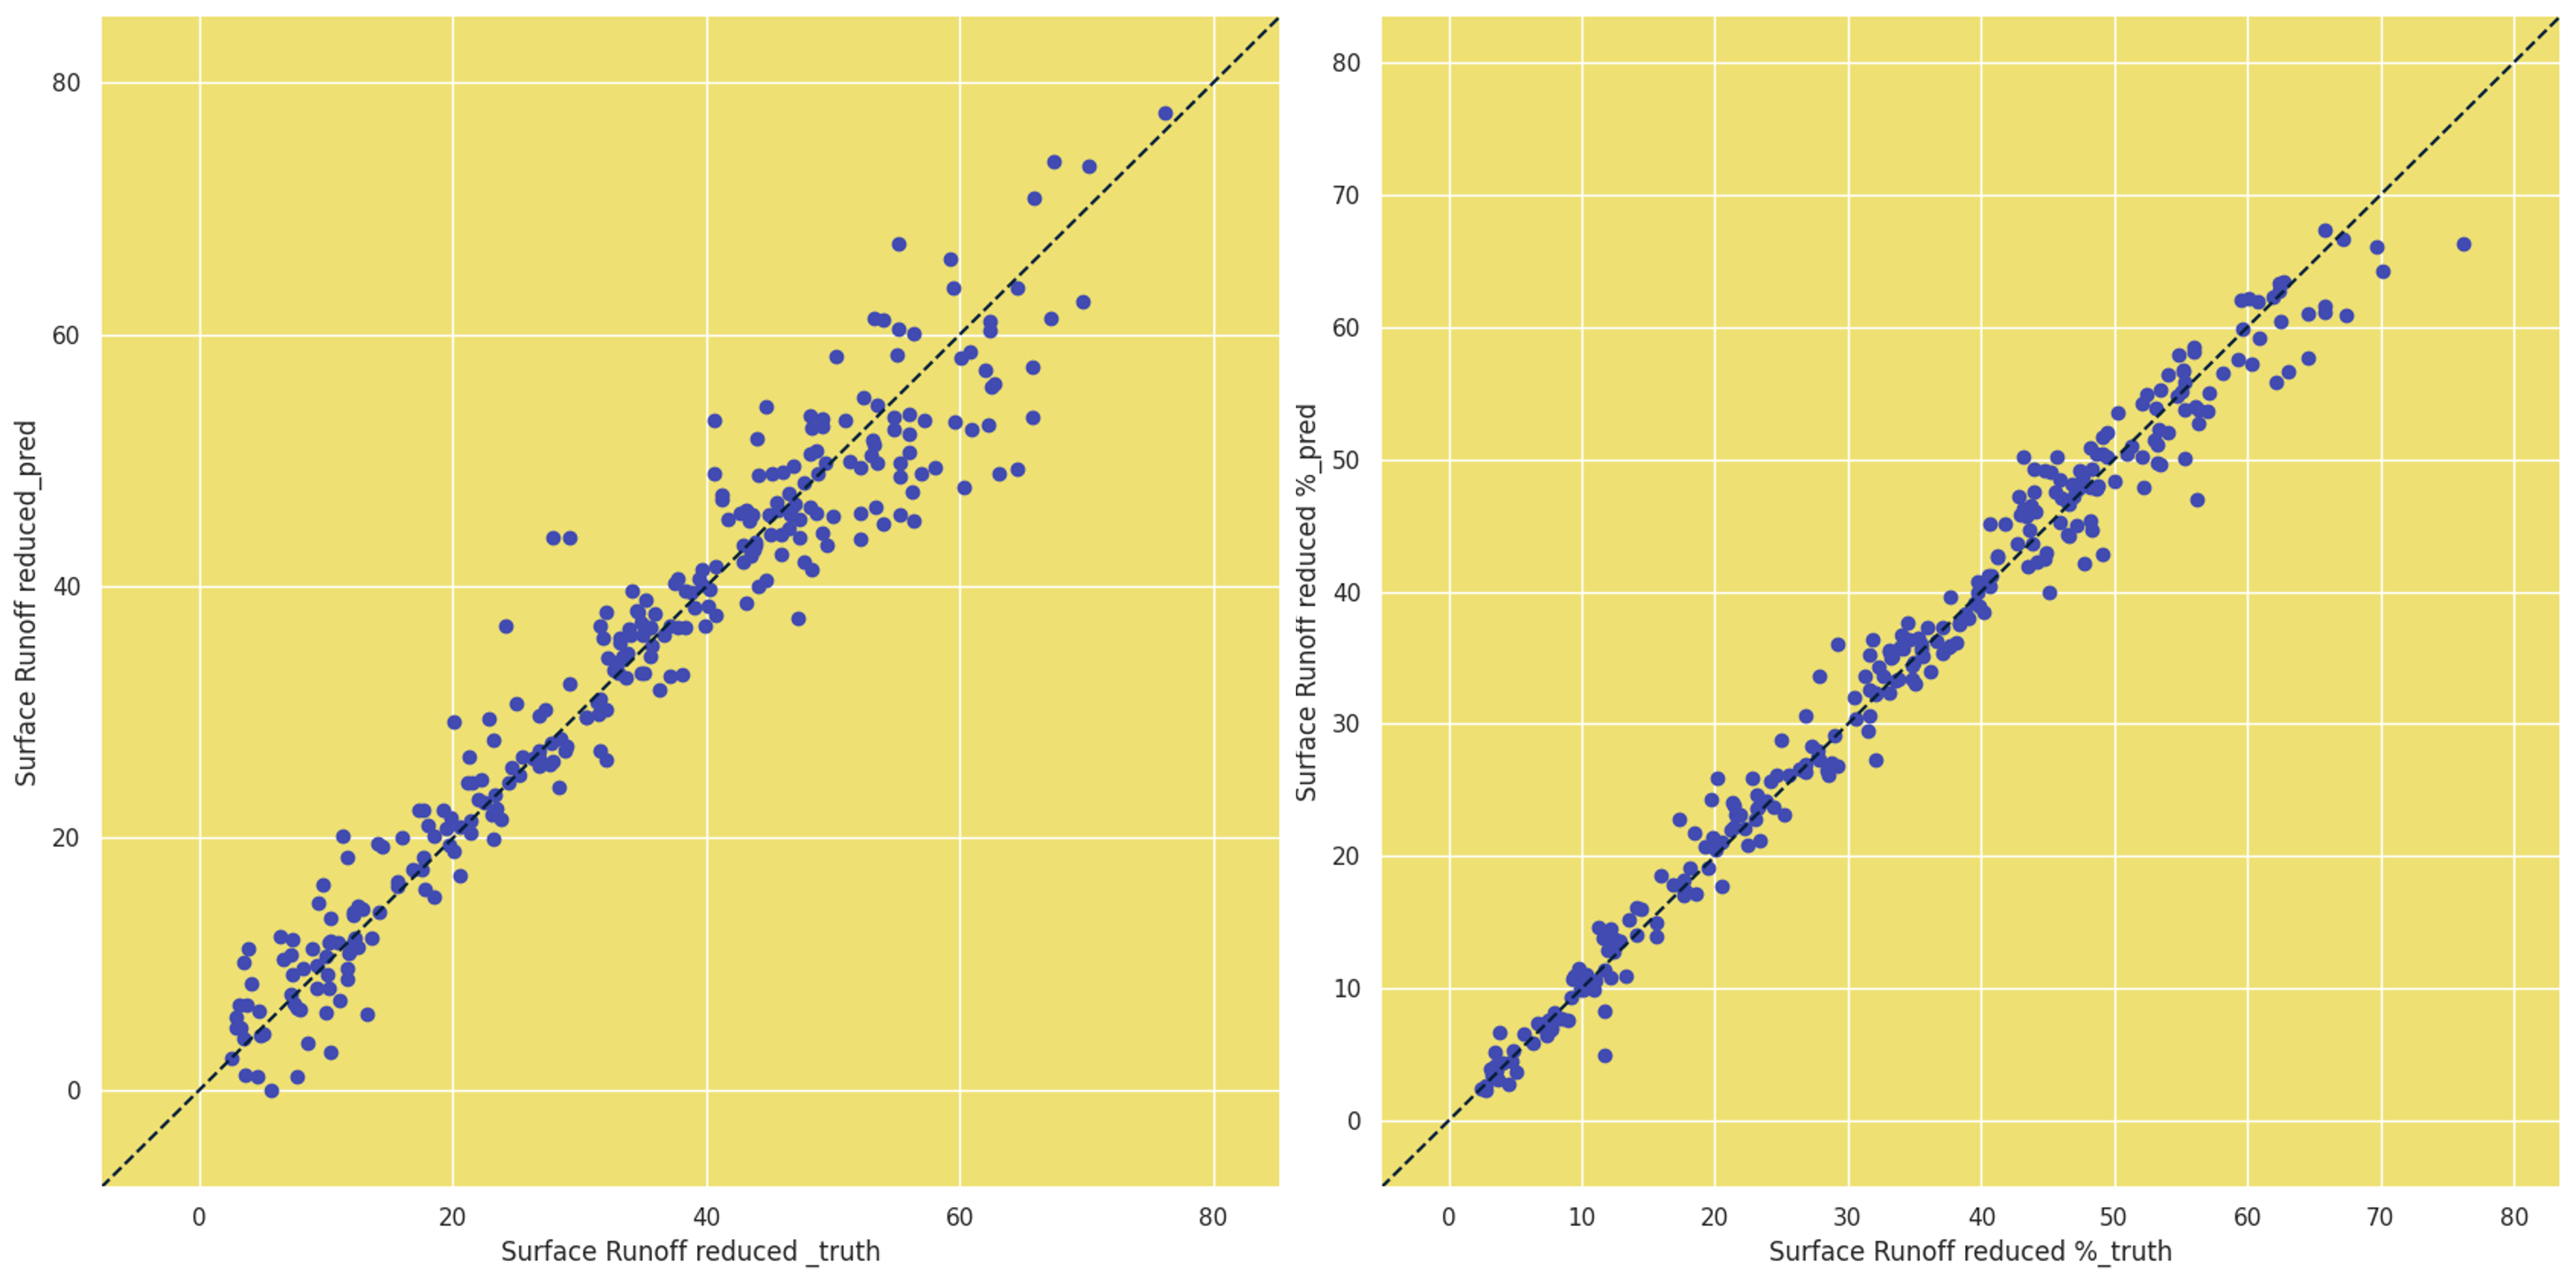
Using a dataset of 1,445 samples, a linear regression model was initially trained with inputs that were label encoded and standard scaled. The model achieved a score of 0.936. Upon plotting the actual versus predicted values, a clear diagonal trend was observed, as shown in Figure 4 (left). To enhance the results, an XGBoost regressor model was subsequently trained, with hyperparameters optimized through grid search. The best hyperparameters included a learning rate of 0.2, a maximum depth of 3, and 300 estimators. This improved the model score to 0.981, with a stronger diagonal trend observed in the graph. Given this improvement, the XGBoost model was selected for deployment in the user interface, which will be discussed further in the primary investigation.
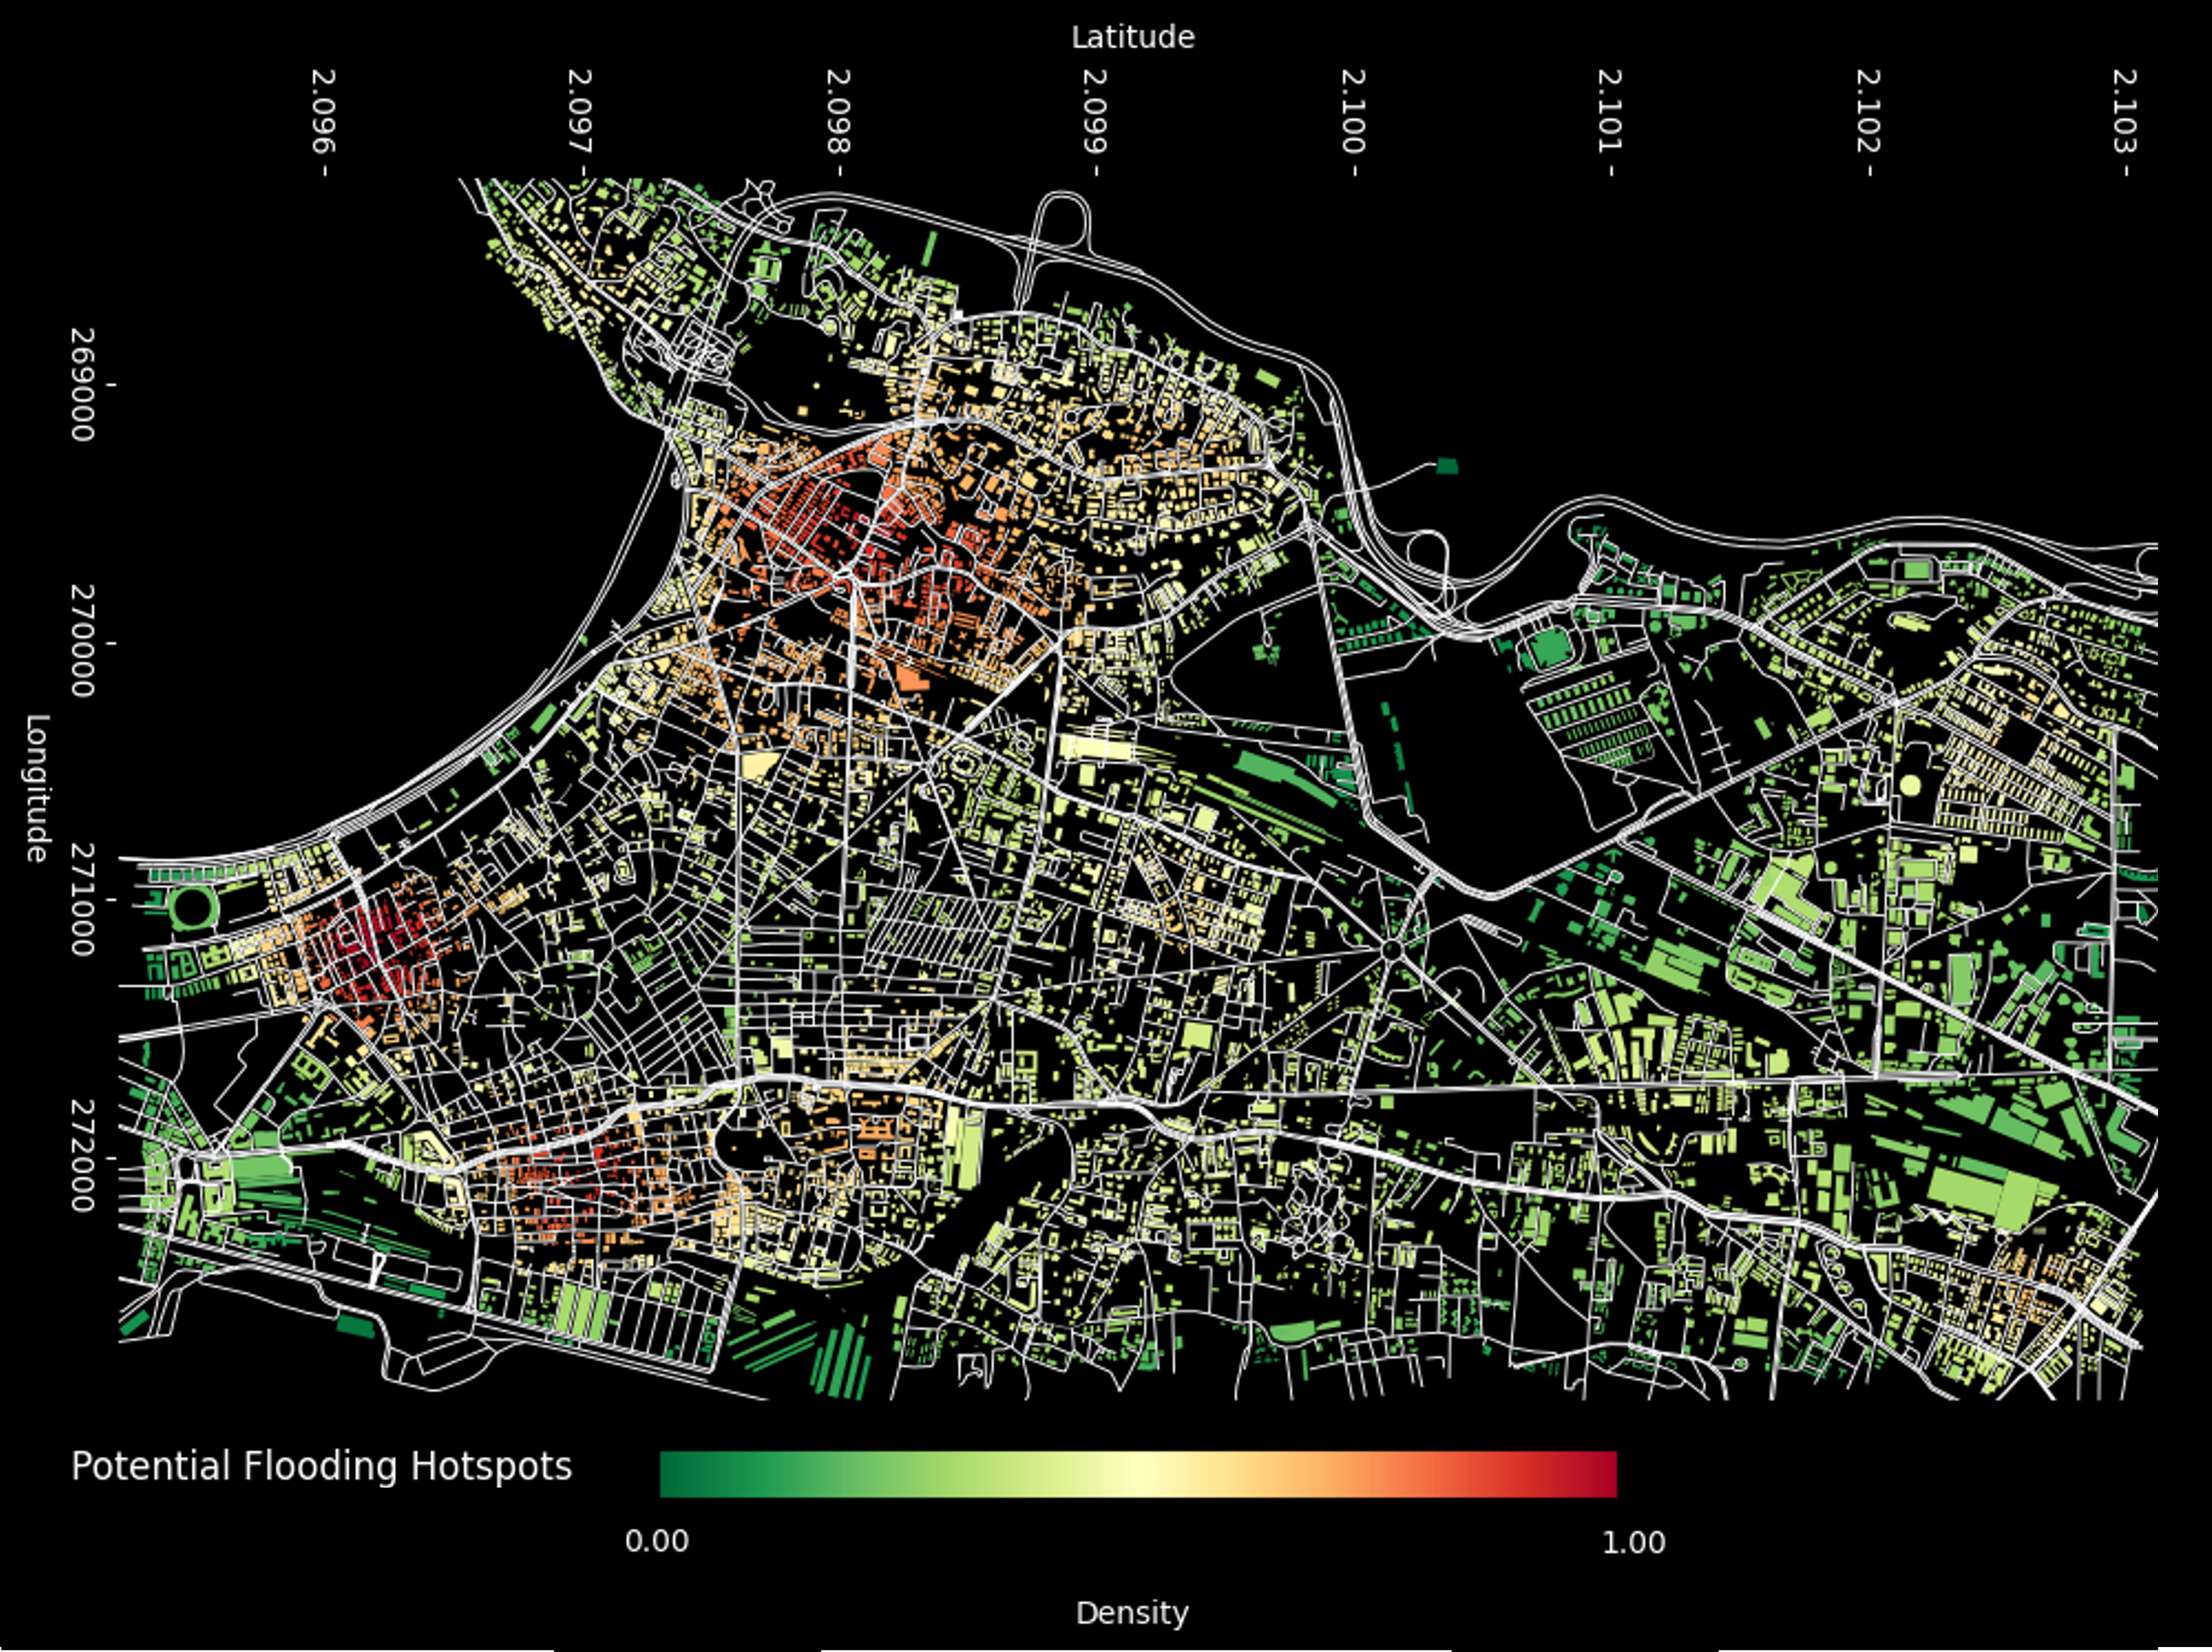
Potential Flooding Hotspots
The Colab file, referenced here and accessible via the interface “Go Micro First,” allows users to upload their selected region’s GeoJSON files, which can be obtained through Overpass Turbo and OpenStreetMap. The file then generates a color-coded flooding hotspot heatmap, highlighting potential flood-prone areas, as illustrated in Figure 5.
Meso Scale
The video below demonstrates the user interface, enabling users to evaluate the green roof area required to achieve a desired percentage of surface runoff reduction within their selected neighborhood radius. Additionally, the interface allows users to specify the height of the stepped green roof based on the structural loading capacity of the roof. It also provides recommendations for suitable plant species based on soil depth and solar radiation levels. Users can either design a customized green roof or utilize a generic roof for their calculations.
Micro Scale
As per historical data, these are the 7 flooding hotspots in Mumbai, we delved deeper into them to understand which might be the worst in terms of different urban criteria. Using Geopandas we mapped out the other criteria’s rather than just the level of flooding represented in Figure 8, they are listen below with their correlation with surface runooff
- More Built Up Ground Area ∝ Less permeable surface ∝ Increased Surface Runoff
- More total Built Up Area ∝ Higher population density ∝ more stress on older grey infrastructure
- More Green Area ∝ Less surface runoff
- More Street Area ∝ More surface runoff
- More Water Area ∝ Less surface runoff
- As all natural water bodies within the region can act as reservoirs that absorb excess rainwater with their surrounding areas also typically being permeable.
As can be seen from the above illustration where the areas are ranked from the highest to lowest in that particular criteria, Tardeo was chosen as the “best” worst hotspot to test our protype.
Prototype testing
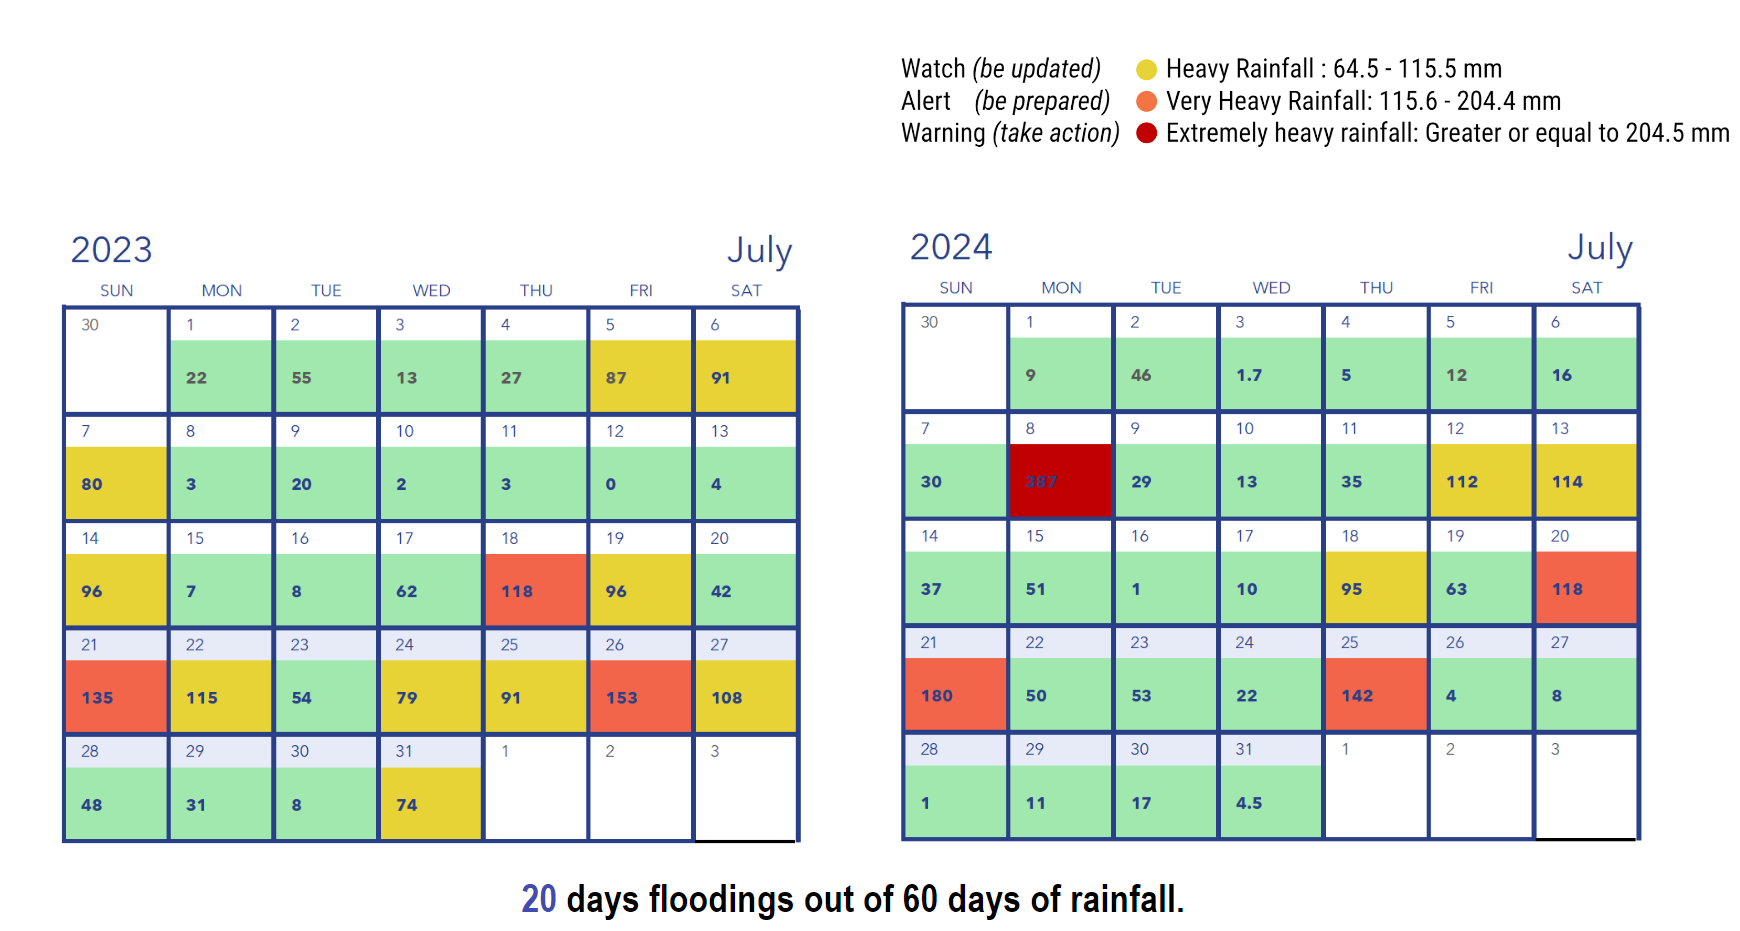
For the reduction of bad days, the rainfall received as per the local weather station was mapped out the coloring in Figure represents the different alerts as per the Mumbai disaster guidelines, though they advise taking action when the rainfall is above 204.5mm, the last time Tardeo flooded rainfall was just 80mm, which means that in the past 2 years, 20 days would have been flooded in the area.
The flooded square Nana Chowk as shown in the figure was taken as the center and evaluated the region area with 500m radius and had the following inputs-
- Total region area: 785398 sqm (500 m radius)
- Total Building Area : 187499 sqm
- Total Green Area: 33234.95 sqm
- Total Street Area: 201410.4 sqm
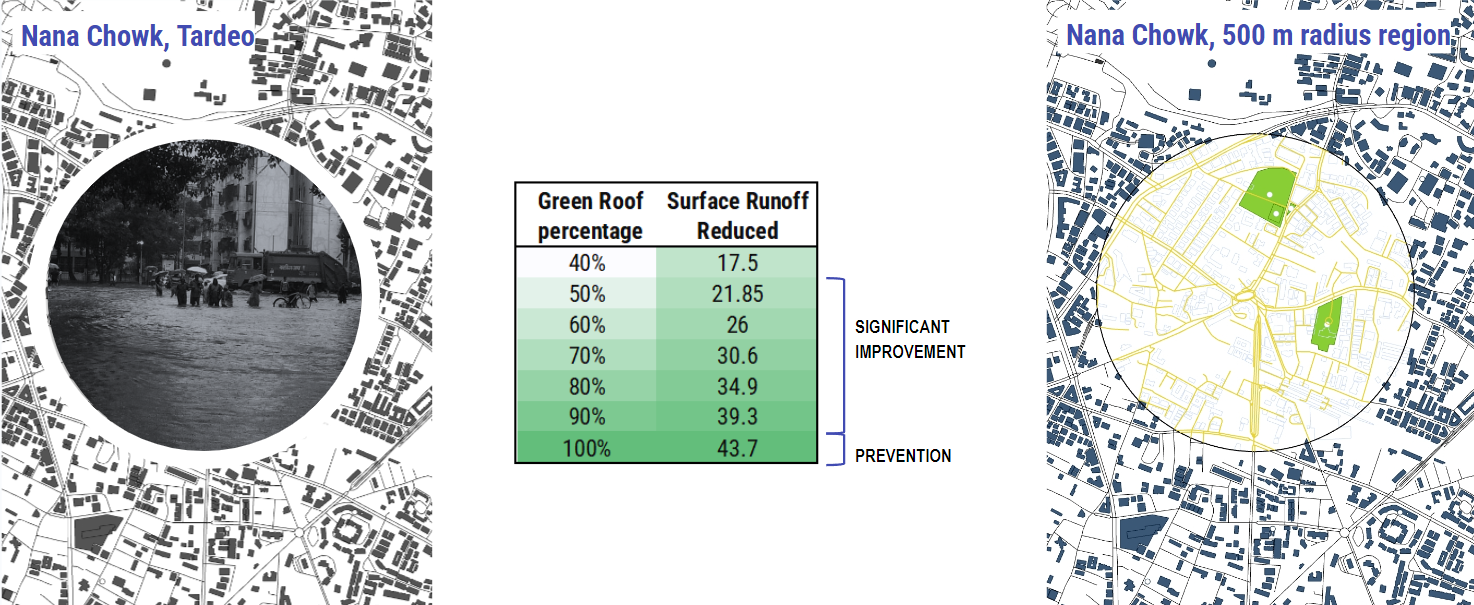
Within the mapped radius, buildings were analyzed with their roof obstructions accurately identified, revealing that different percentages of green roof coverage result in varying levels of surface runoff reduction. Although there is no single definitive value, studies show that a reduction of 20-30% in surface runoff can significantly enhance stormwater management in flood-prone areas. This reduction mitigates the effects of sudden rain events. However, for areas susceptible to frequent flooding, a reduction of 40-50% is considered ideal, as it better manages the rapid influx of water and offers more effective flood prevention.
Conclusion
To effectively prevent flooding in this worst case scenario hotspot, it is evident that achieving complete green roof coverage across all buildings would be an ideal, yet highly ambitious solution. However, recognizing the impracticality of this scenario, the research focus has been expanded to explore alternative avenues. Specifically, the untapped potential of the street areas, which account for 48% of the total neighborhood space. By incorporating these areas into the stormwater management strategy, a more comprehensive approach to flood mitigation can be developed, enhancing the overall resilience of the urban environment.
Future Inclusions
Including an adaptive solution to pitched roofs, expanding from the stepped green roofs on flat roofs, as accessible green roofs or green roofs with soil depth are not feasible for sloping roofs.
For including an adaptive solution to large open street spots like street intersections and crossings, would greatly impact the reduction of runoff through the non-built areas, a preview trial of such a structure computational methodology is shown in figure 5.
Acknowledgments
The successful completion of this study would not have been possible without the invaluable guidance of thesis advisor, German Otto Bodenbender, whose expertise and insights provided critical support throughout this thesis. Deep appreciation is also extended to David Andrés León, the MACAD director, and Laura Ruggeri, the program coordinator, for their steadfast encouragement and assistance. Special thanks are owed to James McBennett for his technical support, and to the entire MACAD faculty and staff for guiding and enriching this journey of knowledge. Their collective contributions have been instrumental in shaping the outcome of this research.
References
Palanbek Yavaş, S., Baysan, C., & Önal, A. E. (2022). Analysis of the natural disasters in the last century and the people who were consequently displaced. Acibadem Universitesi Saglik Bilimleri Dergisi, 13. https://doi.org/10.31067/acusaglik.933268
