#Objective
#A Kaggle Competition to MaCT01 students to show their knowledge, designing an end-to-end machine learning project to predict the “Trip Duration” of NYC Taxi trips.
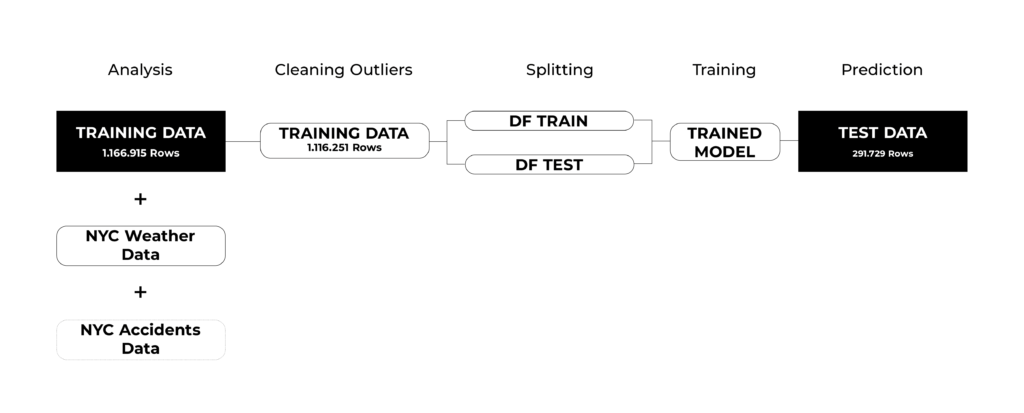
#Workflow
#First of all a workflow hast do be developed, which represents a classic approach for training machine learning models, analysing the provided training data provided by the submission, aswell as additional datasets like the NYC weather dataset or the NYC accidents – all of them represent the first half of the year 2016. After the analysis, we clean the outliers of the datasets, for example there were trips with zero tripduration or the pickup coordinates werre equal to the dropoff coordinates. After that the initial set of training data is split – 20/80 – into a data to train the algorithm, and a testset to validate the prediction model. Once the result with the R2square, which represents the accuracy of the prediction, is satisfying, the algorithm are applied to the provided test dataset to predict the trip durations.
#ANALYSIS
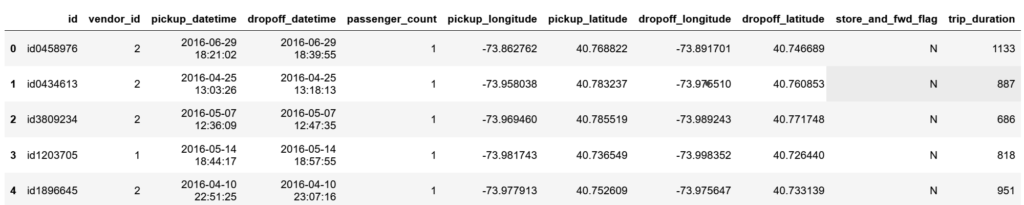
#TRAINING_DATA.head()

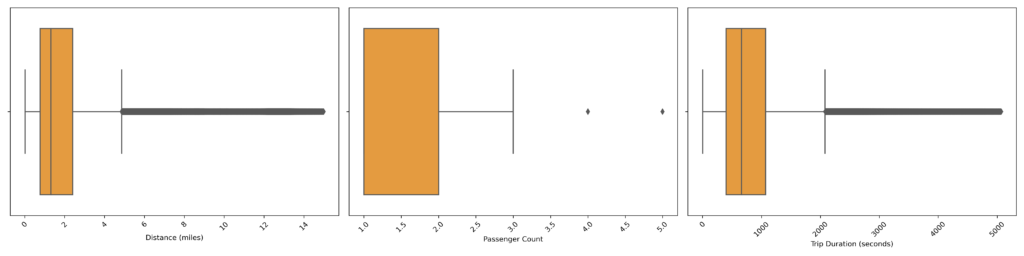
#CLEANING OUTLIERS
#As mentioned above one of the most important steps is to clean the training data for outliers, for example trips with zero tripduration or trips with matching pickup and dropoff coordinates. Also some distances and trip durations were rediculously high and the legal limit for the amount of passengers in NYC is at four persons.
#FEATURE ENGINEERING
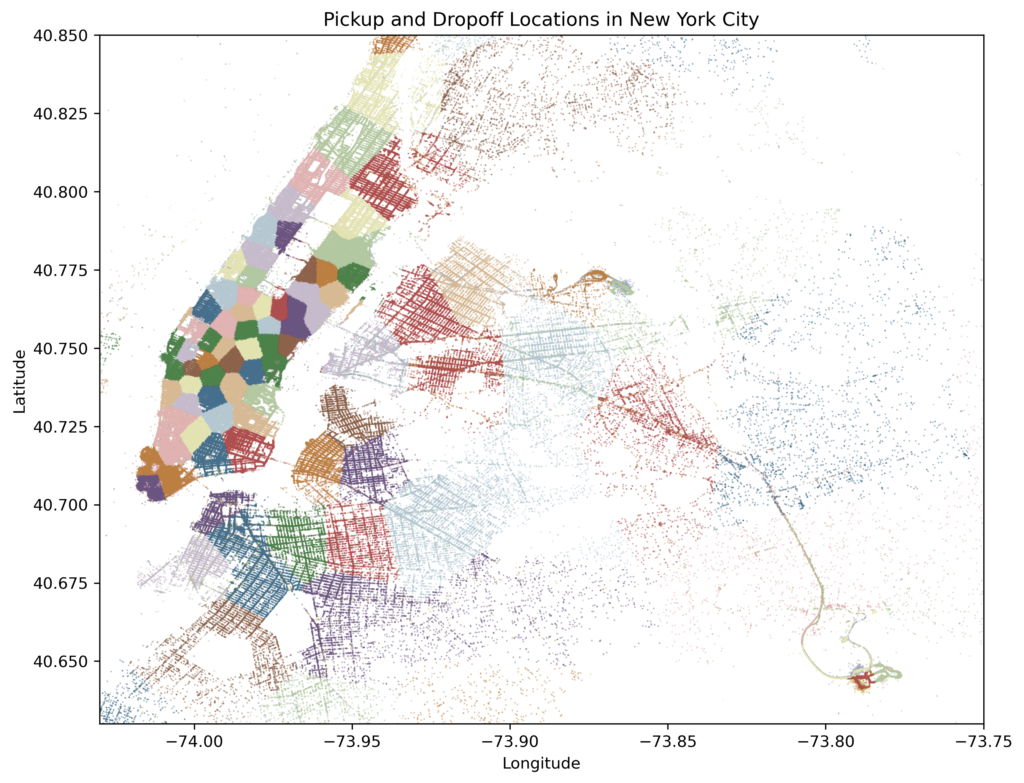
#CLUSTERING
#Clustering [100 clusters] for pickup and dropoff locations by longitude and latitude.
#As longitude and latitude of pickup and dropoff location by themselves don’t add any value for the prediction, the decision was made to create a cluster of 100 for each, pickup and dropoff with the kmeans minibatch.
#TIME
#As the pickup- and dropoff dates in their original format aren’t usefull for the prediction they were disassembled into single numbers. It has to be mentioned that the dropoff dates were not used to train the model as there shouldn’t have been dropoff dates within the final test dataset.
Pickup_datetime [YY-mm-dd-h-m-s]
Pickup_hour [1-24]
Pickup_month [1-12]
Weekday [1-7]
Day_of_year [1-365]
#DISTANCE
#Then the distance between the pickup and dropoff coordinates were added with the haversine formula and the geodesic library – calculating the great circle distance between two points on the earth (specifiead in decimal degrees). Source: https://gis.stackexchange.com/a/56589/15183
#WEATHER DATA
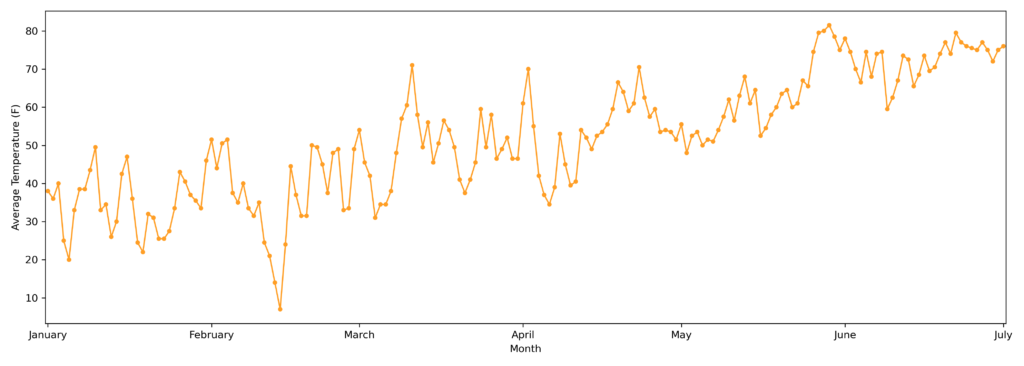
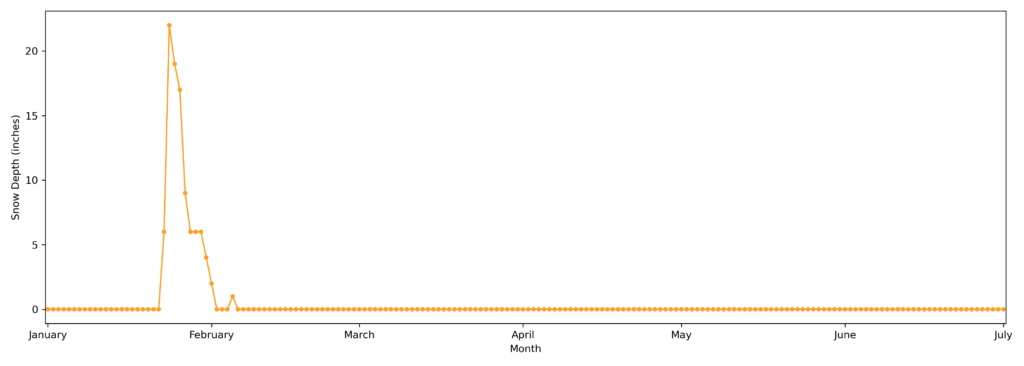
#The weather data for the same timeframe has been added and explored, looking for correlations to the trip duration.
#AVERAGE TEMPERATURE
#SNOW DEPTH
#EXPLORING CORRELATIONS
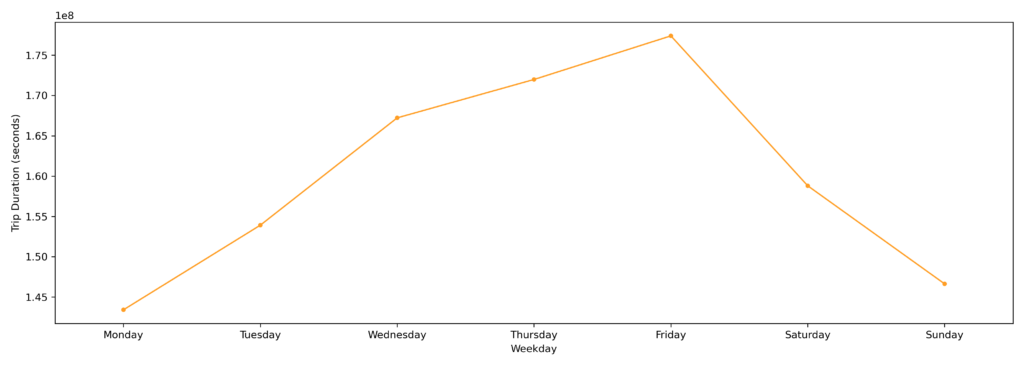
#For choosing the right columns to train the model, the correlations between them and the trip duration were explored and visualized.
#TRIP DURATION PER WEEKDAY
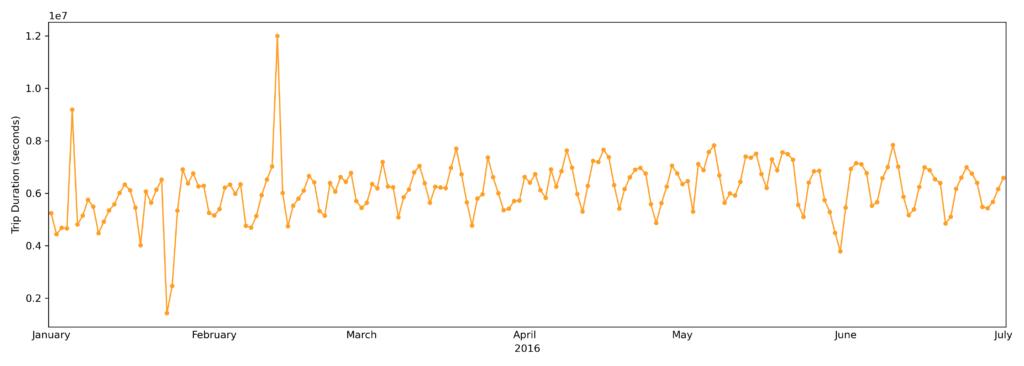
#TRIP DURATION PER DAY
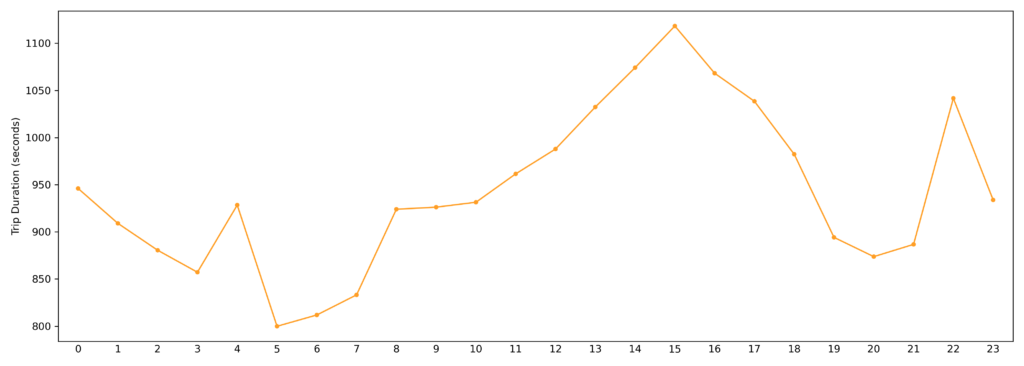
#TRIP DURATION PER PICKUP HOUR
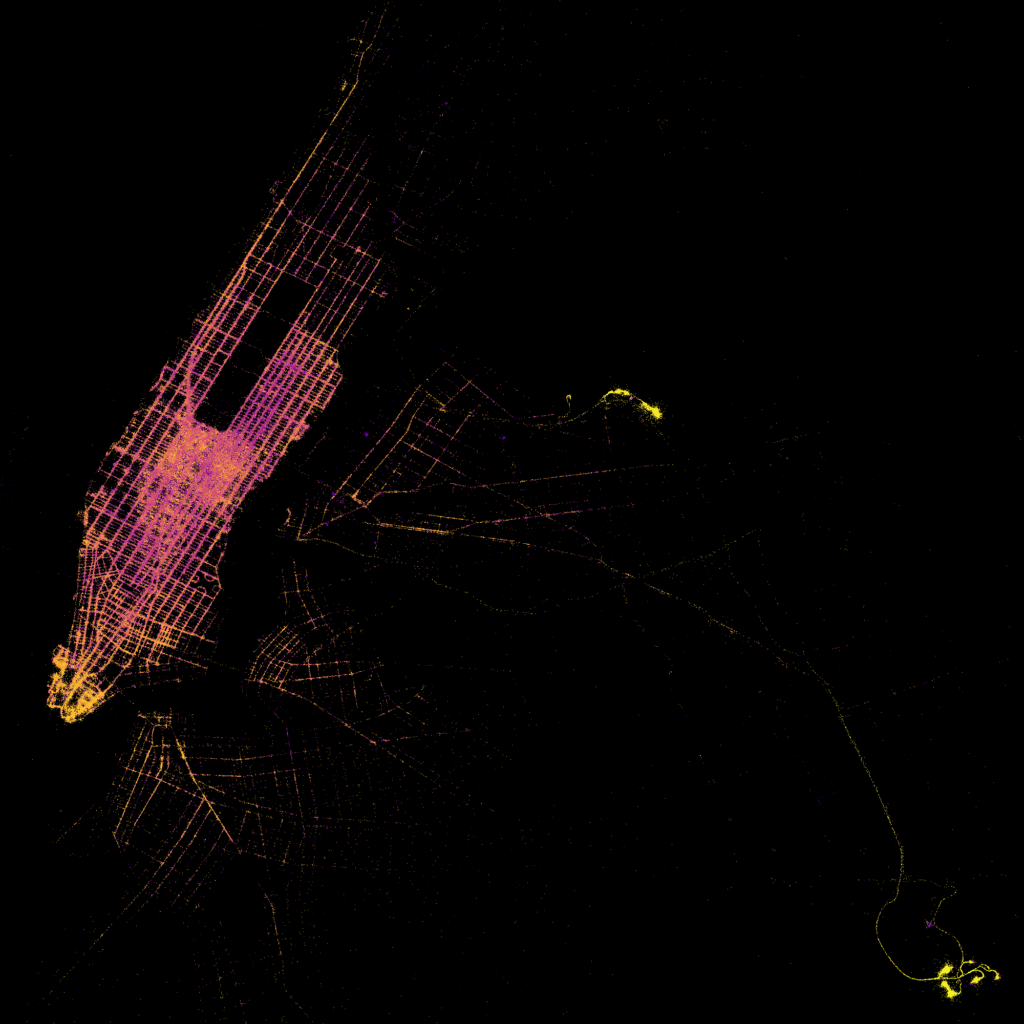
#PICKUP LOCATION WITH LOG DISTANCE
The map shows the pickup coordinates with the logarithm of the distance.
#Pink: short trip duration
#Yellow: long trip duration
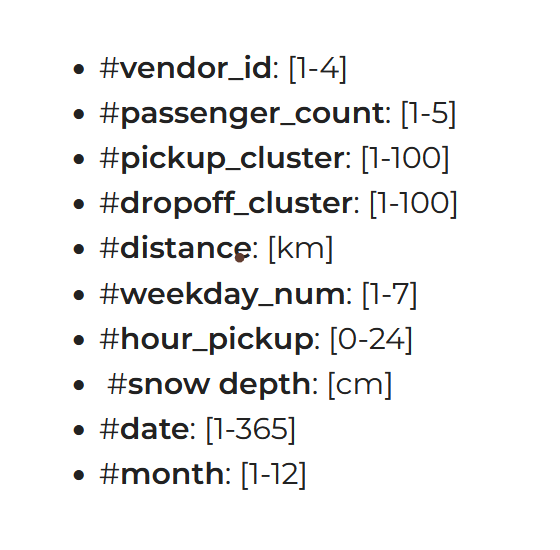
#FINAL TRAIN PARAMETERS
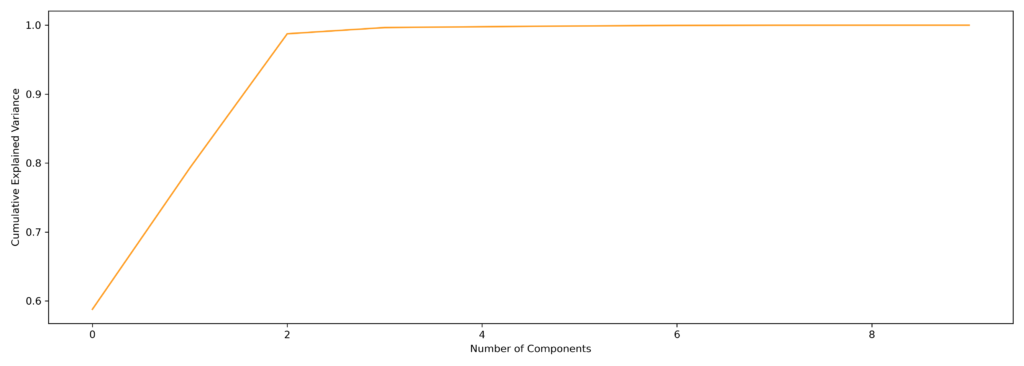
For feature extraction we can use klearn.decomposition PCA to analyze how many columns are theoretically needed to get a high quality prediction.
#The final selected columns were the following, still the average temperature should have probably been included:
#Correlation Analysis
#The correlaton analysis shows the possible impact of the selected columns on the prediction, columns with negative values should be removed.

#SPLITTING TRAIN- & TESTDATA
Finally the cleaned and merged training dataset is split into a train- and testdataset – ratio 20/80.
#LINEAR REGRESSION
R2: 0.604
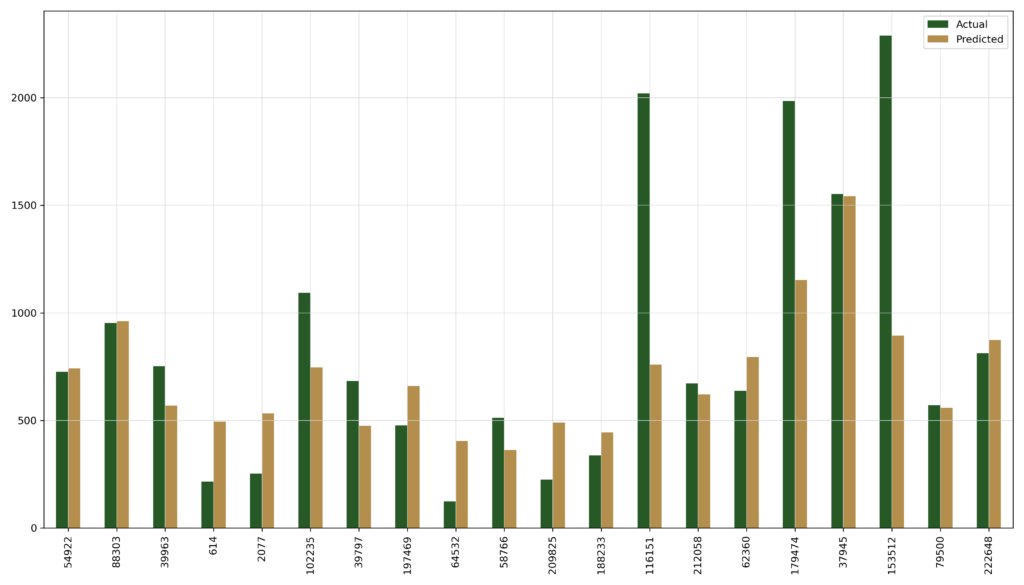
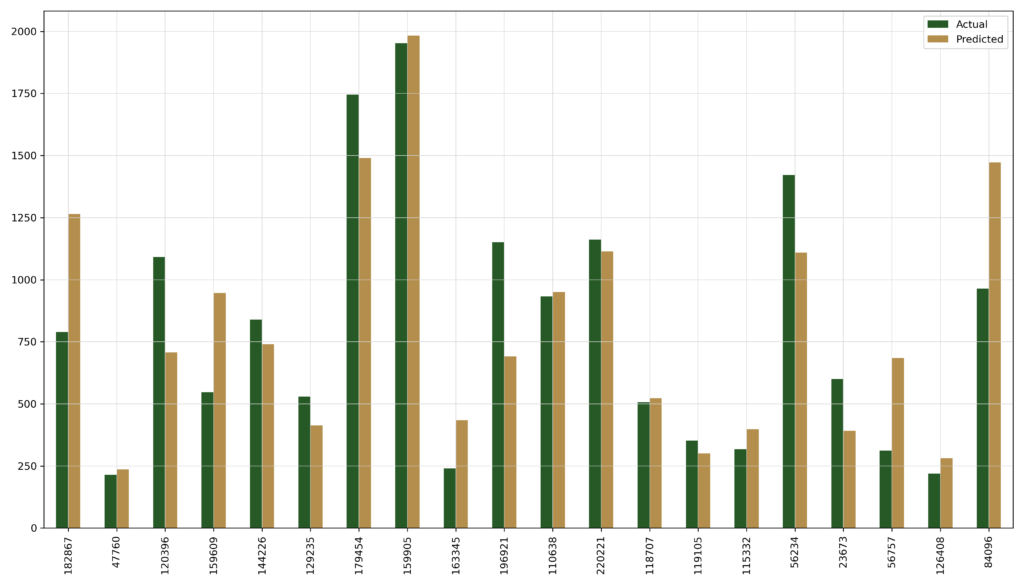
#RANDOM FOREST & FINAL PREDICTION
The random forest model provided the best results, the computation time though was a lot higher than for the linear regression.
R2: 0.769