
As a starting point in the Cloud Based Data Management course, we were asked to address a current problem for the final project by using the knowledge acquired during the seminar. The topic chosen in my case was the housing problem in Spain.
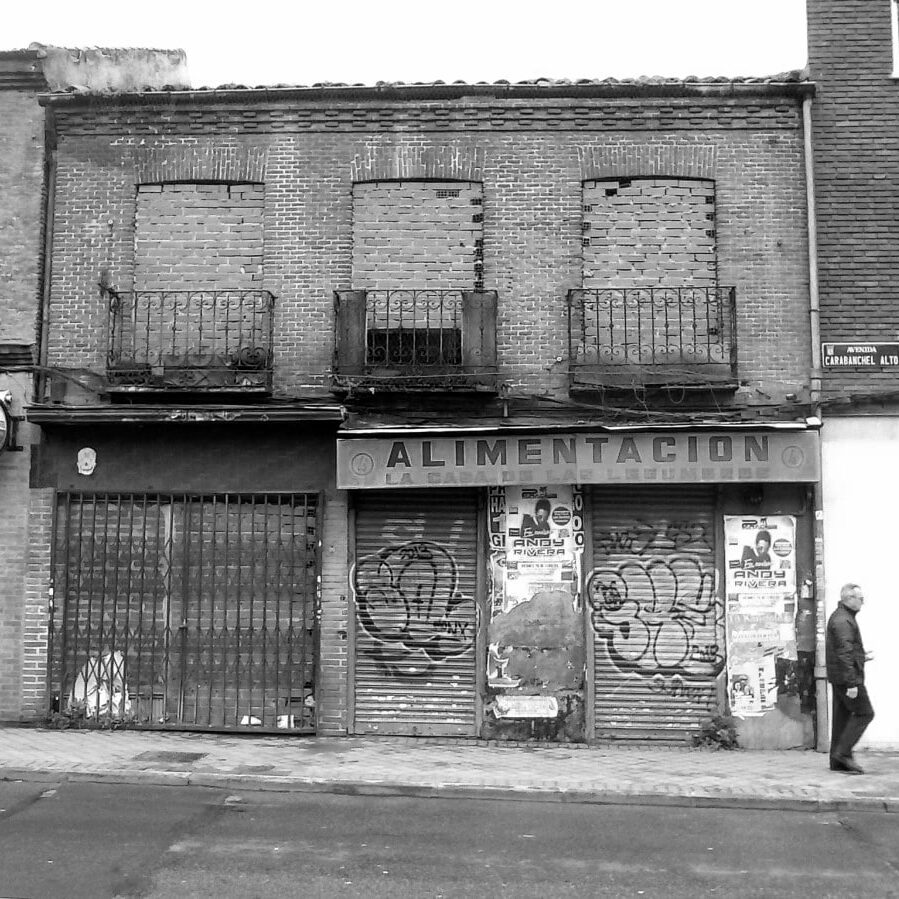
Access to affordable housing has become one of Spain’s most pressing social issues. Rising property prices, real estate speculation, and a lack of public housing have created a crisis affecting both home buyers and renters. While salaries remain stagnant, housing costs continue to rise, making it increasingly difficult for young people and middle-class families to access stable housing.

1. REAL ESTATE SPECULATION & INVESTMENT FUNDS
-Large corporations and investment funds have acquired thousands of properties, reducing availability and driving up prices.
–Many homes remain vacant for speculative purposes rather than serving as primary residences.

2. SOARING RENTAL PRICES
-Major cities like Madrid and Barcelona have seen drastic rental price increases.
–Short-term tourist rentals (Airbnb, etc.) reduce long-term rental availability, worsening the crisis.
3. HIGH PERCENTAGE OF VACANT AND UNOCCUPIED
HOMES
-Despite the housing shortage, thousands of properties remain empty due to speculation.
-Unauthorized occupations (squatting) have emerged as a response to housing insecurity.

4. LIMITED PUBLIC & COOPERATIVE HOUSING
-Spain has one of the lowest percentages of social housing in Europe.
–Cooperative housing remains underdeveloped compared to other European models.
How the Wep App Helps
This web app provides a visual representation of Spain’s housing market dynamics, allowing users to explore how different ownership models (private, cooperative, investment funds) impact availability, affordability, and occupancy rates.
Structure
The app is structured into three main sections:
1.Input Panel
This section contains all the configuration options and is divided into two blocks:
• City Setup, which defines the size and density of the city to be visualized.
• City Visualization, which determines the ownership structure of properties (investment funds, cooperatives, or individual owners) and controls display settings within the viewer.
2. Visualization Panel
This section provides two modes for analyzing urban distribution:
• Ownership Model Mode, which offers a graphical representation of property ownership, making abstract data more accessible.
• Occupancy Mode, which indicates whether residences are inhabited or vacant.
To enhance computational efficiency, a computation speed button has been integrated, allowing for adjustments in the level of detail for faster visualization.

3. Metadata Panel
This section presents key data that fluctuate based on the chosen configuration, including:
• Rent and sale prices
• Occupancy rates
• Number of residents
• Housing availability and squatting ratios

Through this interactive system, users can analyze how different housing policies and ownership models influence urban development. The objective is to facilitate informed discussions and explore potential solutions for a more sustainable and equitable housing system.
Making Of
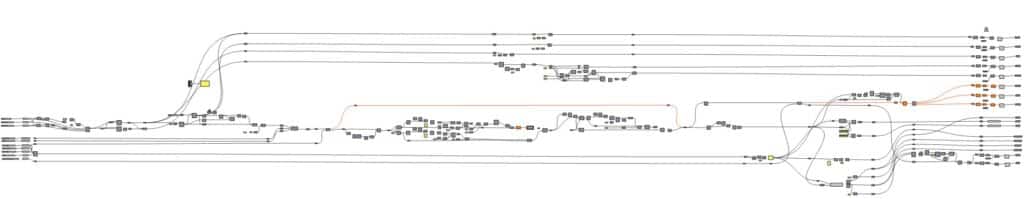
1.Grasshopper
2.Vue
Conclusion
By interacting with the app, users can better understand Spain’s housing crisis and explore alternative models that could lead to a more sustainable and equitable housing system.
In addition to having been able to incorporate and learn innovative and useful work methods in our professional activity, this seminar tests our ability to respond to daily problems we face with an expanded perspective that can benefit from the use of these tools.
