Our team developed a simple, data-driven process that predicts courtyard thermal comfort in real time. Our method gives designers immediate feedback on how their decisions impact the Universal Thermal Climate Index (UTCI), a standard measure of outdoor comfort. In this post, we’ll take you through our approach, from dataset creation to deployment in Grasshopper, and share what we learned along the way.
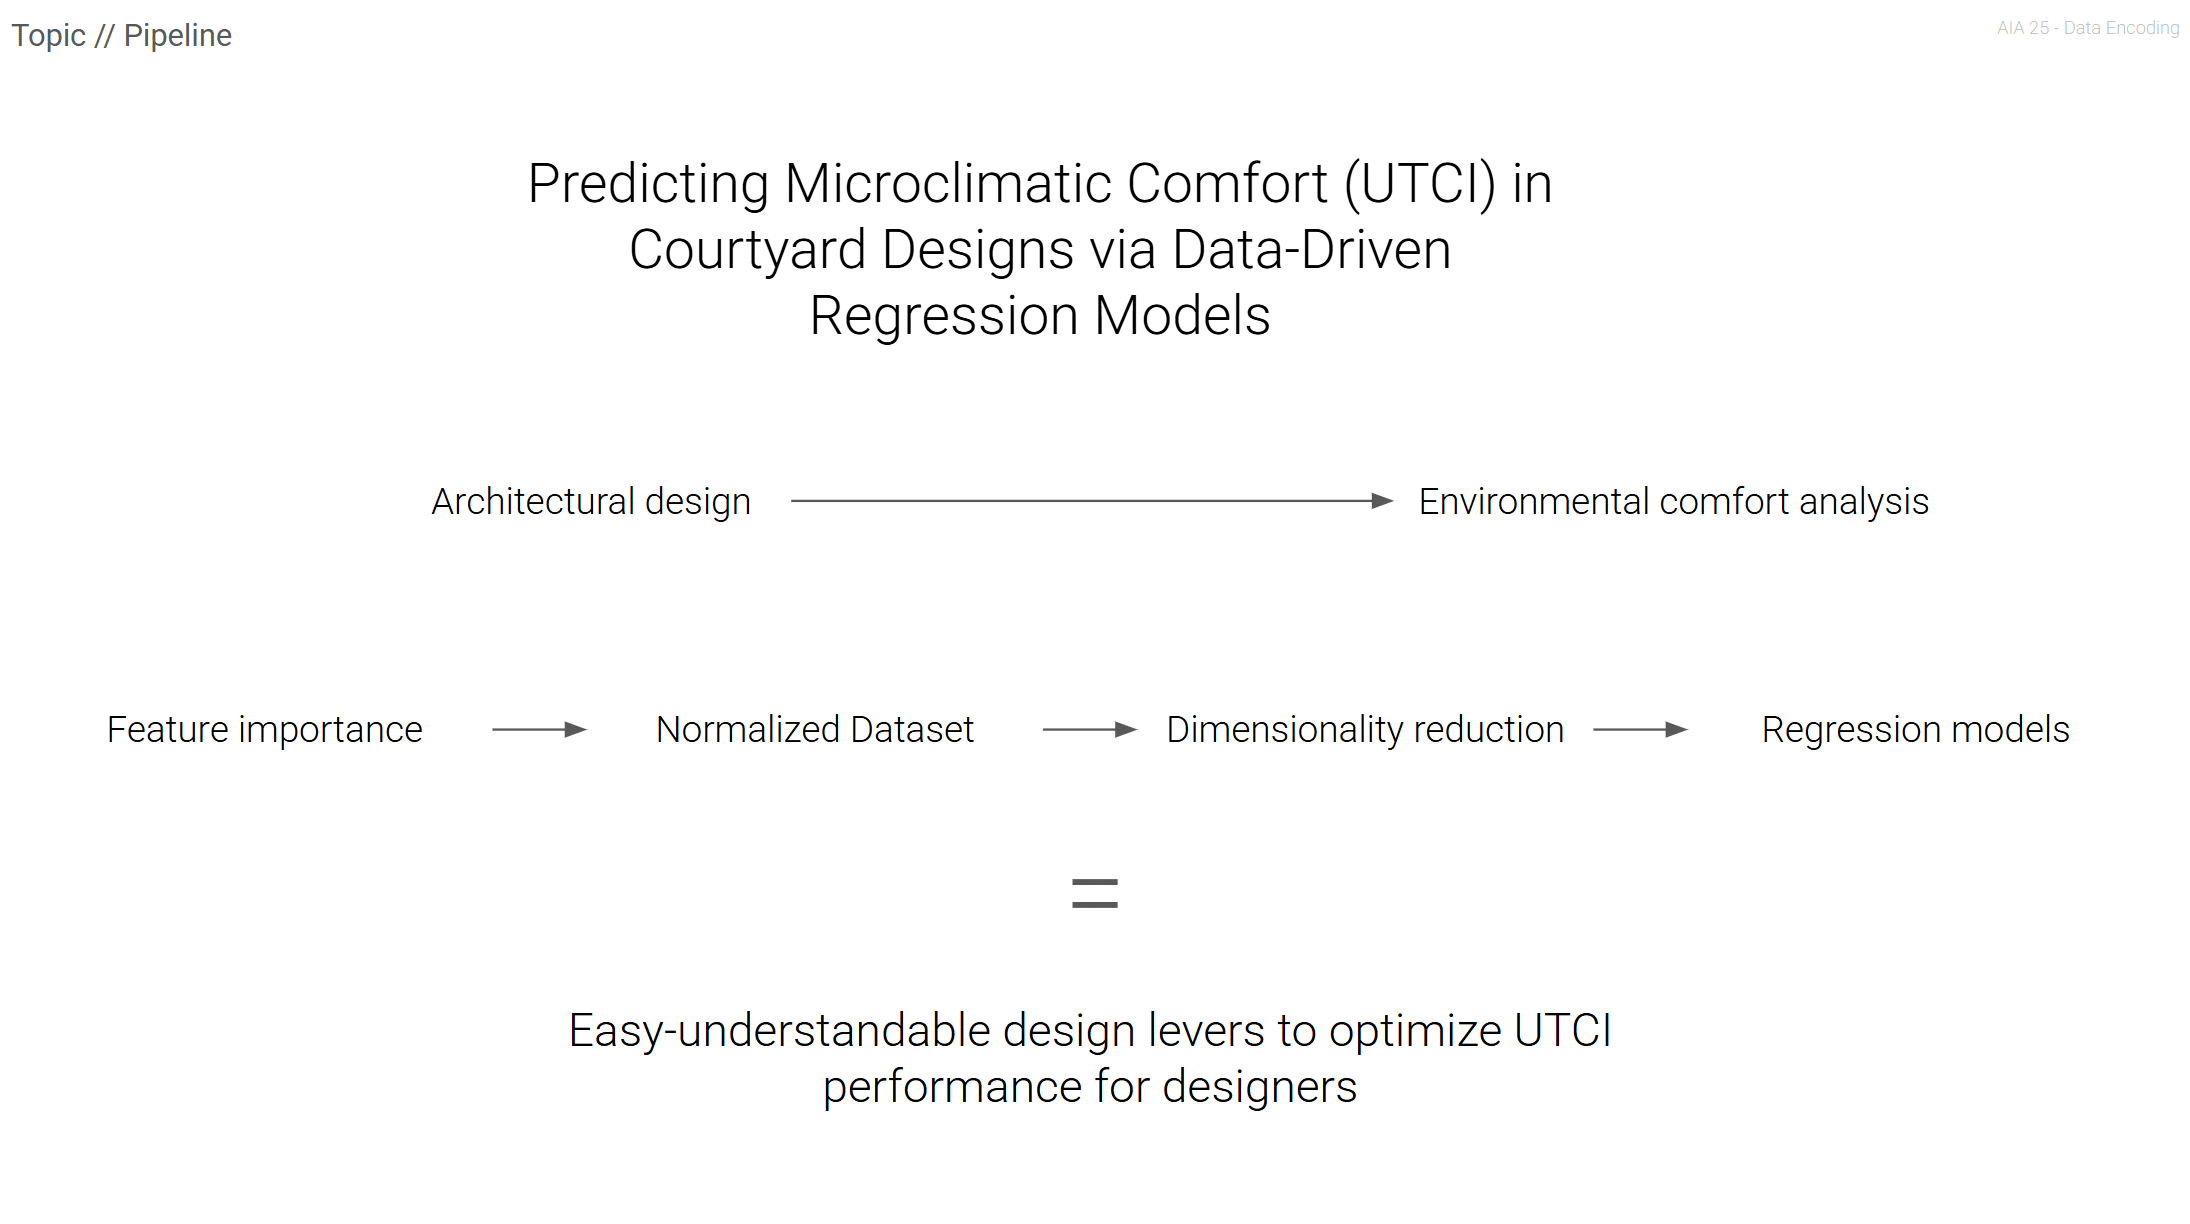
Our project followed a clear pipeline:
- Dataset Creation – We generated thousands of courtyard designs and computed their properties.
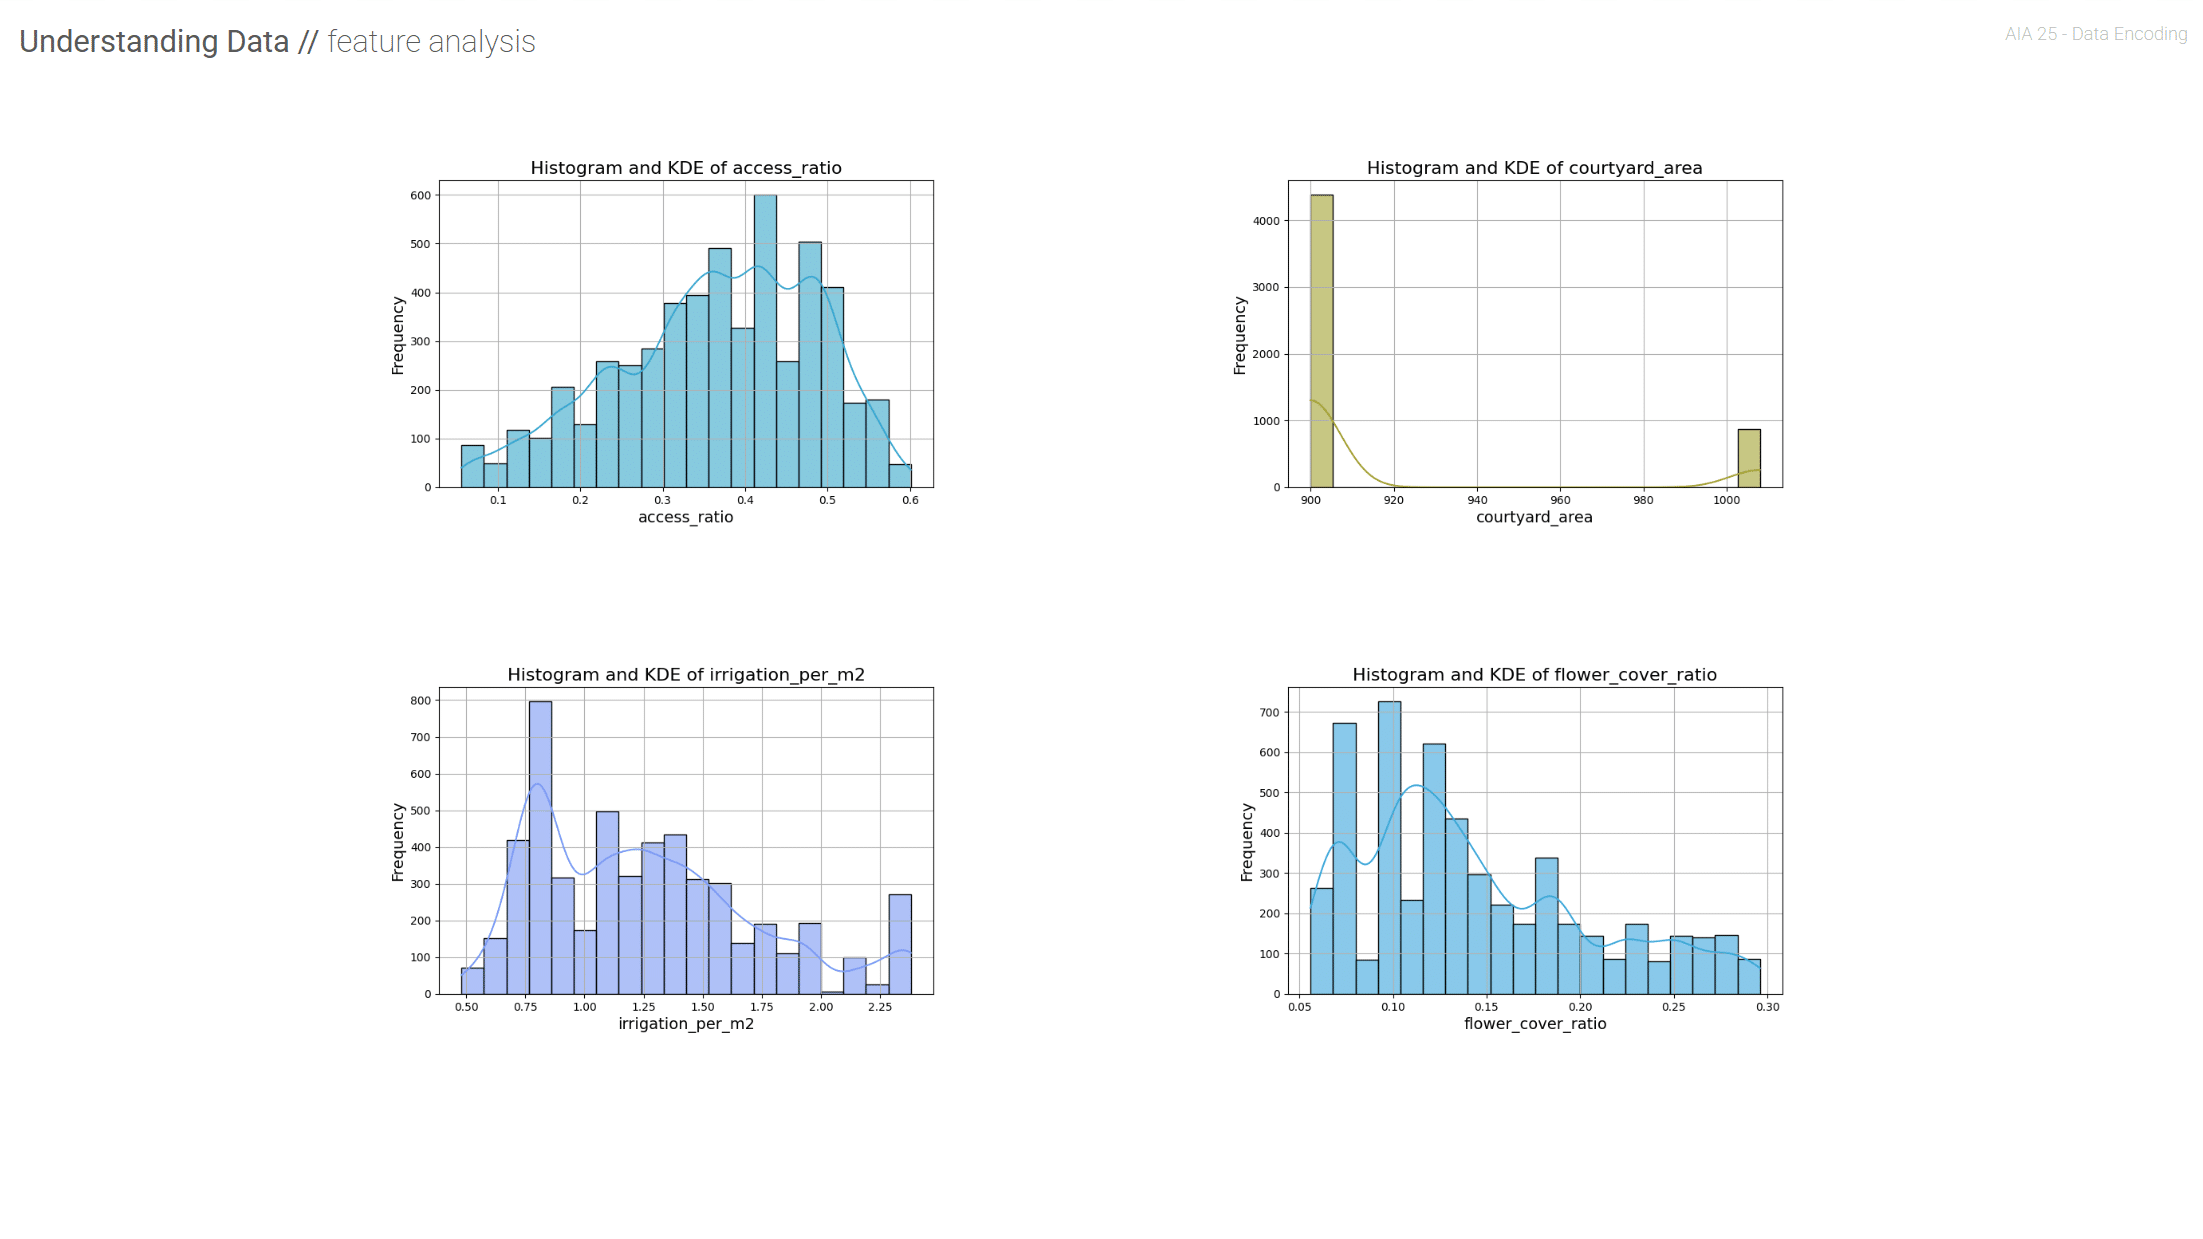
- Feature Engineering – We created meaningful inputs like ratios (e.g., permeable area ratio) and scores (e.g., water score).
- Dimensionality Reduction – We explored patterns in the data with PCA (Principal Component Analysis).
- Regression Modeling – We trained four types of models to predict UTCI.
- Explainability – We applied SHAP values to understand what influences our model’s predictions.
- Deployment – We integrated the model into Grasshopper so designers can use it interactively.
Each step built toward our goal: to give designers easy-to-interpret “design levers” that optimize courtyard comfort.
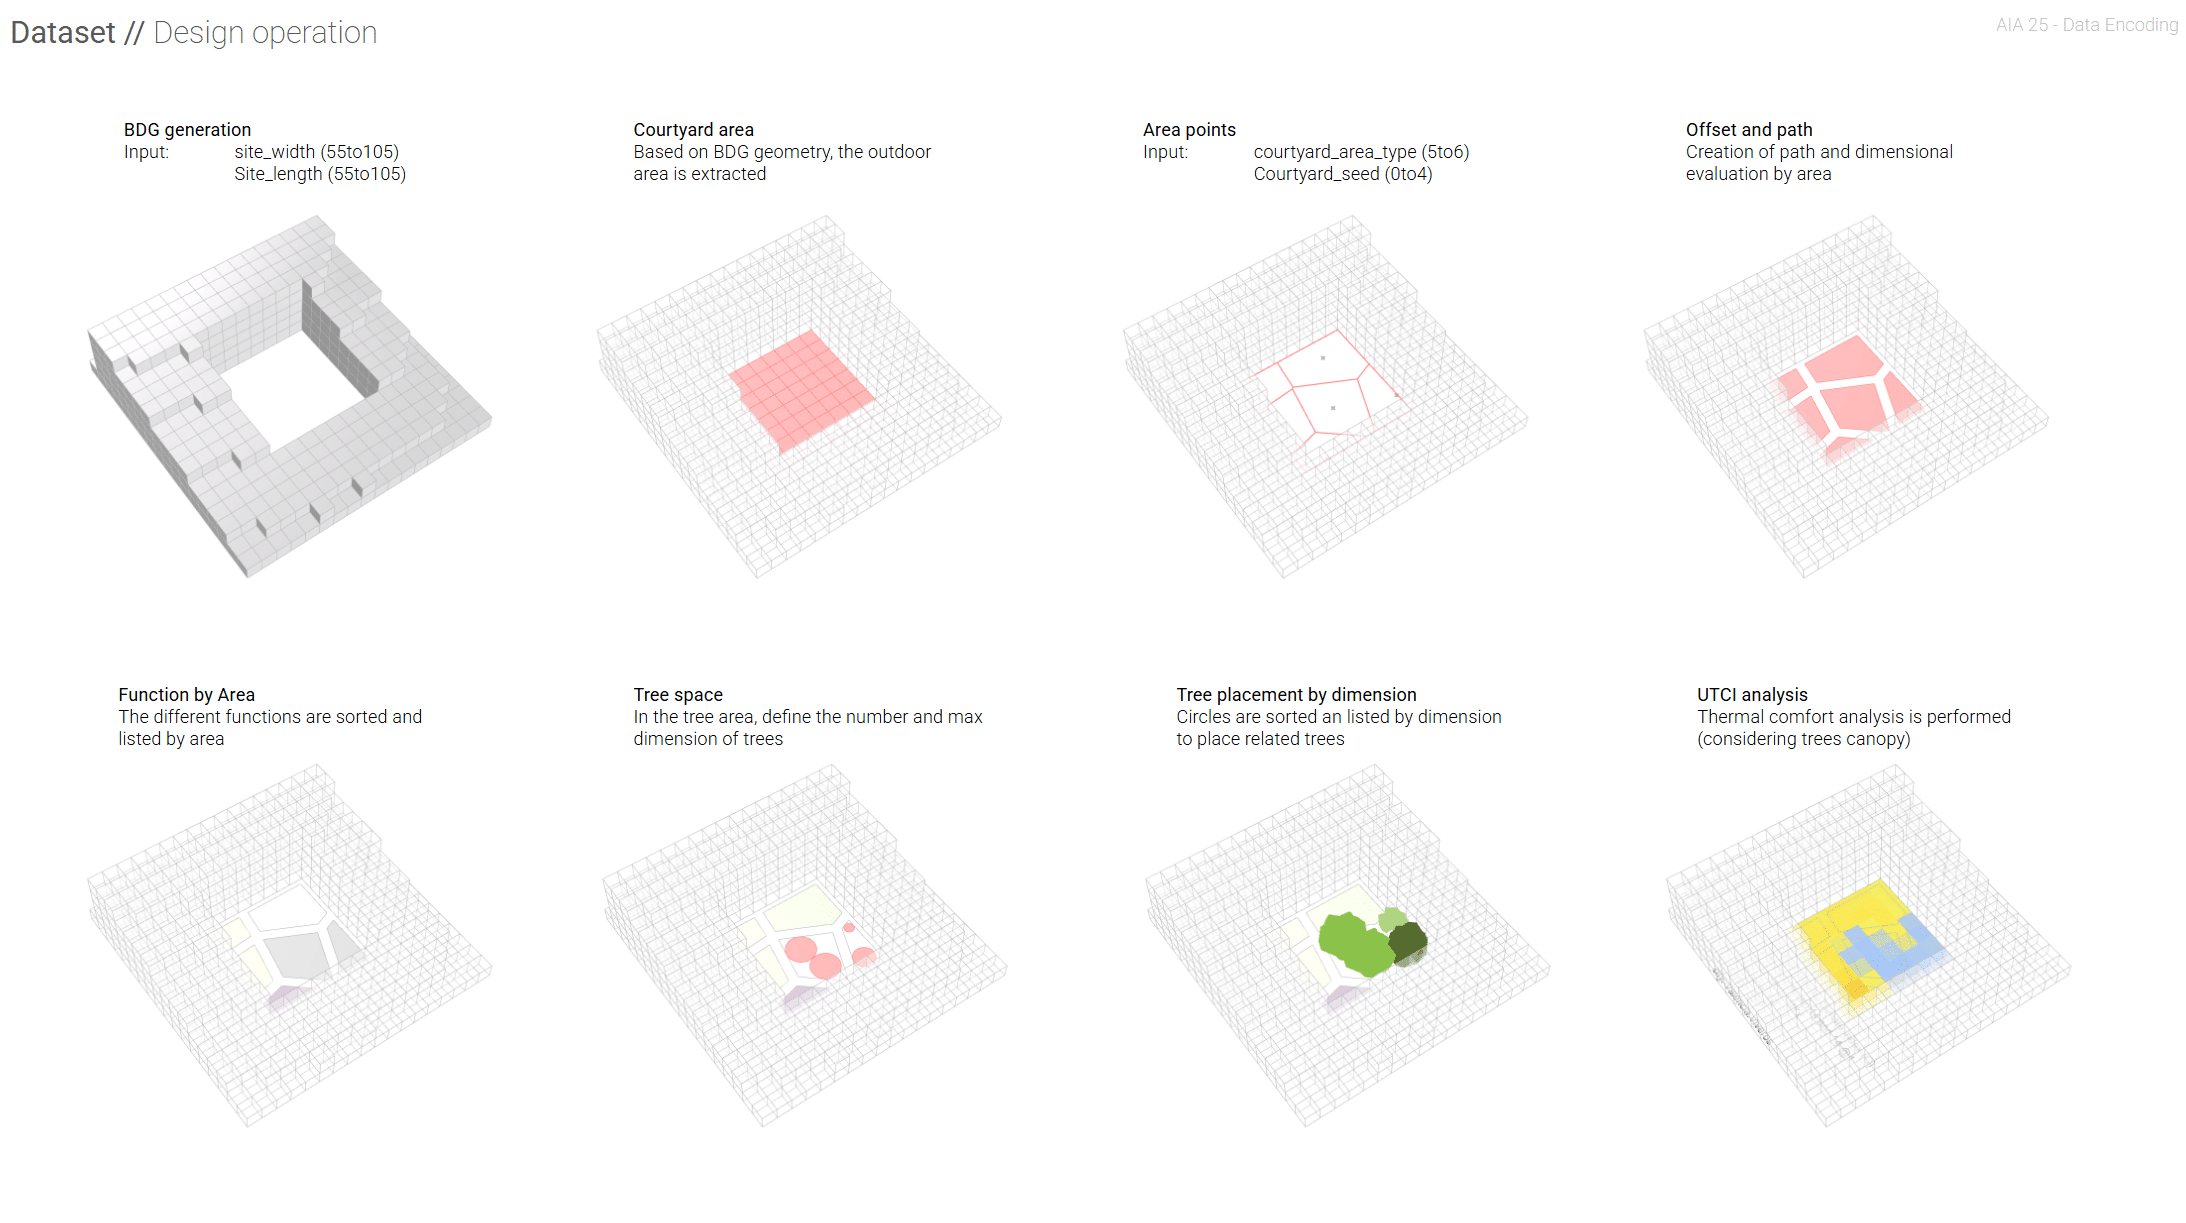
We began in Grasshopper with a “Building Design Generator” script. This tool randomly generated 5,000 courtyard configurations by sampling six key inputs:
- Site width and length (55–105 meters)
- Courtyard shape type
- Offset and path parameters (defining circulation)
- Functional area breakdown (proportion of trees, flowers, paving, etc.)
For each courtyard, we recorded both the inputs and geometric properties like total courtyard area, path length, and tree canopy area. We also ran a Ladybug simulation to compute UTCI, our target output.
Understanding the Data
Our dataset included:
- Raw geometry (site width, length, courtyard area)
- Derived areas (paved area, permeable area, calm/social zones)
- Tree information (number, species, shadow area)
- Ratios (to normalize values for comparison)
- SITES-inspired scores (e.g., water efficiency, comfort)
- UTCI as the thermal comfort metric
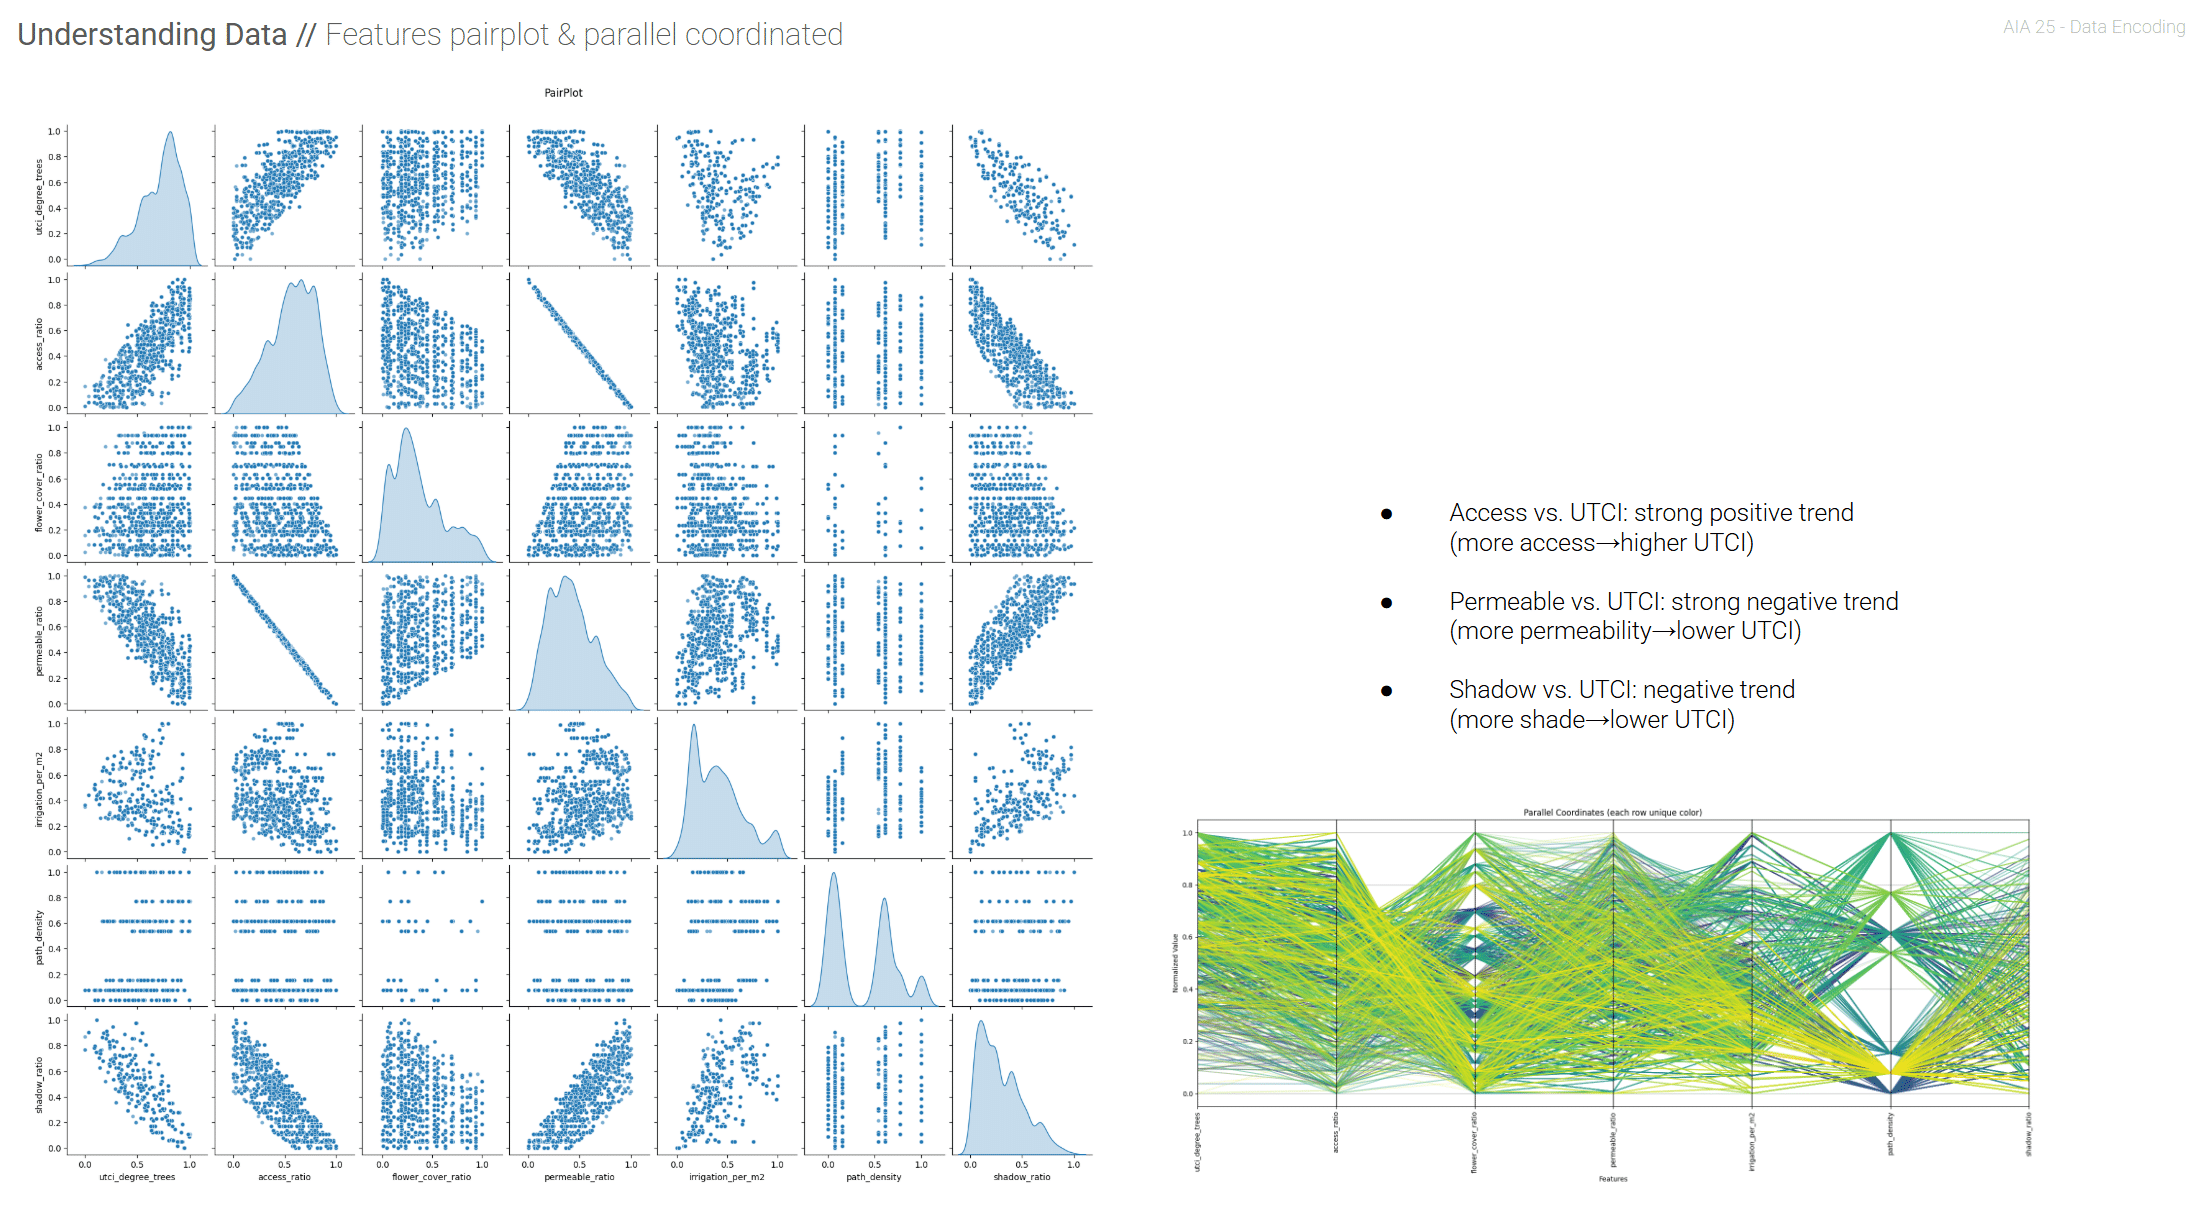
Visual tools like pair plots and parallel coordinate plots confirmed these patterns and gave us confidence that the data reflected physical reality.
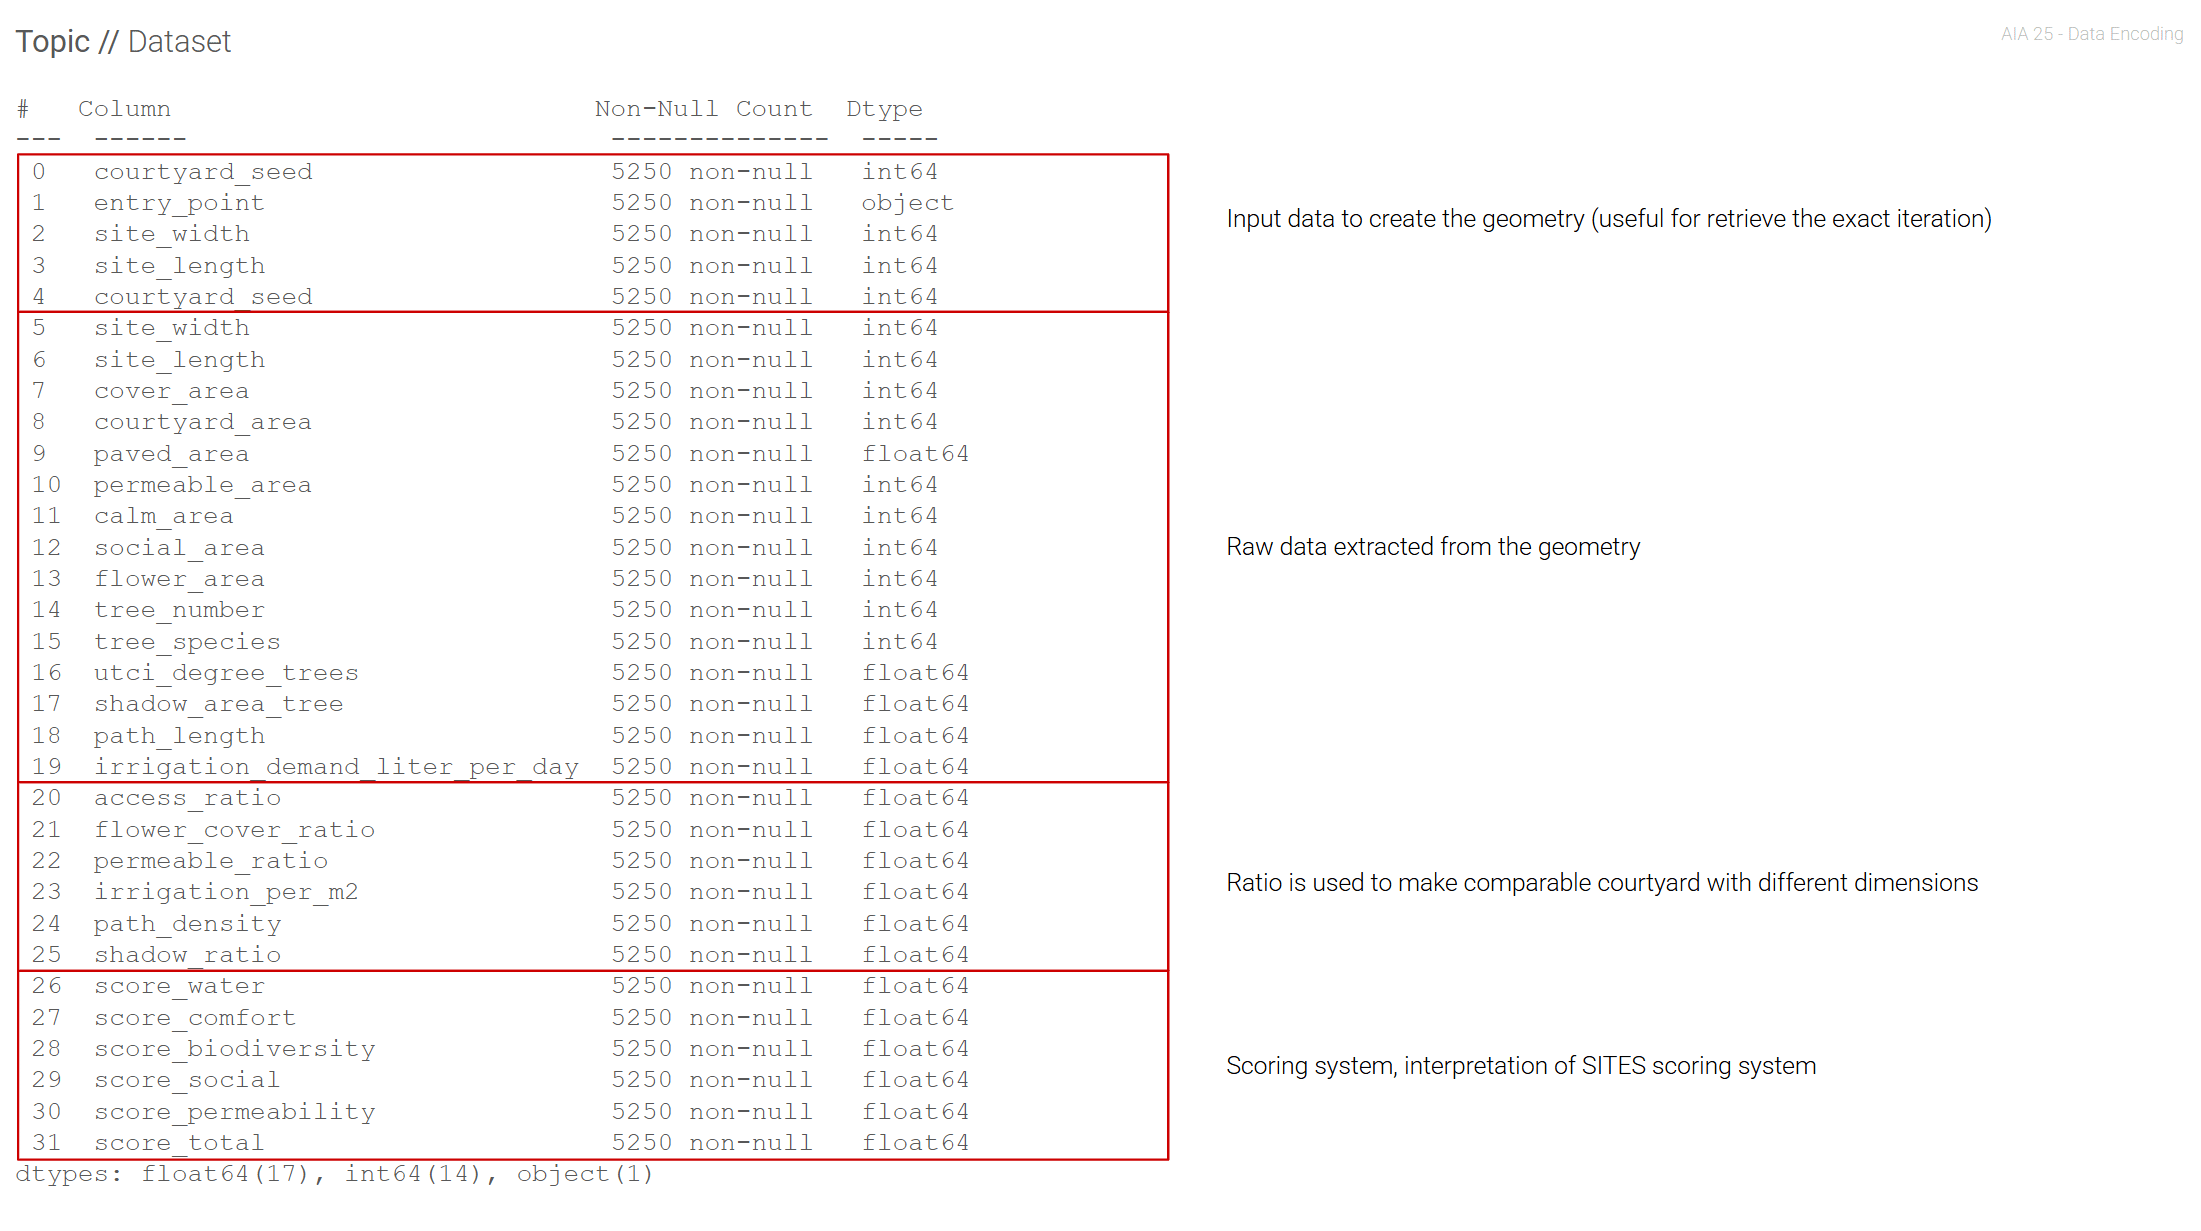
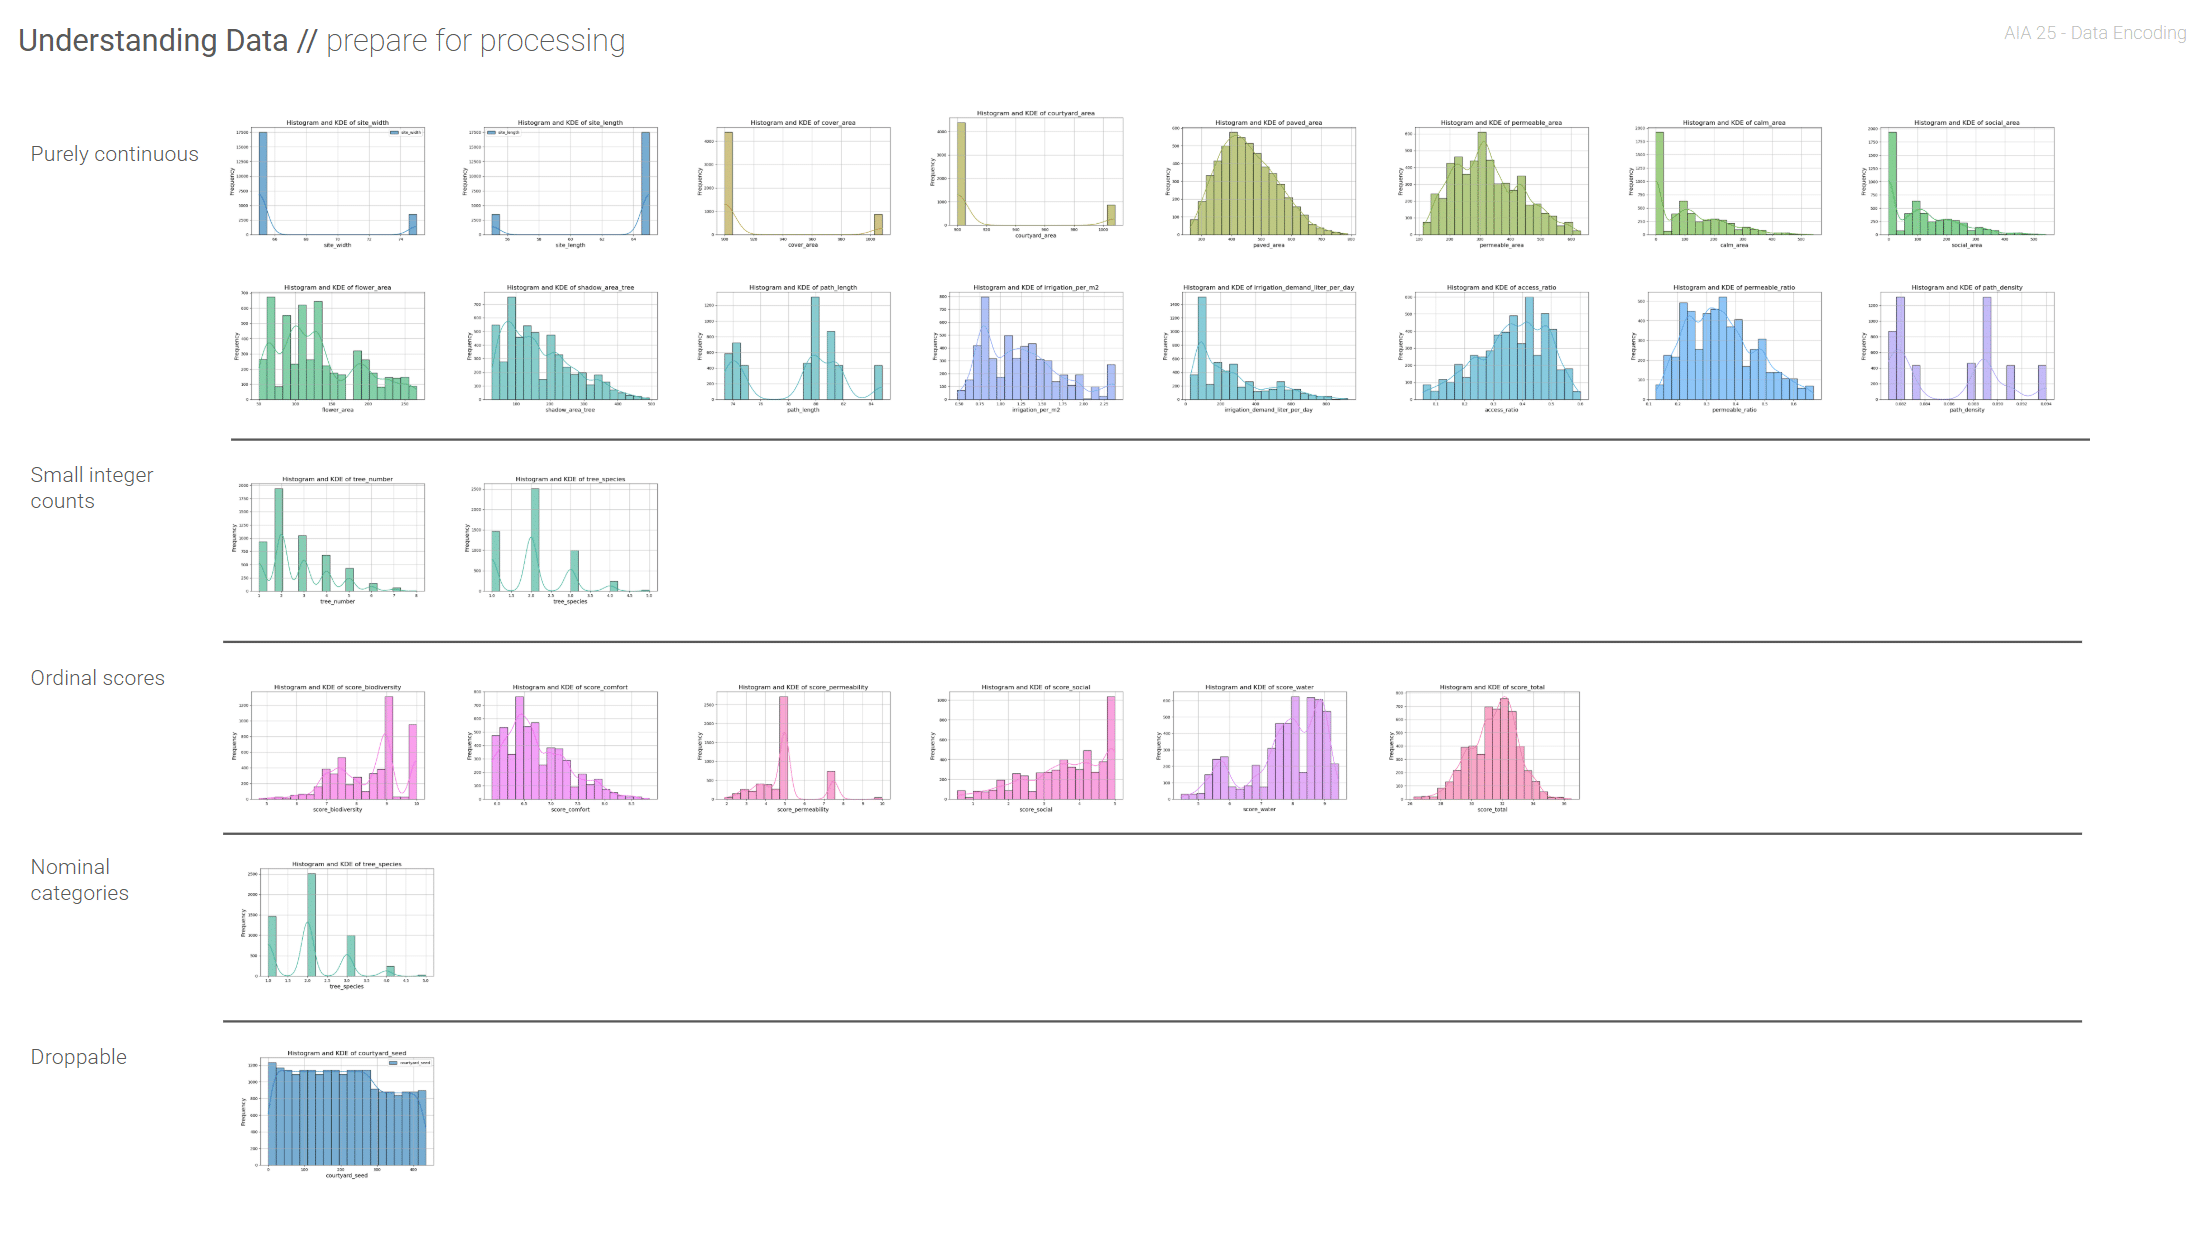
We cleaned the data, removed redundant fields, and grouped features into four types: continuous variables, small integer counts, ordinal scores, and nominal categories. We dropped any inputs that never varied, like random seeds that turned out to add no value.
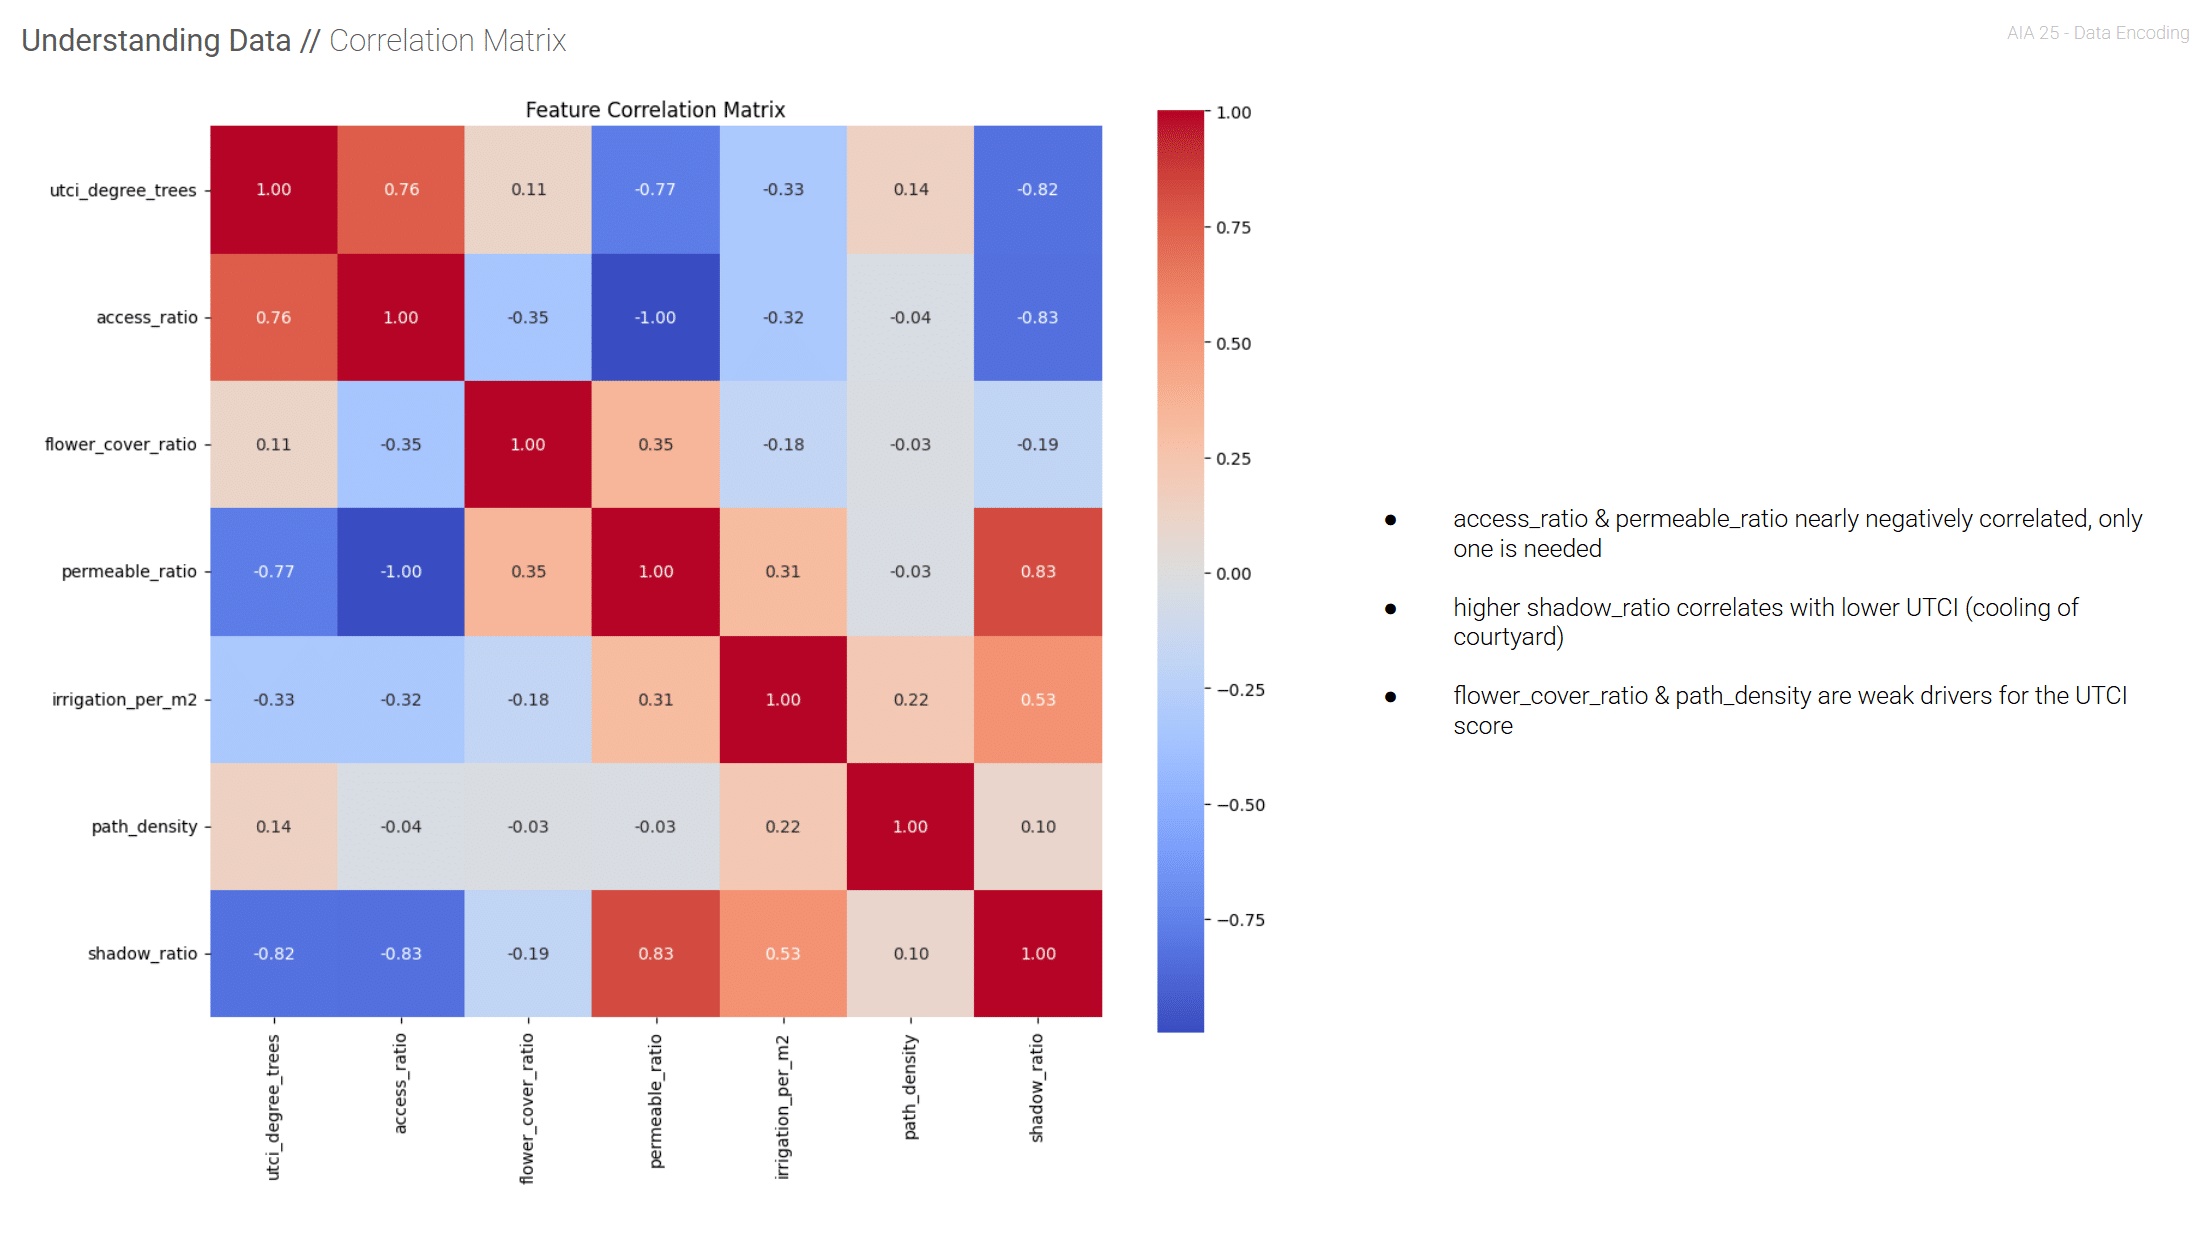
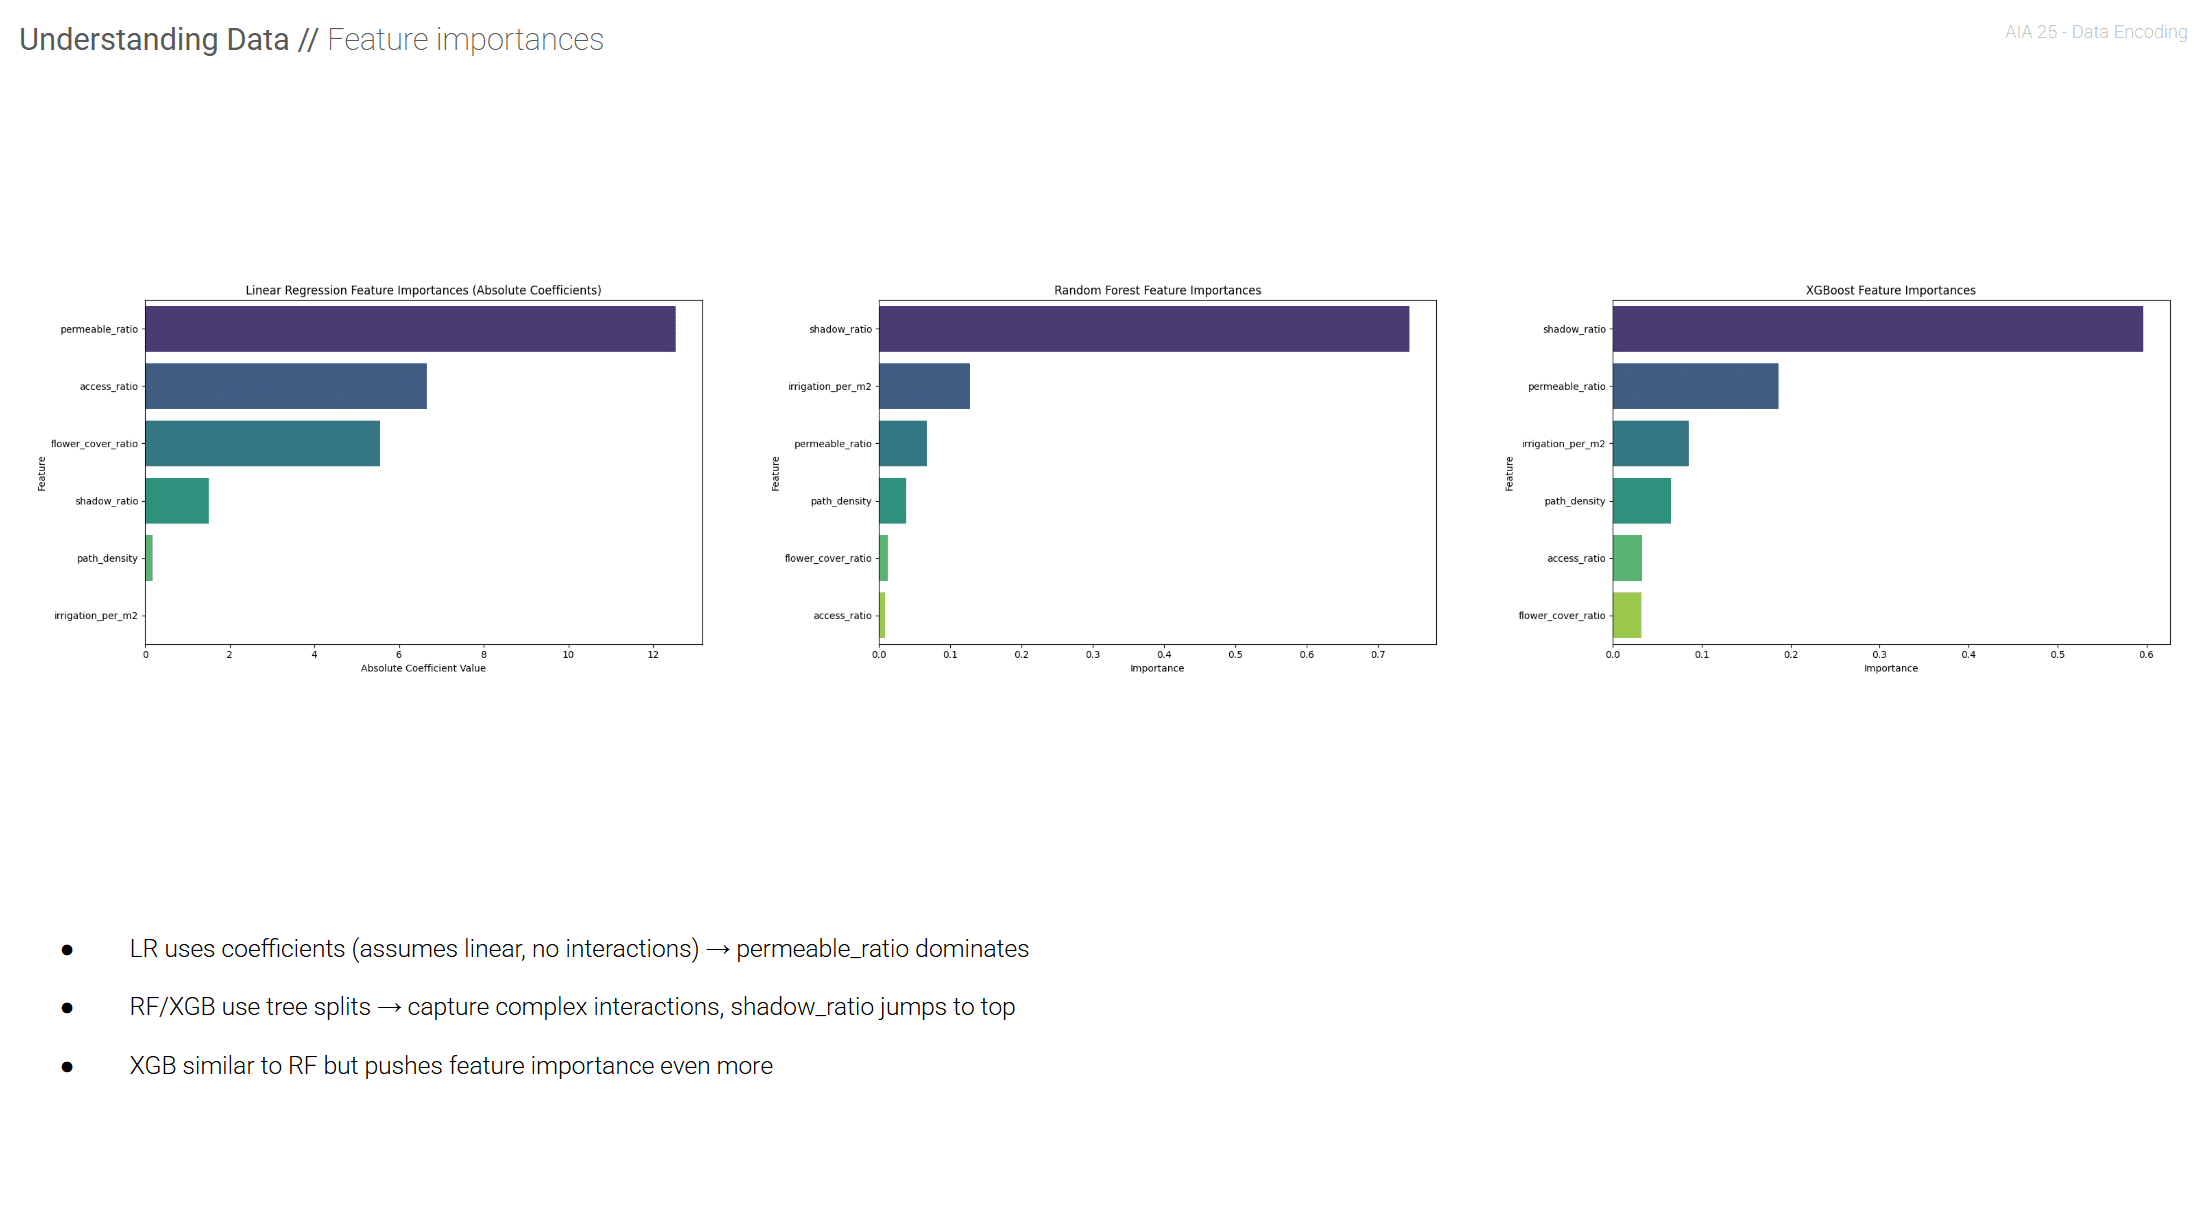
To explore relationships, we built a correlation matrix. This showed, for example, that shadow ratio strongly (and negatively) correlates with UTCI—more shade means cooler courtyards, as expected. Meanwhile, access ratio (hard paving) correlated positively with UTCI, and flower cover had minimal impact.
Modeling: From Linear Fits to Neural Nets
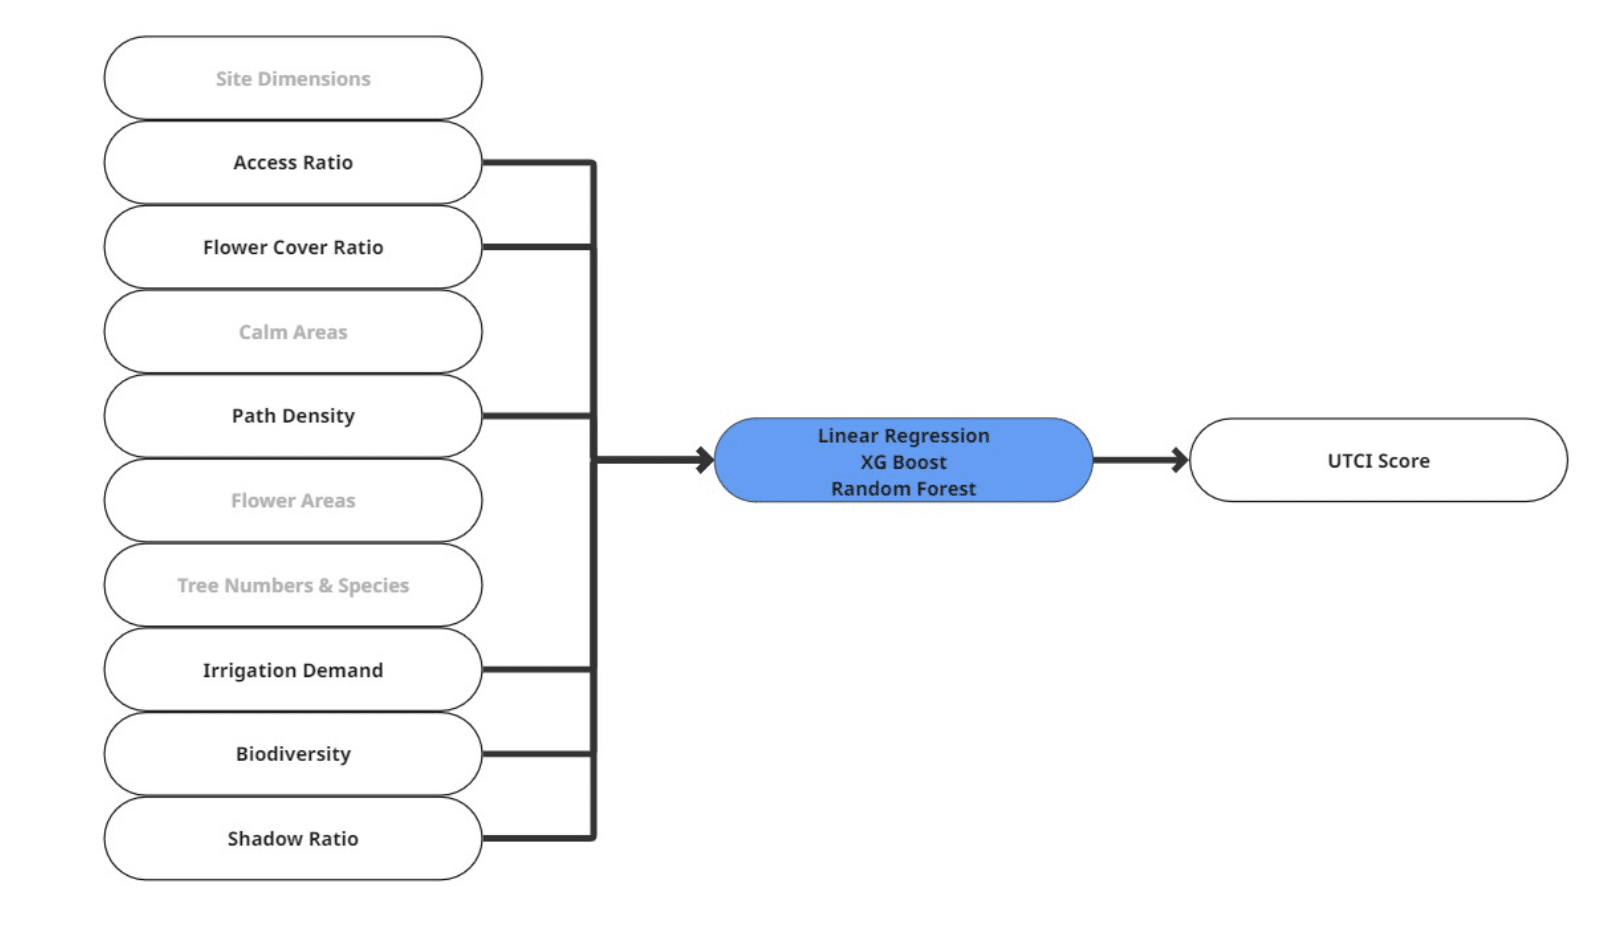
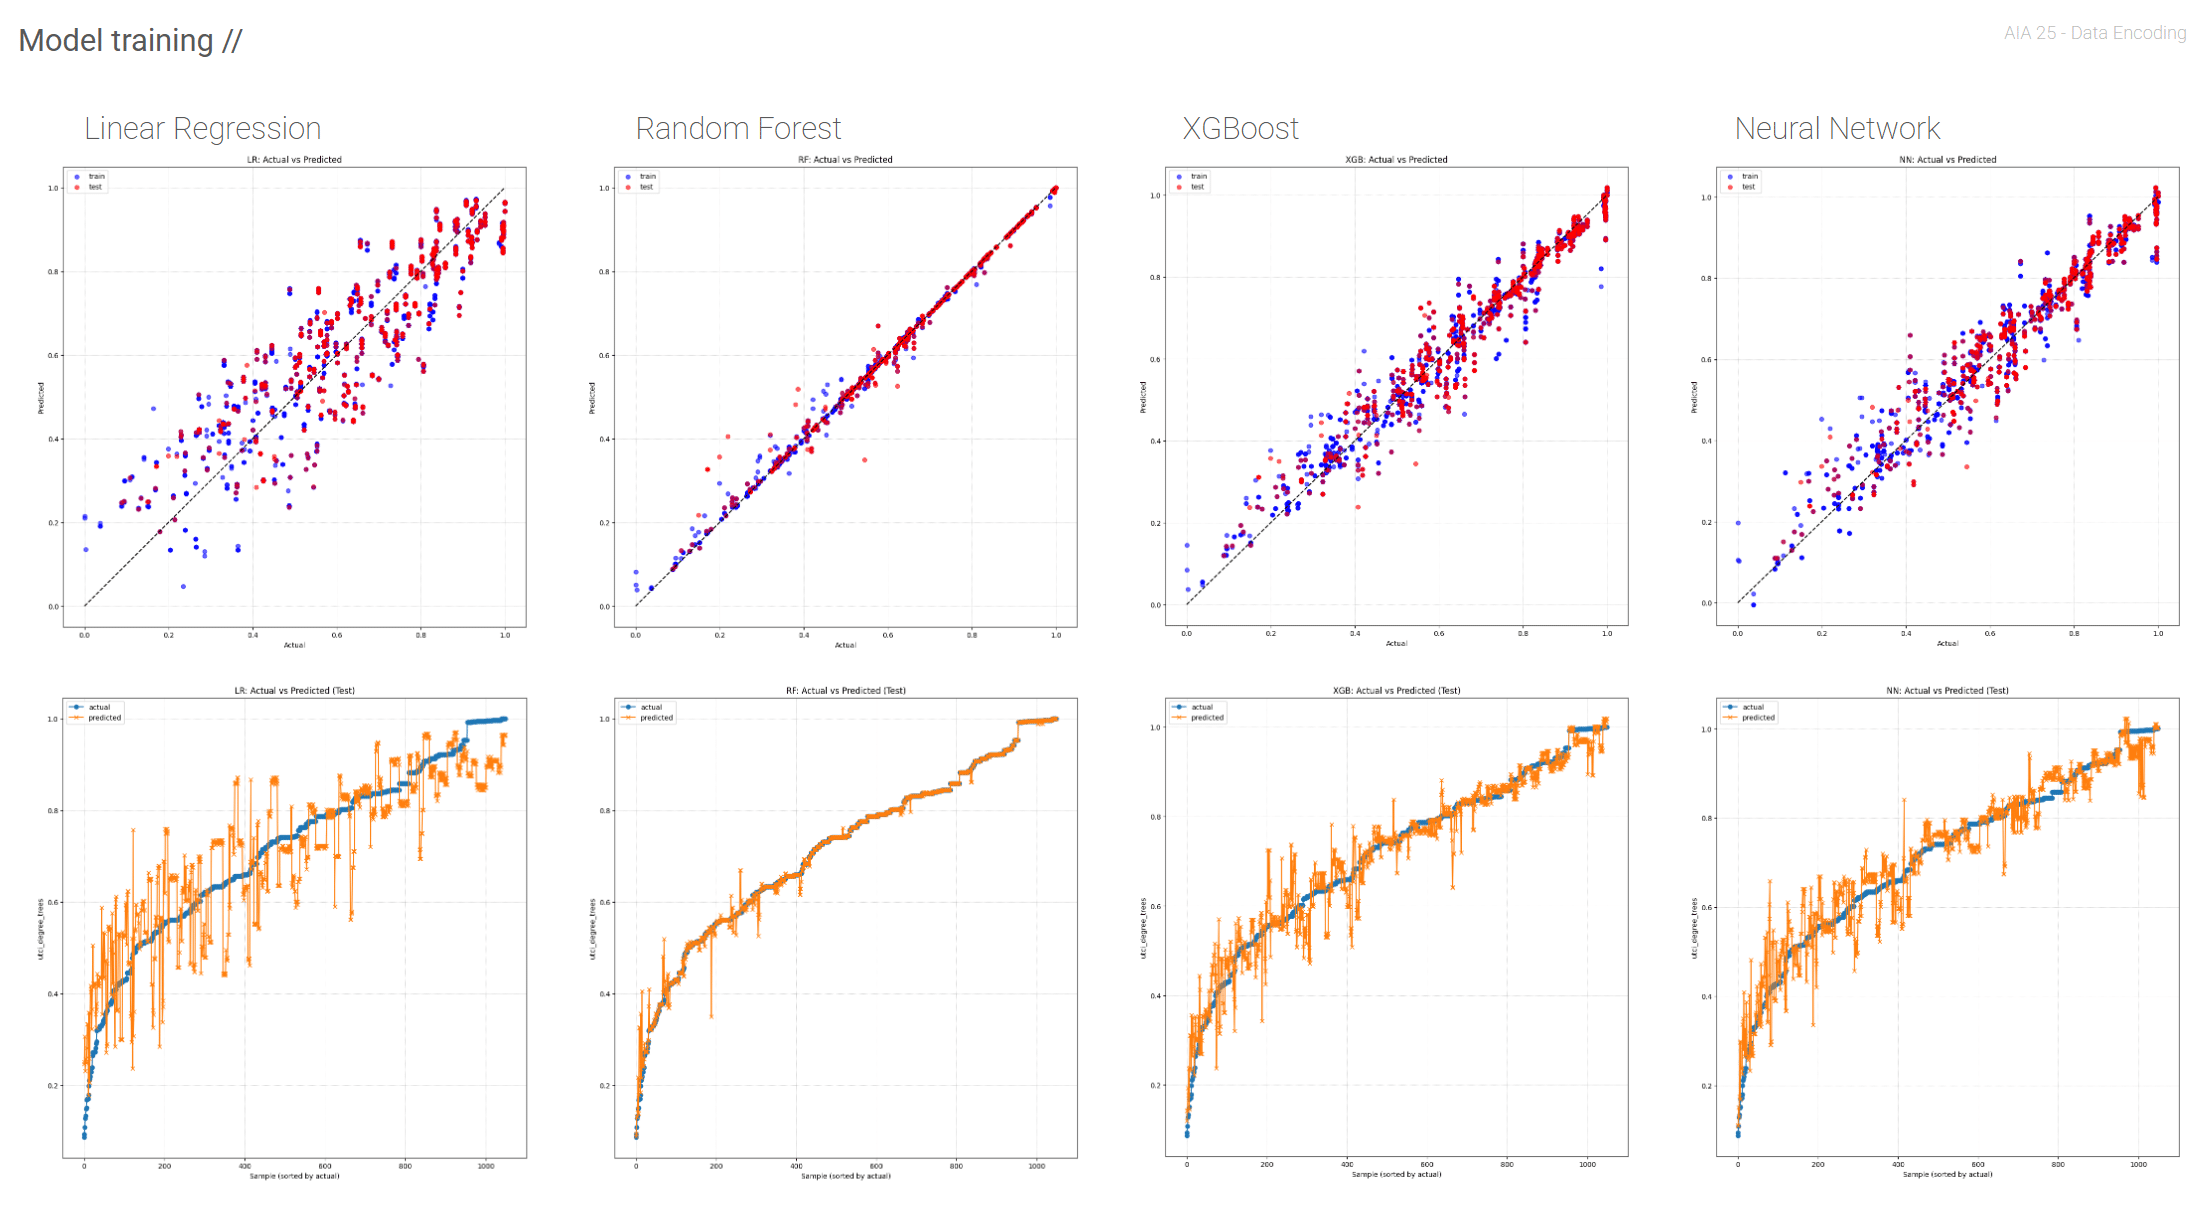
We trained four regression models:
- Linear Regression – A simple baseline, fitting a straight line through the data.
- Random Forest – An ensemble of decision trees, capturing nonlinear effects and feature interactions.
- XGBoost – A gradient boosting model, building trees sequentially to correct errors.
- Neural Network – A small deep learning model with two hidden layers (64 and 32 neurons).
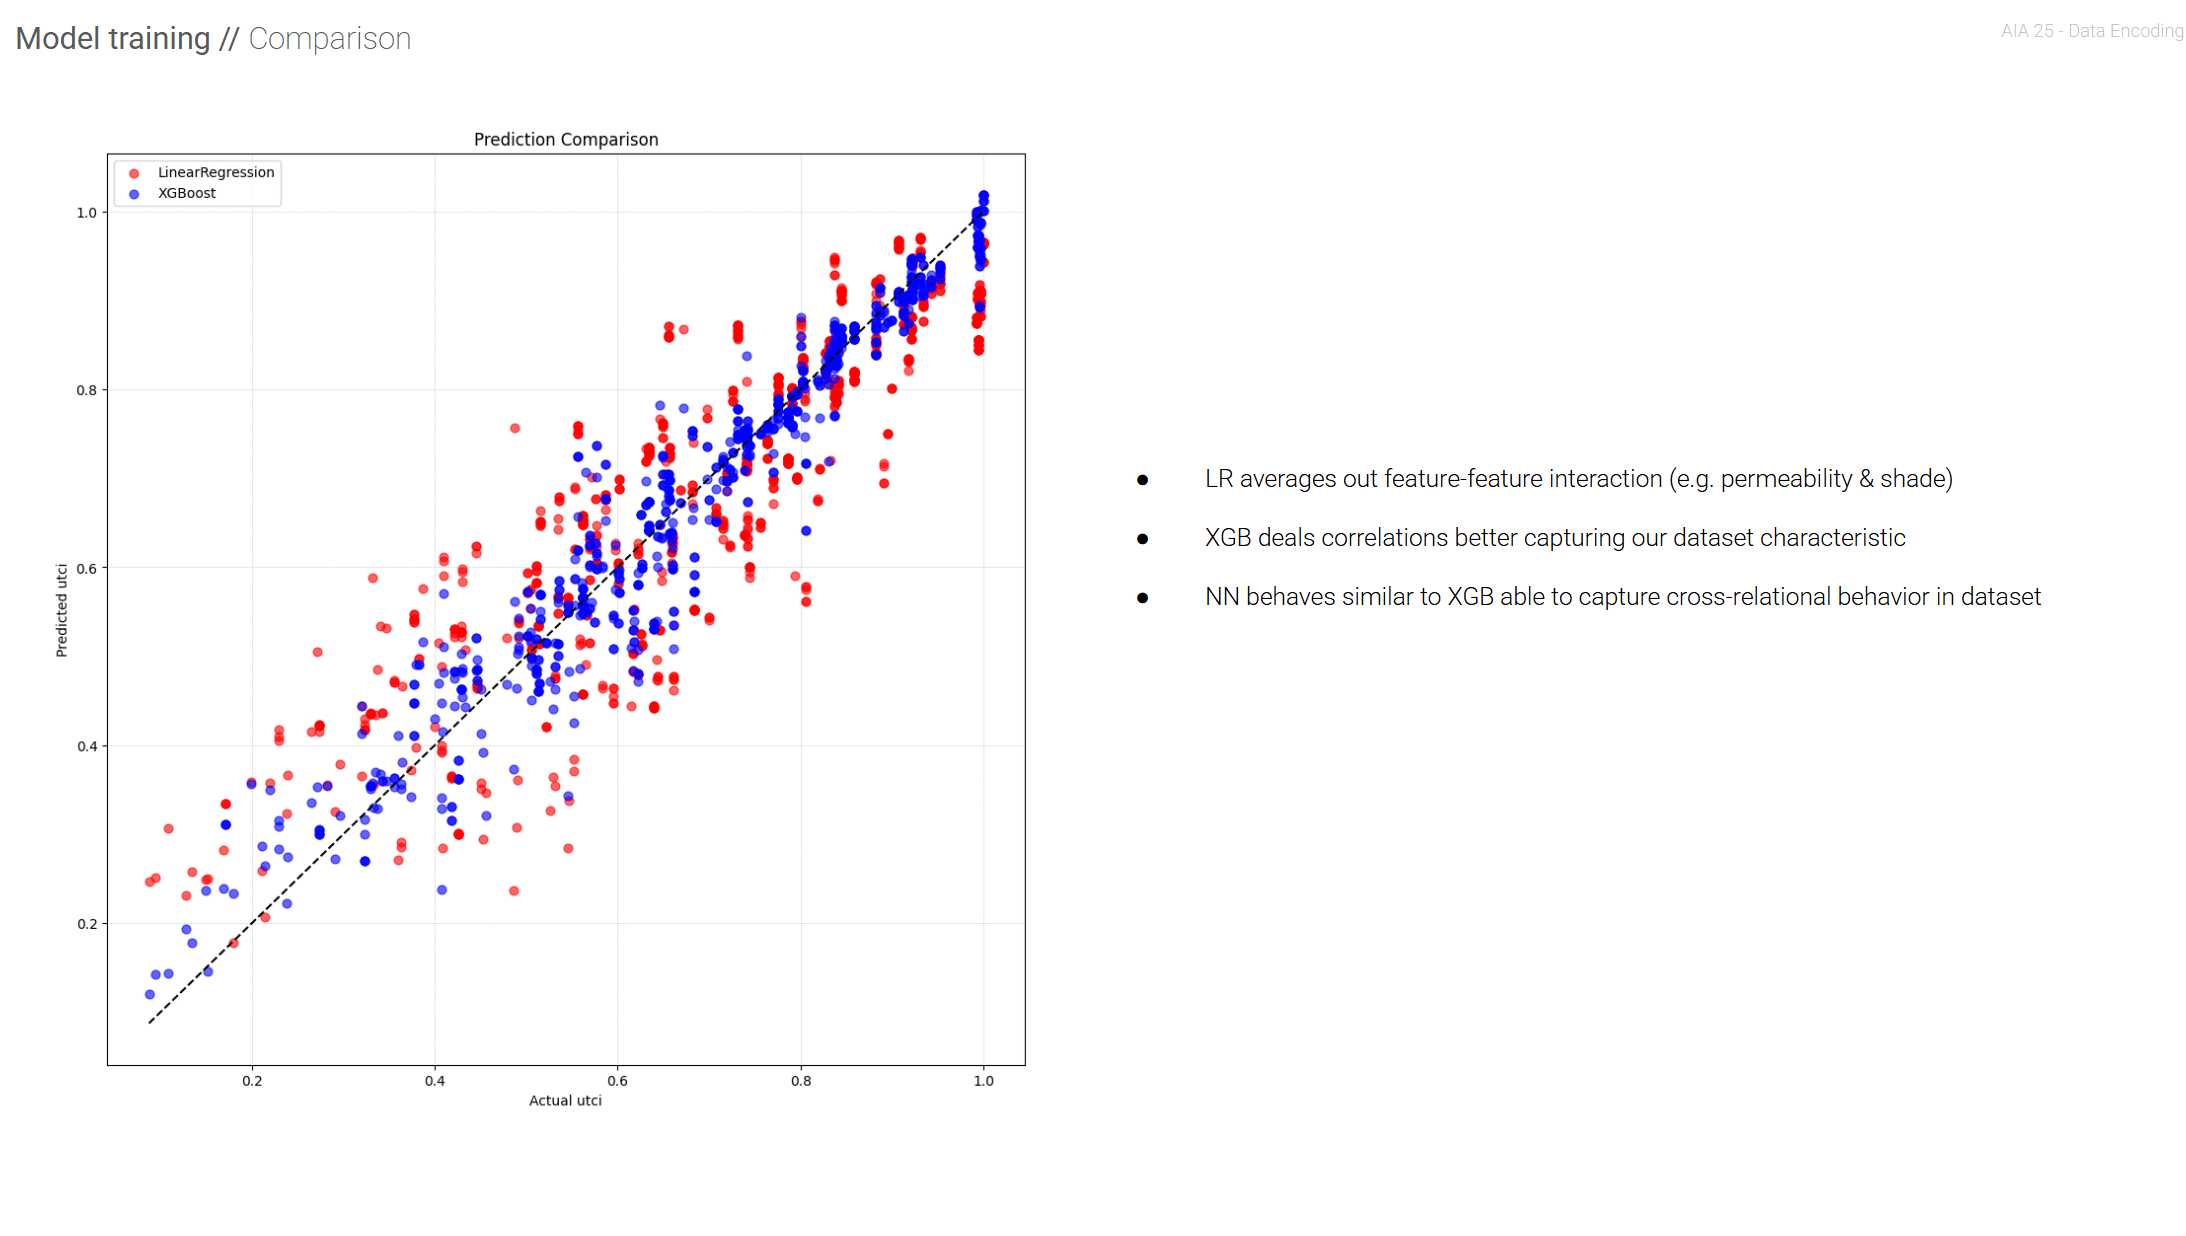
Each model had strengths and weaknesses. Linear regression was easy to interpret but missed nonlinear patterns. Random forest delivered the best performance by automatically capturing complex interactions. XGBoost came close, with strong accuracy and slightly different trade-offs between bias and variance. The neural network showed promise but required careful tuning.
Opening the Black Box: SHAP Analysis
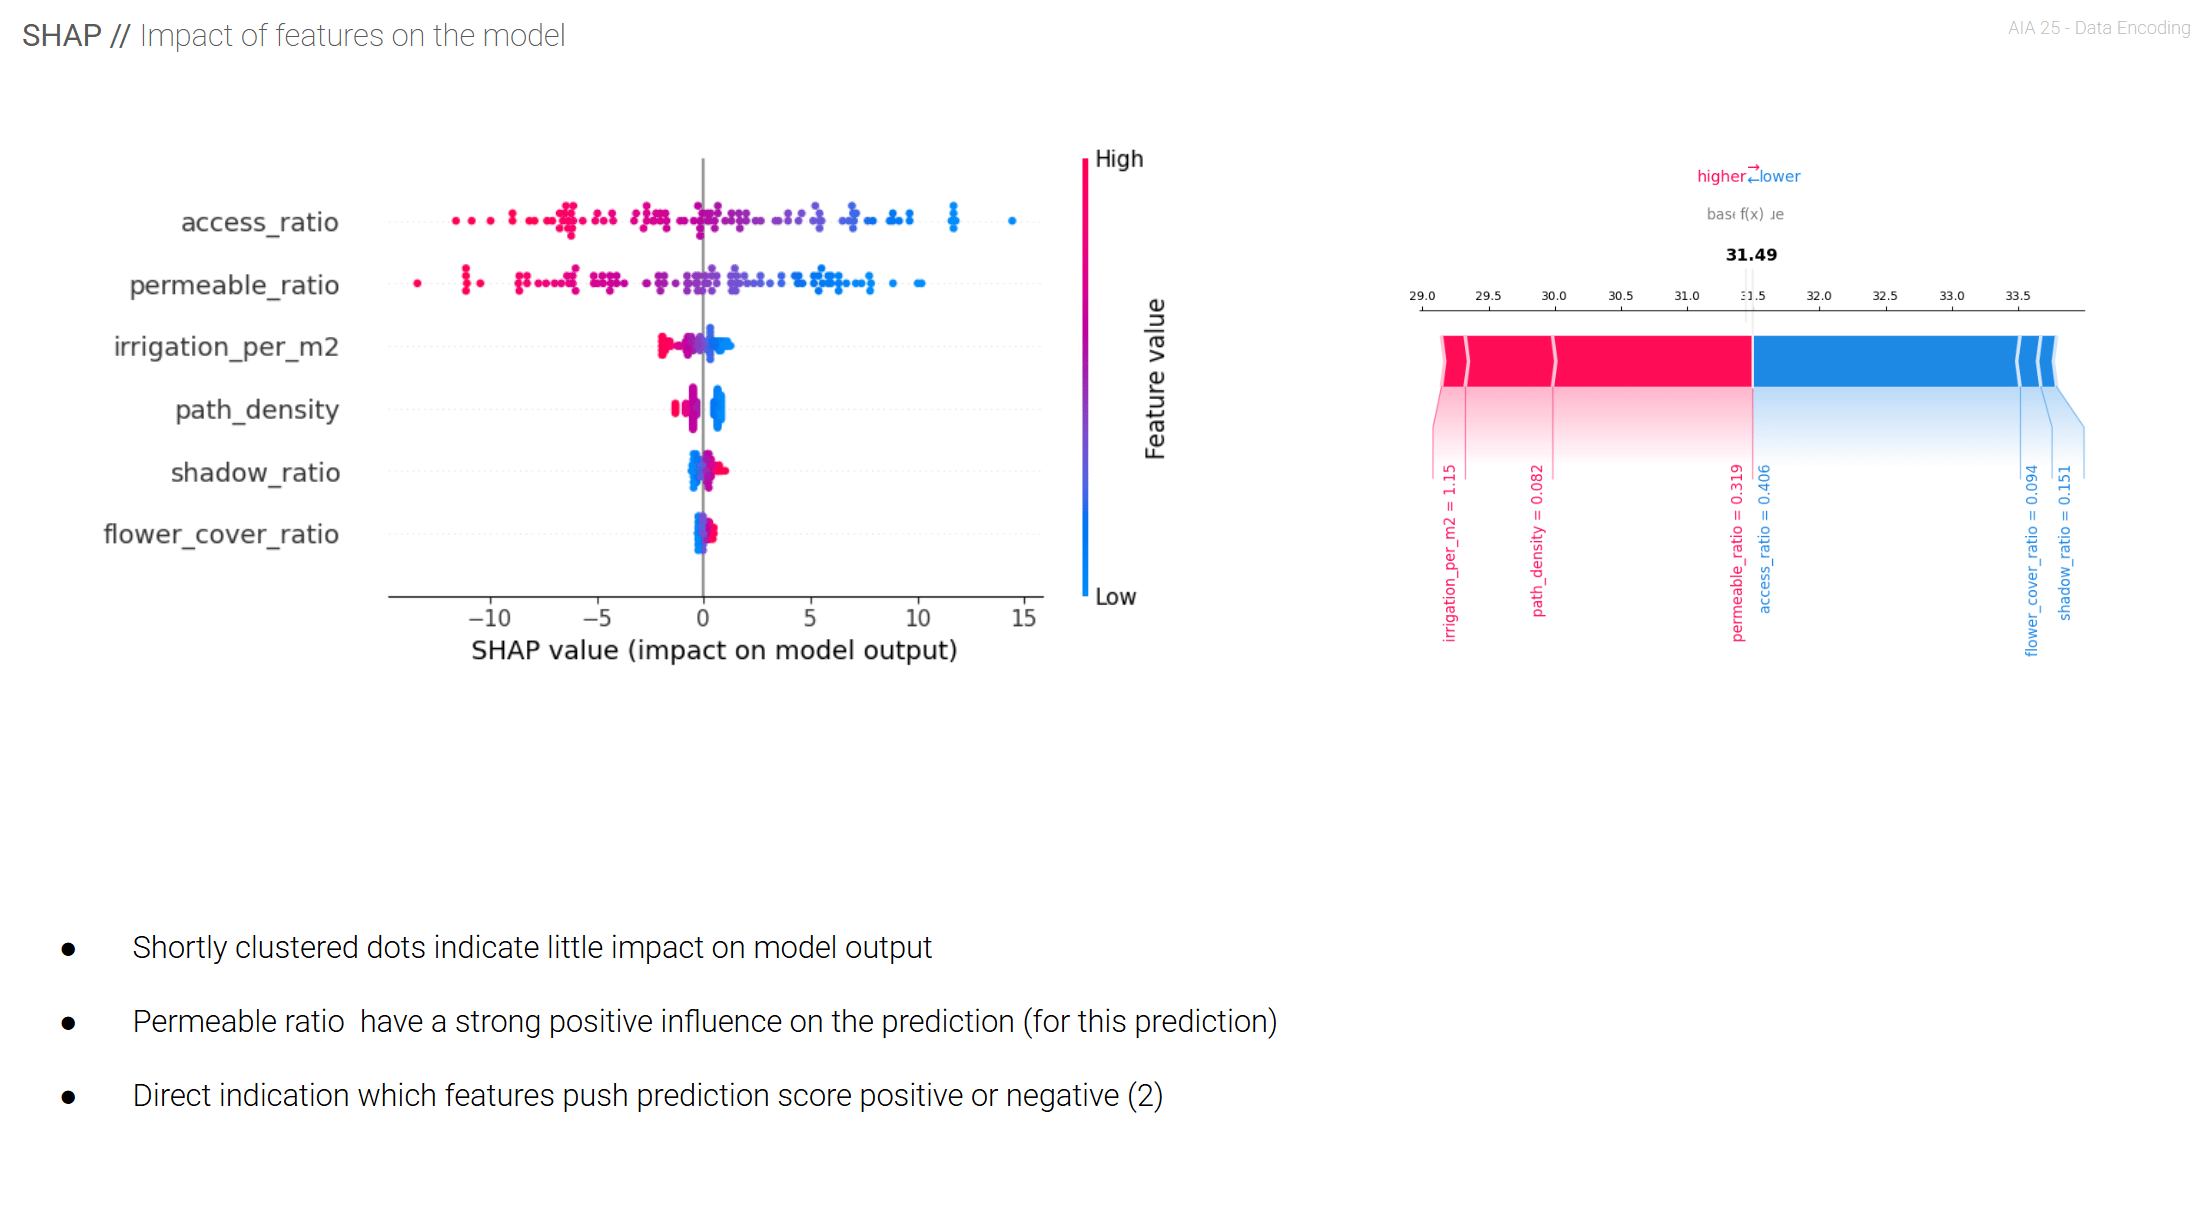
We applied SHAP (SHapley Additive exPlanations) to XGBoost, our best model. SHAP helped us see how each feature influenced predictions:
- Shadow ratio lowered UTCI—more shade means cooler spaces.
- Irrigation demand surprisingly raised UTCI, likely because wet surfaces trapped heat.
- Features like path density had minor impacts overall.
SHAP waterfall plots broke down individual predictions, showing how each feature’s value added or subtracted degrees from the average UTCI. This level of transparency helps designers understand why a design is comfortable or not.
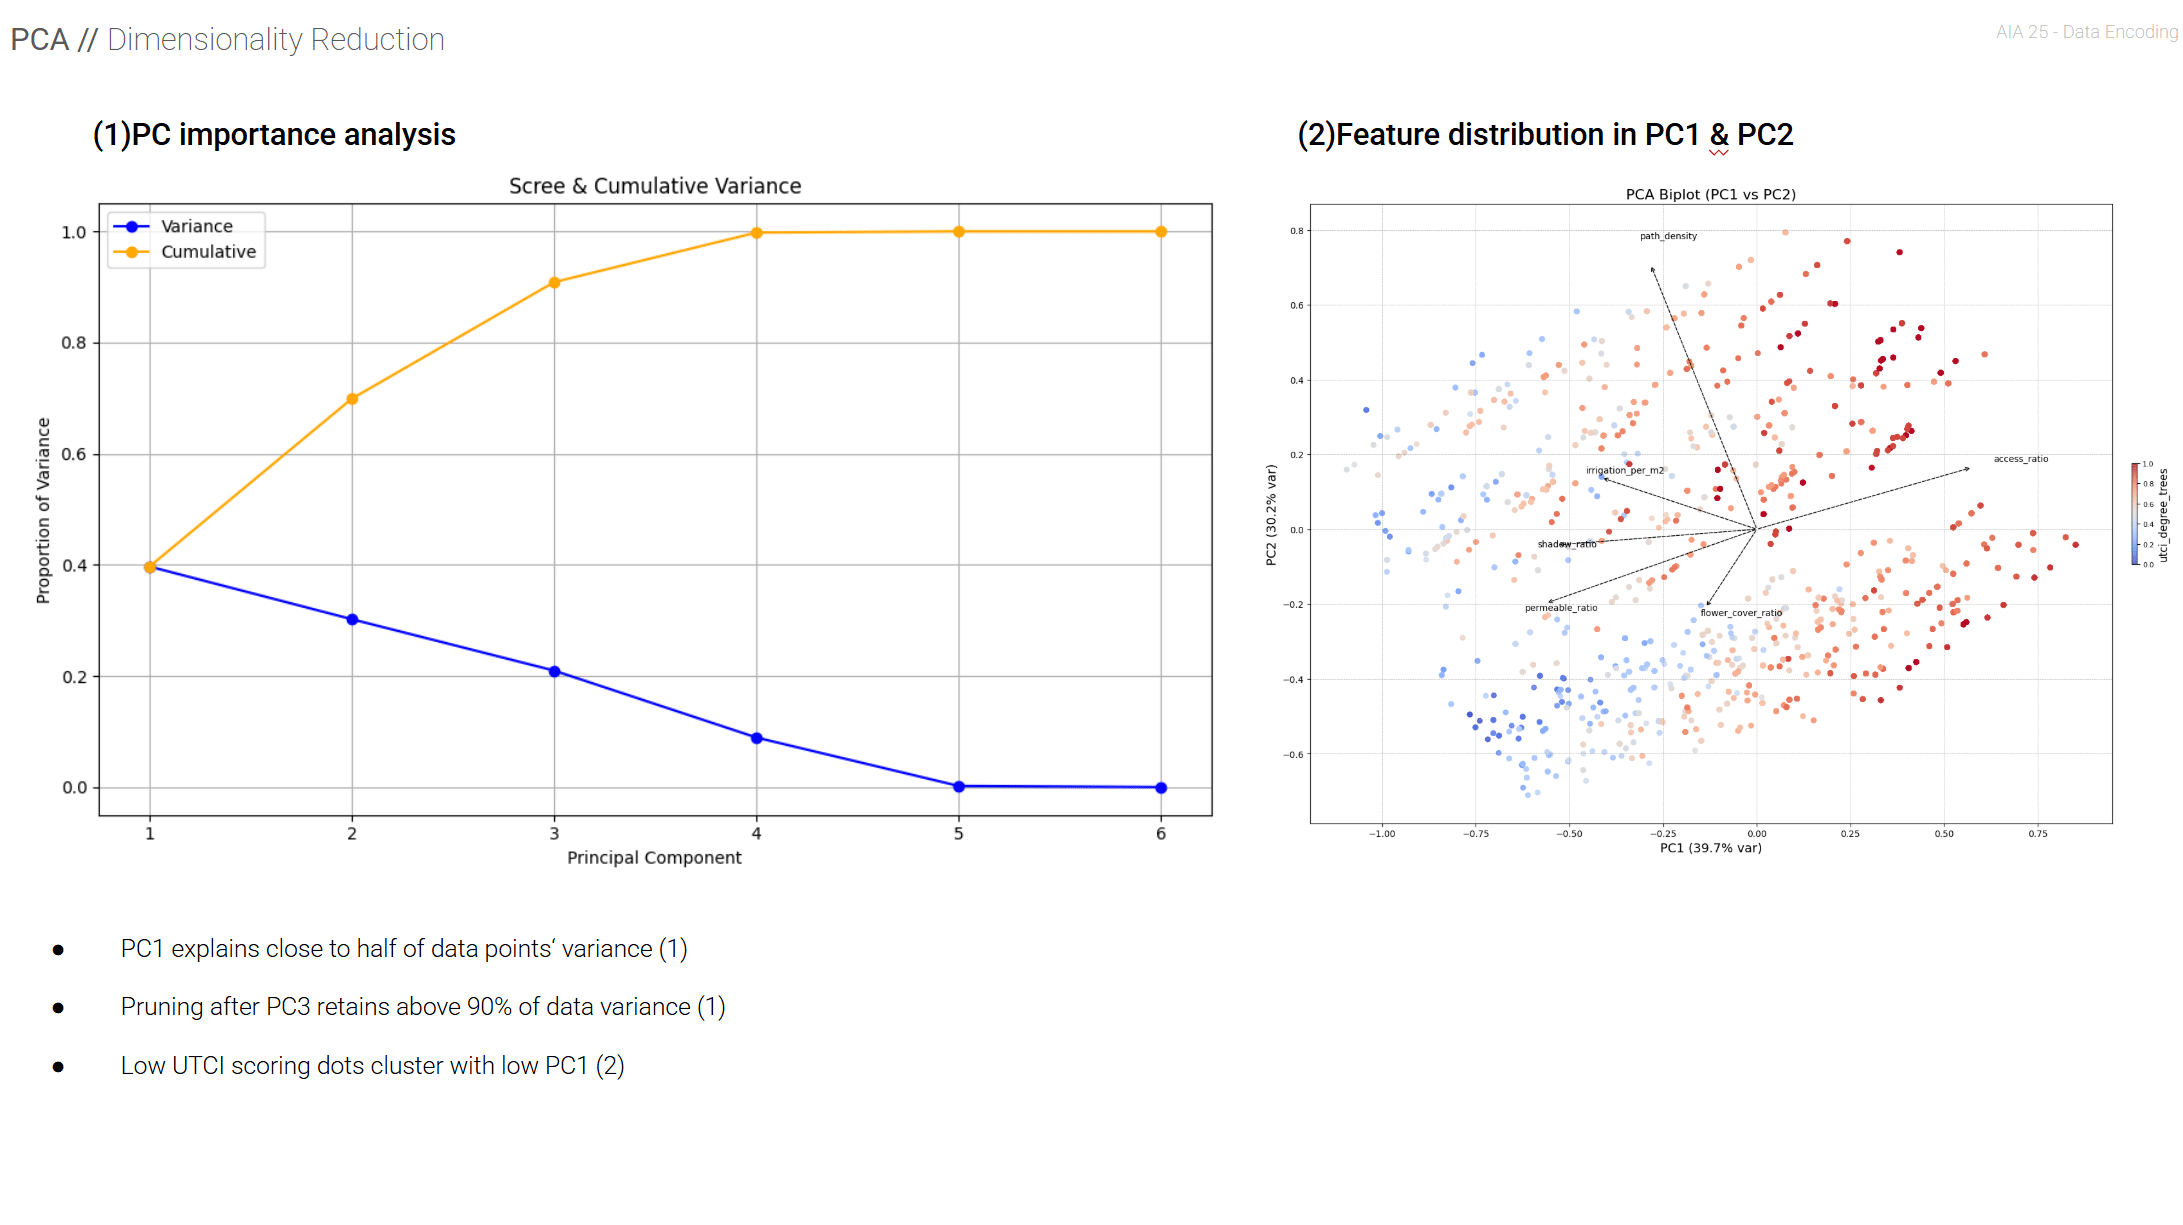
Exploring the Data Structure with PCA
Although our deployed model uses raw features, we ran Principal Component Analysis (PCA) as an exploratory step. PCA revealed that just three components captured over 90% of the variance in our data. The first component alone explained nearly half. PCA plots helped us see clusters of cool versus hot courtyard designs in two dimensions—a useful way to validate that our features carried distinct, meaningful information.
Real-Time Design Feedback in Grasshopper
To make our model usable for architects, we packaged it into a Grasshopper Python component. The tool:
- Reads six input features from the courtyard design.
- Scales them using the same MinMaxScaler as during training.
- Applies the Random Forest model to predict UTCI.
- Outputs the predicted UTCI instantly as designers adjust parameters.
This means architects can see the comfort implications of their designs long before running a full simulation—saving time and supporting informed decision-making early in the process.
The real advantage here is speed: compared to full Ladybug simulations, which can take minutes, this tool delivers real-time feedback — allowing thermal comfort to inform decisions from the earliest design stages.
To test generalization, we applied the models to unseen courtyard layouts on a 65×65 meter footprint, and to entirely new configurations, such as 105×105, 75×55, and 55×75 meters.
This showed the model can adapt well to new shapes and scales not present in the original training data.

Conclusion and Future Directions
In this project, we:
- Generated a large, varied courtyard dataset.
- Explored its structure with EDA, correlation matrices, pairplots, and PCA.
- Trained and compared four regression models.
- Applied SHAP to make predictions interpretable.
- Deployed a working tool for real-time design feedback.
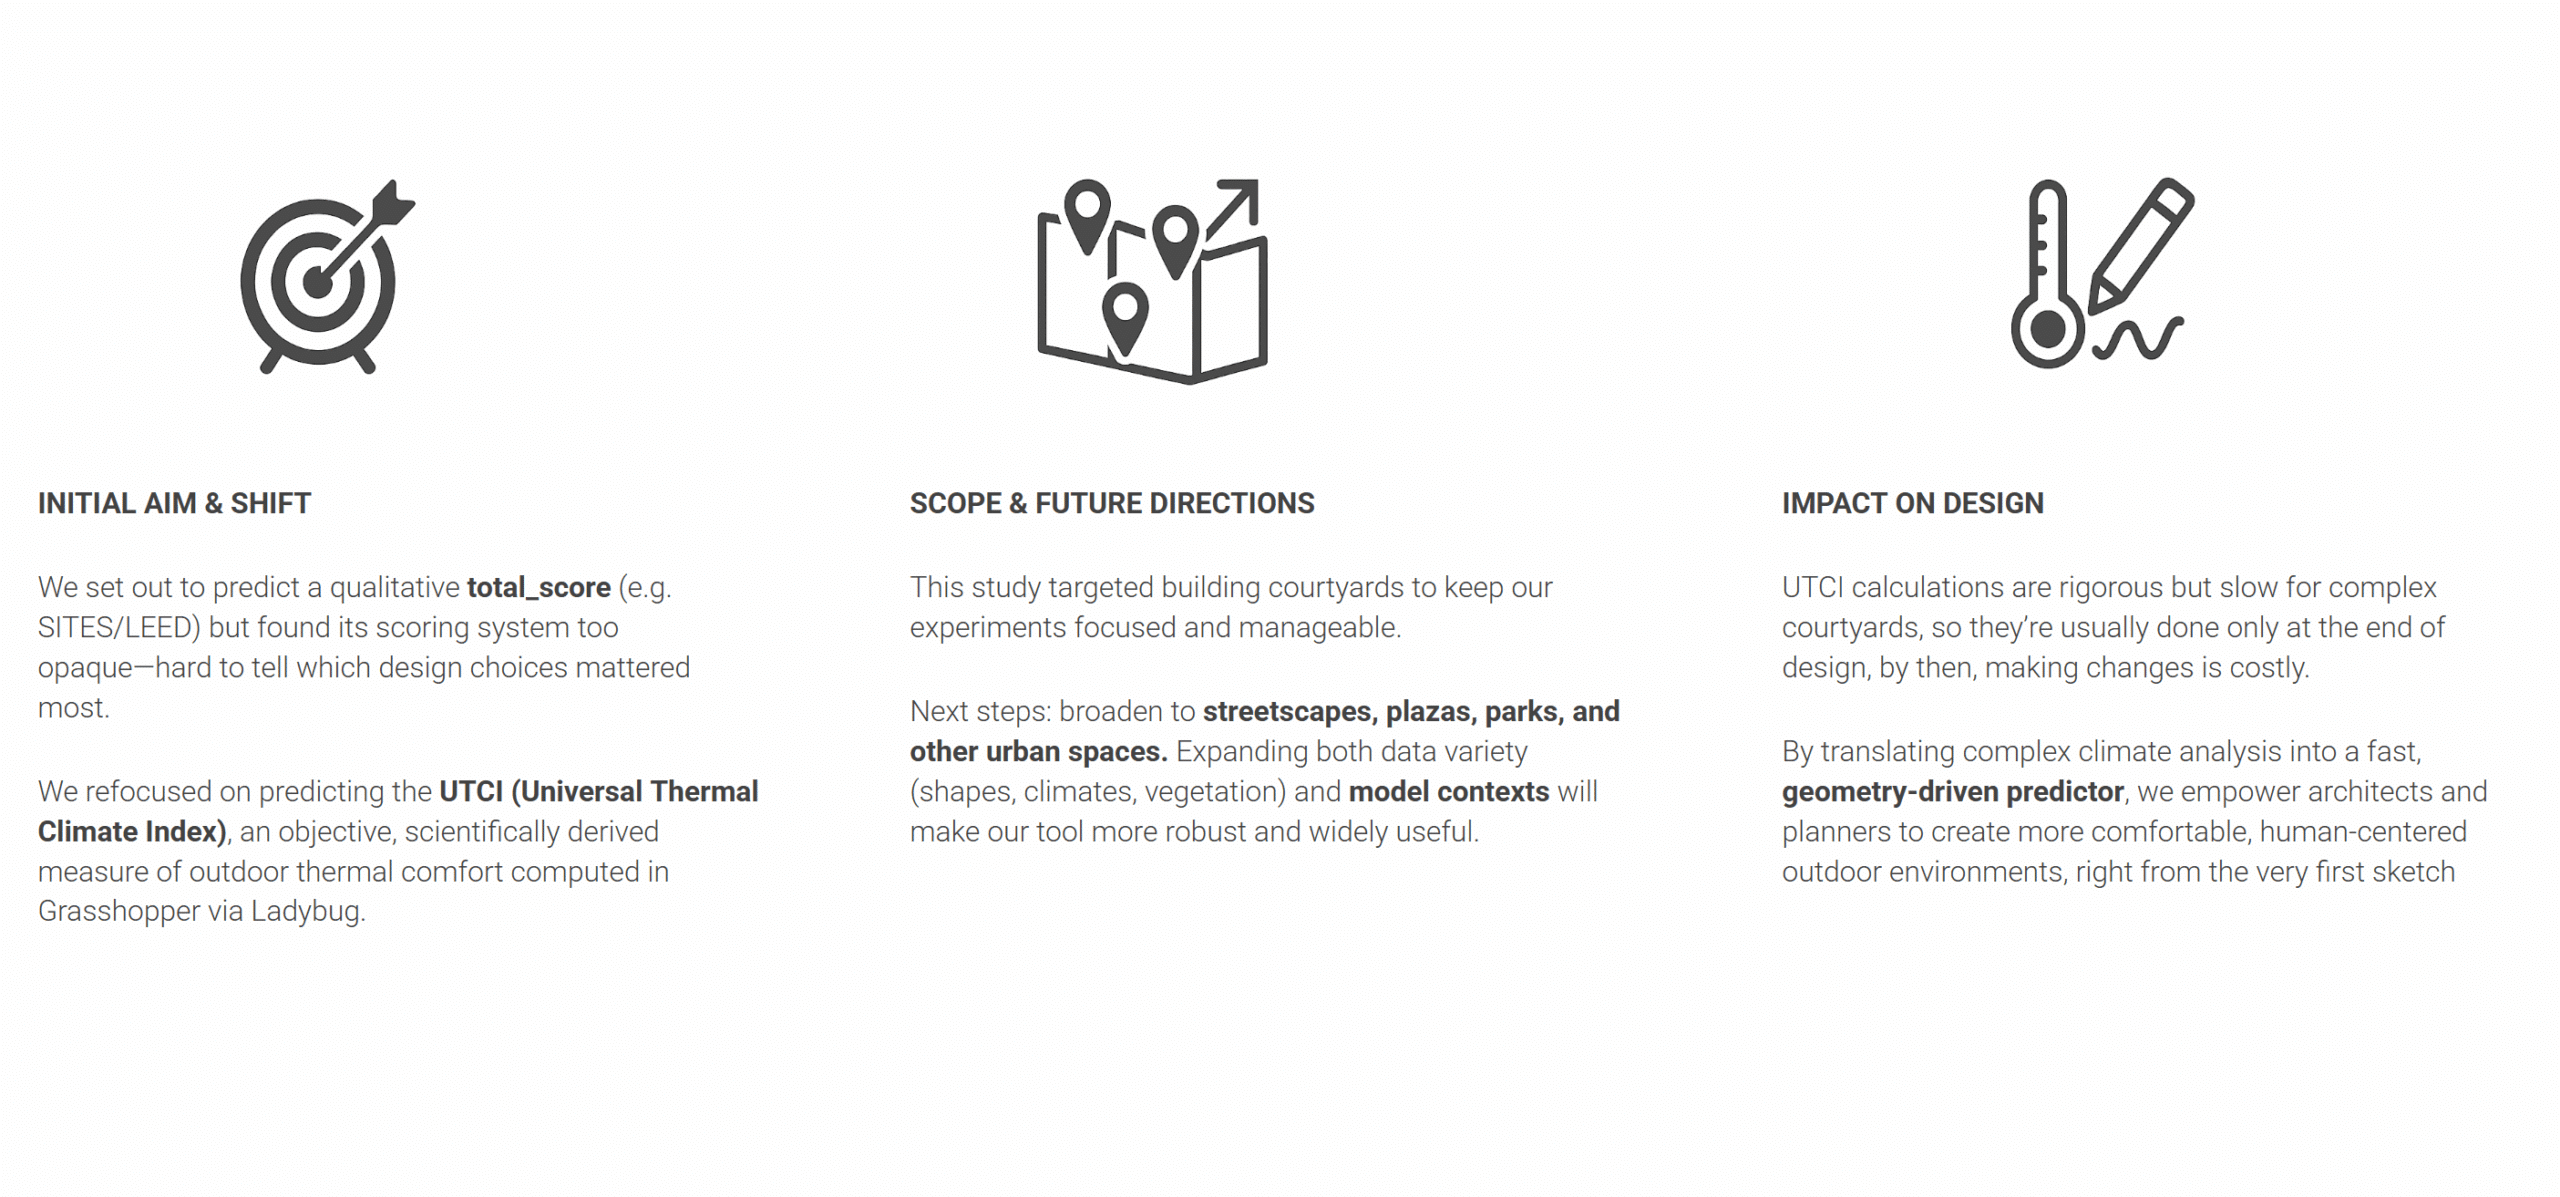
At the beginning, we aimed to predict a qualitative total score similar to what’s used in certification systems like SITES or LEED. But it was very difficult to understand which specific design choices were actually driving the score. That led us to change direction and focus instead on something more objective and measurable: the UTCI. That shift gave us a much clearer target and a more meaningful correlation.
For this first stage, we chose to focus only on building courtyards. This let us keep the scope tight, the variables controlled, and the model training more consistent. But looking ahead, we see a lot of opportunity to apply it to other types of urban space, like streets, plazas, and parks.And finally, we think this has a real impact on design practice. By turning UTCI into something that can be predicted instantly from geometry, we’re giving designers a way to respond to thermal comfort from the very start