
In modern residential architecture, acoustic comfort is as vital as daylighting or thermal performance. In our latest studio research at the Institute for Advanced Architecture of Catalonia, Group 09 tackled the challenge of mapping and optimizing sound behavior in homes using graph-based machine-learning workflows. Over the next five minutes, you’ll discover how we combined city-scale noise maps, IFC-based building models, Neo4j graph databases and Grasshopper deployments to turn raw acoustic data into actionable design intelligence.
The Design Problem
Residential interiors are dynamic sound environments: ambient traffic noise seeps in, voices reverberate down hallways, and high ceilings create lingering echoes. Yet architects rarely have tools to visualize how these acoustic stimuli connect and propagate through rooms, floors and façades. Our central question was simple but powerful:
“How can we graphically model and categorize the acoustic performance of interior spaces using machine-learning algorithms?”
Answering this meant defining key acoustic metrics, building a robust data pipeline and then applying graph-data-science techniques to uncover hidden comfort zones.
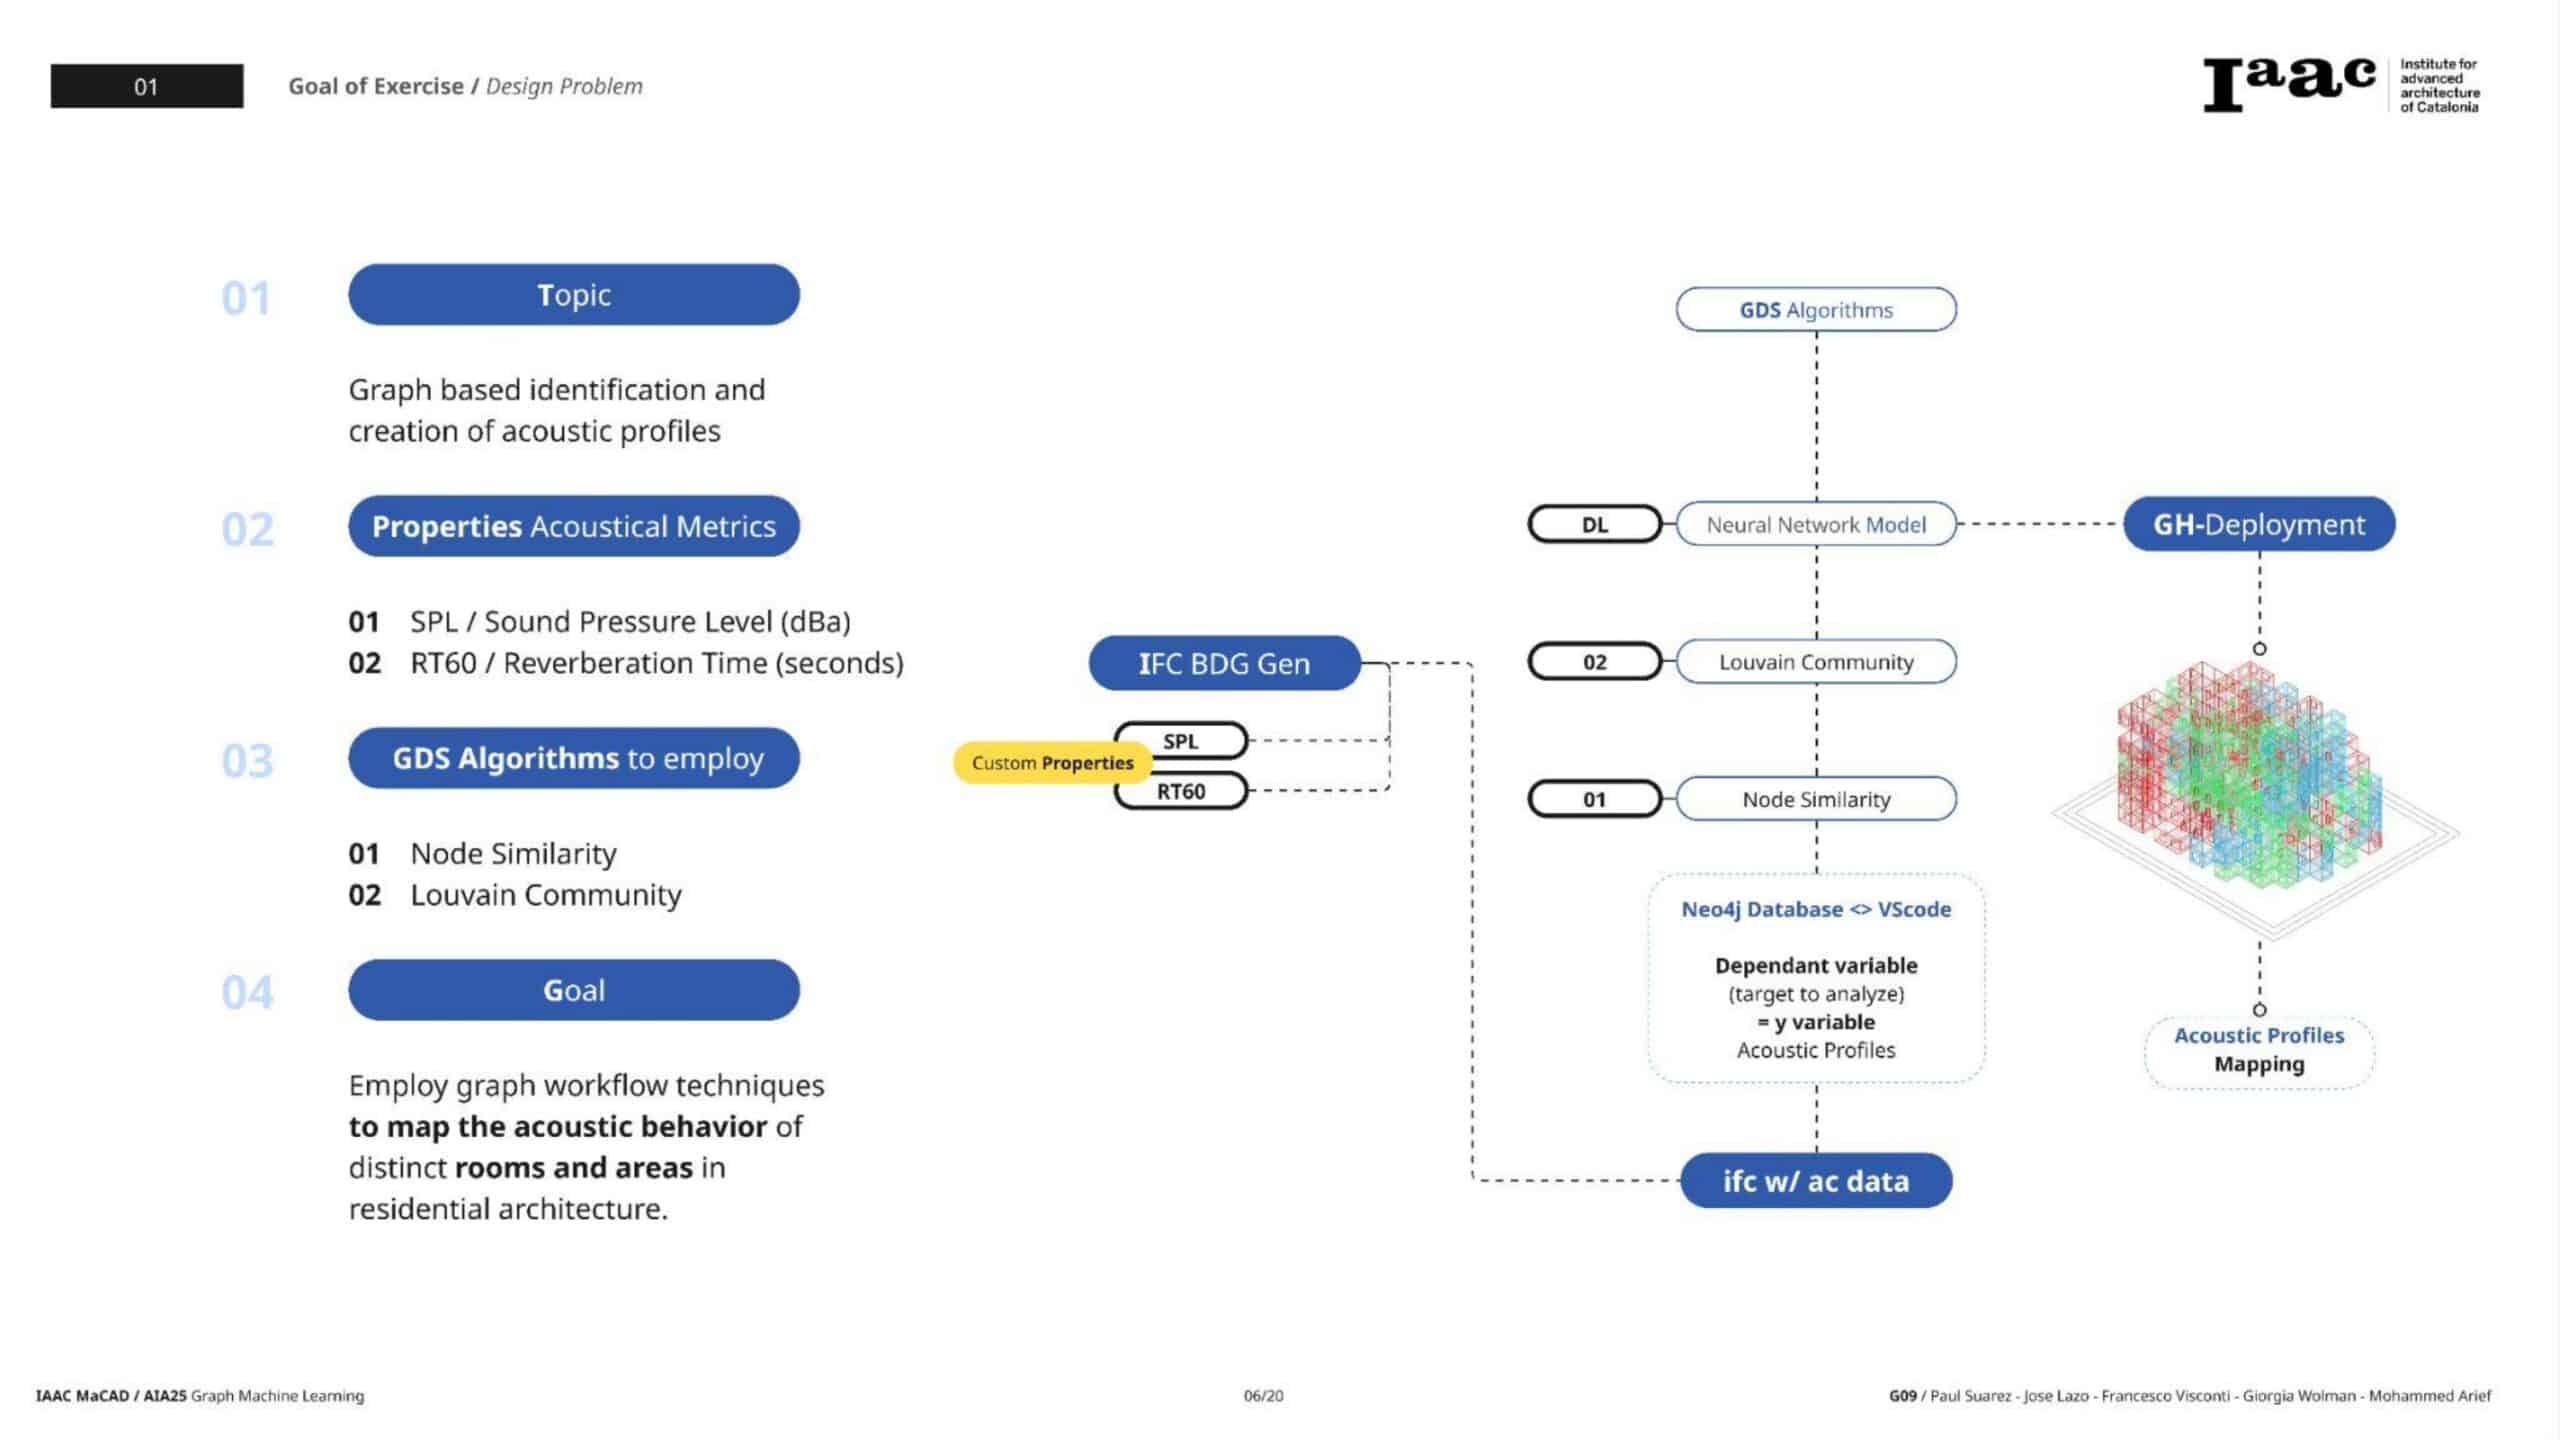
Key Acoustic Metrics
- Sound Pressure Level (SPL in dBA): the intensity of ambient noise, measured per room or grid cell.
- RT60 (Reverberation Time in seconds): the time it takes for sound to decay by 60 dB, calculated via Sabine’s formula.
We also defined a composite “Quality of Life” metric that combines SPL and RT60 deviations to quantify overall acoustic comfort.
Data Pipeline Overview
Our workflow unfolds in three scales:
- City Scale: We began with a Boston noise map (24-hour LAeq), extracting average dBA levels for each grid cell.
- Room Scale: Using BIM Vision and IFC models, we extracted rooms, walls, doors and material properties. Each IFC space became a node enriched with SPL and RT60 values.
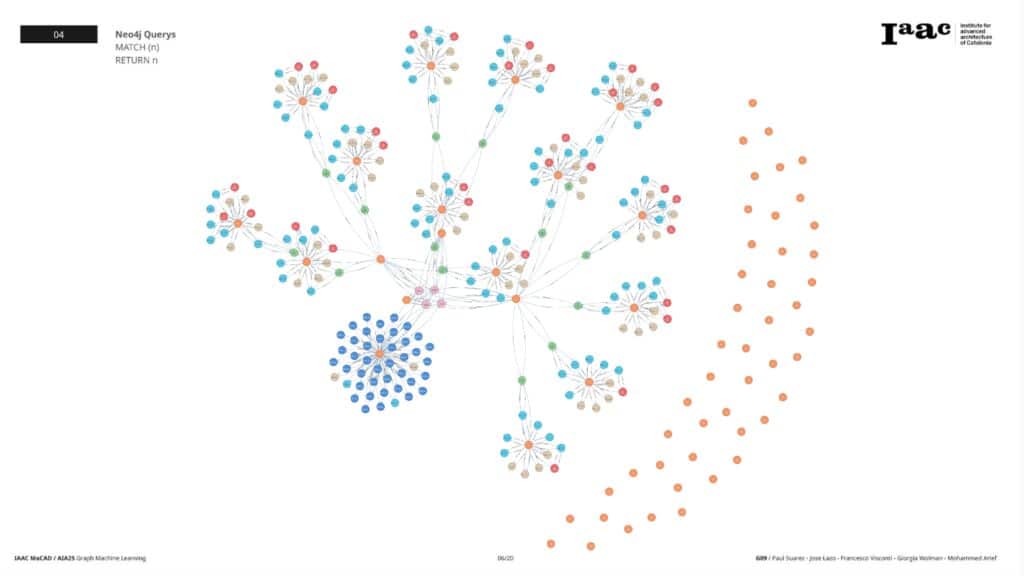
- Graph Scale: All nodes and their spatial relationships were loaded into a Neo4j database. “SURROUNDS” and “RELATED_TO” edges mapped adjacency and connectivity.
Graph-Data-Science Methods
With our full building graph in place, we applied two core algorithms:
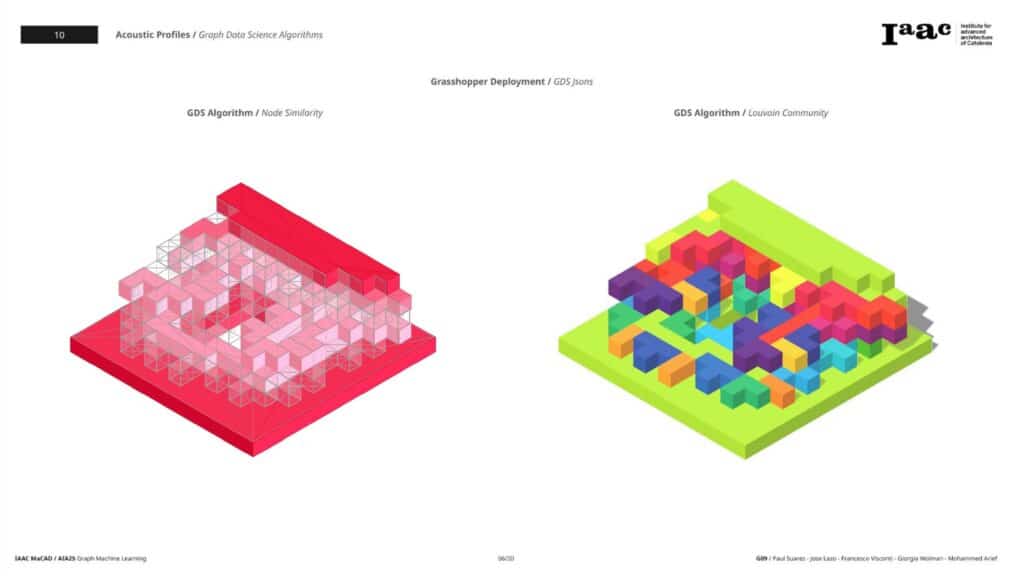
- Node Similarity: Clusters rooms sharing similar SPL and RT60 profiles, revealing acoustic “siblings” regardless of location.
- Louvain Community Detection: Identifies modular acoustic communities based on network connectivity—ideal for zoning and early-stage layout decisions.
We also ran shortest-path analyses to trace sound-transmission routes, critical for multi-story or high-rise buildings where vertical propagation affects comfort floor-to-floor.
Visualization & Deployment
To make data tangible for architects, we deployed our results in Grasshopper:
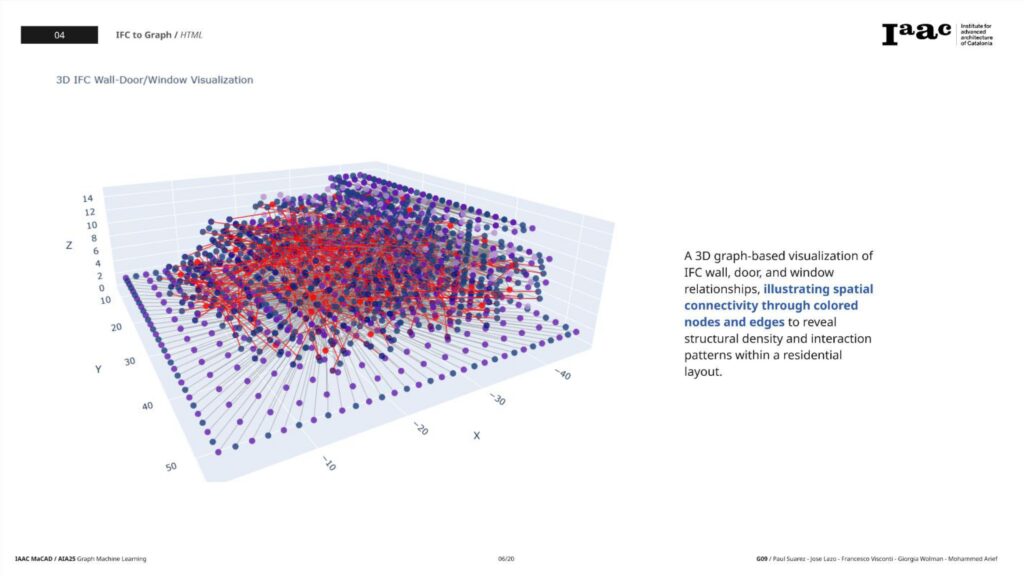
- 2D/3D IFC Graph Viewer: Color-coded nodes for rooms, doors, windows and slabs; edges represent sound flow and adjacency.
- Acoustic Zoning Overlays: Louvain clusters displayed as transparent zones over plan and section.
- Interactive Queries: Live Cypher queries in Neo4j feed geometry updates back into Rhino/Grasshopper, enabling real-time acoustic sensitivity tests.
Designers can now ask “What if?” at any stage: What if I move the living room? What if I swap floor materials? The graph updates instantly, recalculates clusters and visualizes new comfort zones.
Insights & Takeaways
- Rooms with similar furniture and finish materials often cluster acoustically, even when physically distant.
- Vertical sound pathways in multi-storey flats can create unexpected noise stacking, identifiable via shortest-path graphs.
- Early zoning based on community detection can inform room-adjacency decisions that dramatically improve comfort.
Above all, graph-driven workflows turned hidden acoustic interdependencies into visible, data-driven insights—bridging the gap between environmental analysis and spatial design.
Conclusion
“Graph Machine Learning for Acoustic Profiles” demonstrates a new paradigm in architectural practice: one where data science, machine learning and graph theory are woven into the very fabric of design. By modeling SPL, RT60 and their interconnections as a living network, architects gain a powerful toolset to simulate, predict and optimize acoustic comfort—transforming noise into design intelligence.
Ready to explore acoustic zoning in your next project?
