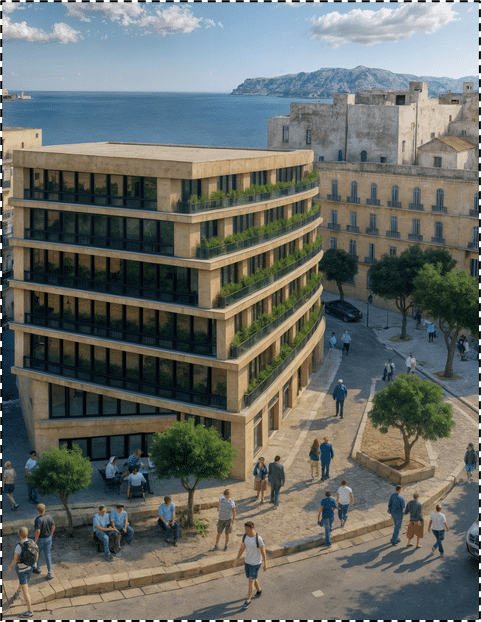
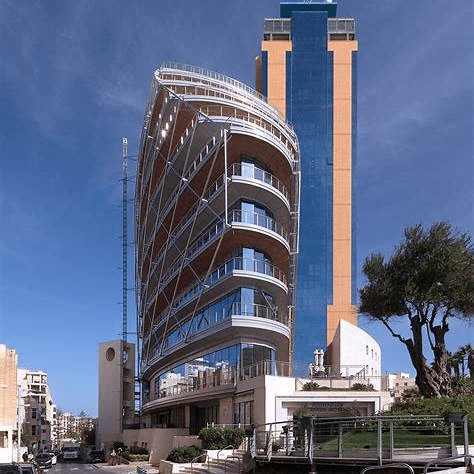
Saint Julian’s City in Malta
Saint Julian’s is Malta’s nightlife and tourism epicenter (Paceville), causing extreme population density and infrastructure strain in summer.
Its coastal development makes it highly vulnerable to climate change impacts like sea-level rise, while its energy-intensive industry contributes to Malta’s emissions.
- Population: 23,000
- Area: 6.8 sq km
- Density: 3500/sq km

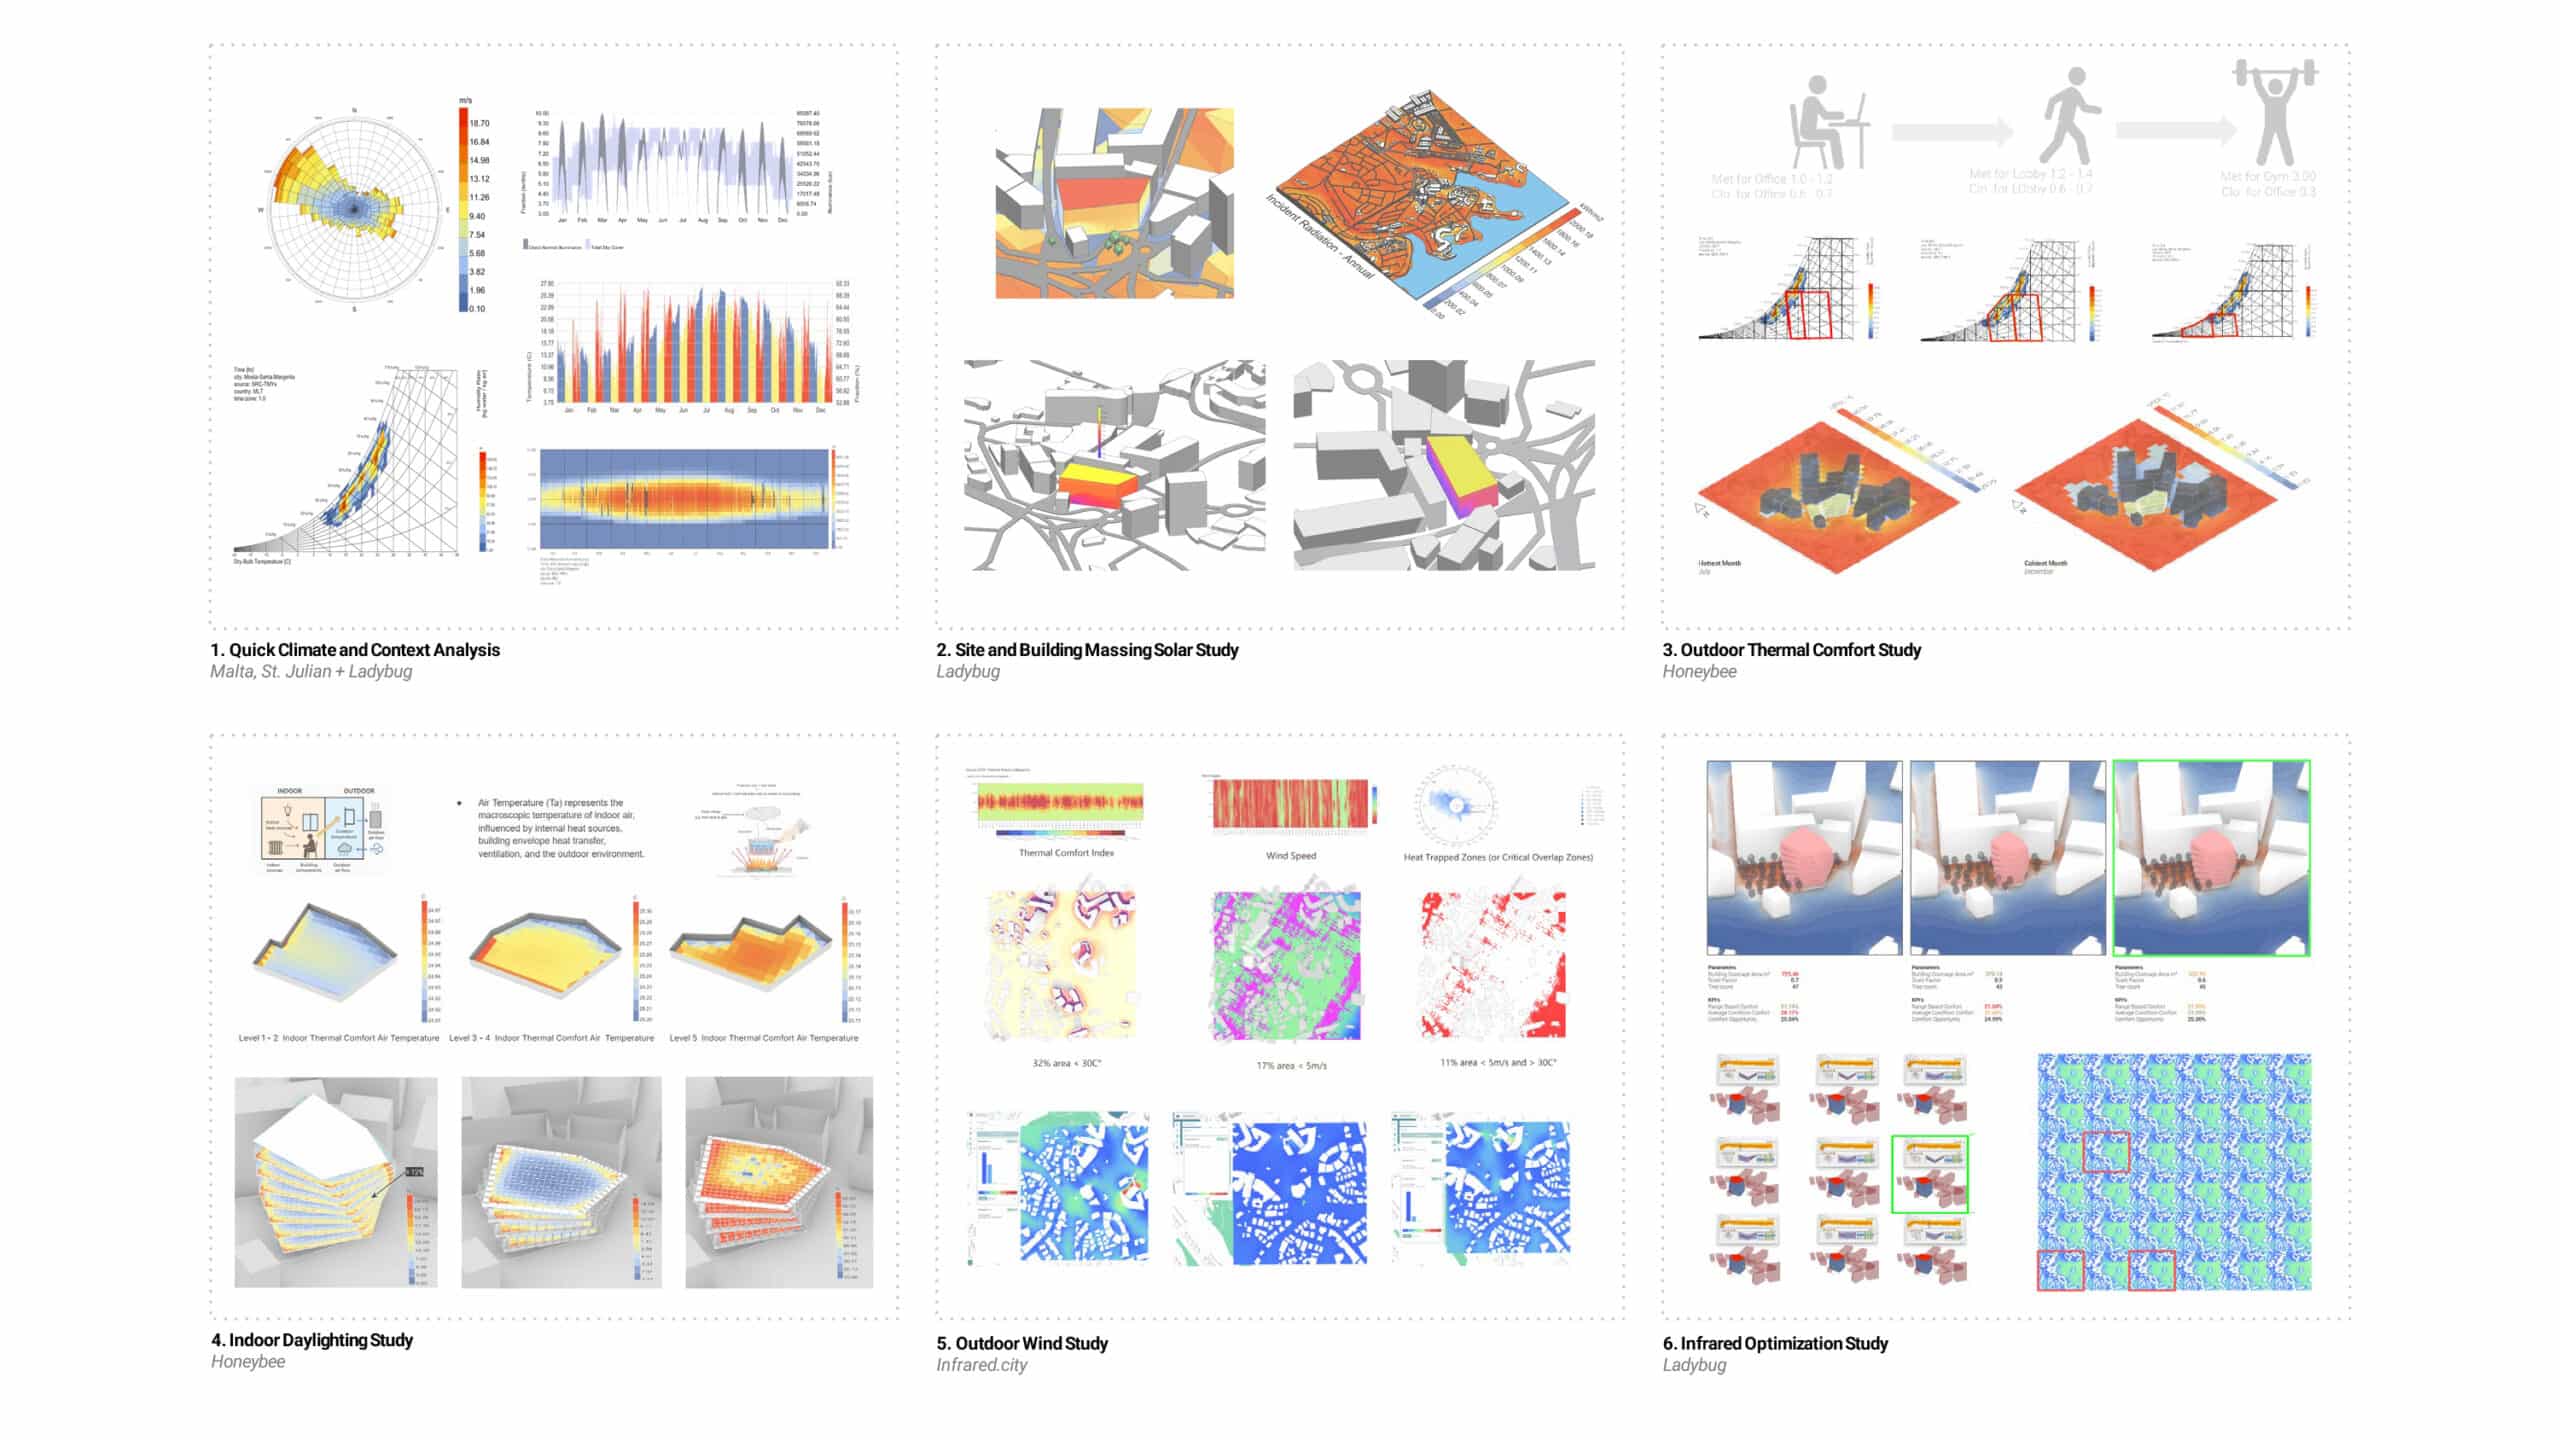
Environmental Analysis to Inform Design
Environmental Analysis Workflow
The workflow consisted of selecting the St. Julian’s area in Malta to perform a series of environmental analyses using various computational tools. This process began with Grasshopper definitions utilizing plugins such as Ladybug and Honeybee, and continued through to real-time AI analysis and optimization using Infrared.city
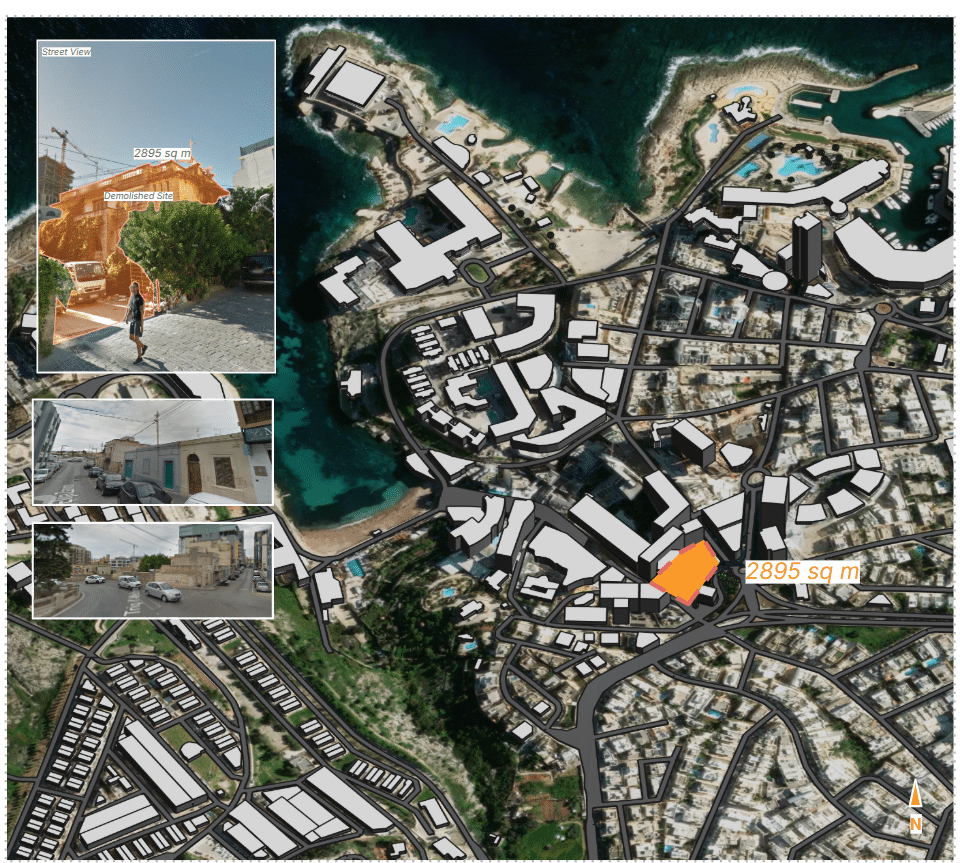
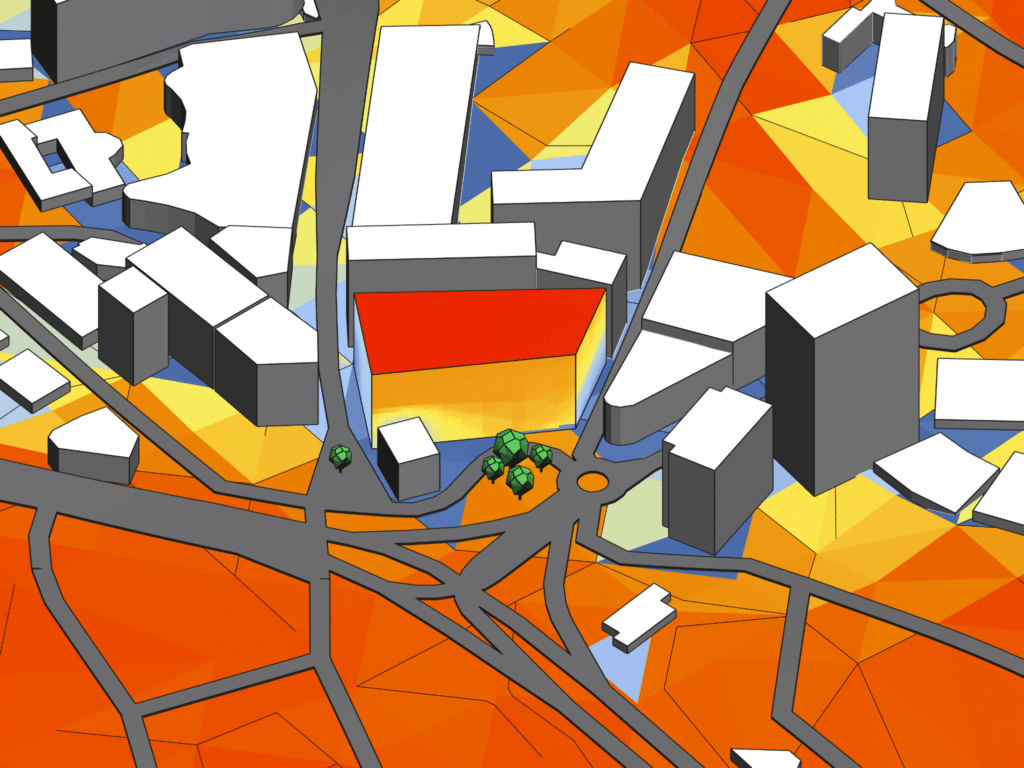
Context Analysis | Actual Conditions
9 Triq Elija Zammit, San Ġiljan STJ 3150, Malta
A plot of land with high urban significance that also faces significant climatic challenges.
A. Our analysis investigates how Malta can mitigate ground temperature increases that cause cable failure and electricity outages.
B. We analyzed the actual conditions that enhanced this phenomenon. We questioned ourselves on how to mitigate these extreme conditions by leveraging temperature differences.


Environmental Analysis
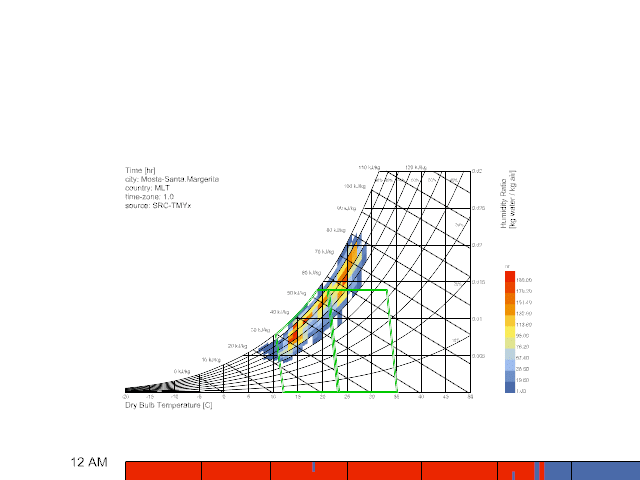
Dry-bulb | Dew point temperature
The highest hourly density (see “hr” bar on the right) is concentrated at 18–28 °C with medium-high humidity. It is necessary to dehumidify, not just lower the temperature. In winter there are mild temperatures but high humidity, which increases the risk of condensation.
Dry-bulb temperature
- Minimum: ~8–10 °C
- Maximum: ~30–32 °C
Dew point temperature
- Minimum: ~7–9 °C
- Maximum: ~20–22 °C

Environmental Analysis Conclusions
Climate Analysis Conclusions
The optimal strategy is a defense-in-depth approach: block winter wind and summer heat gain by restricting the western façade, maximizing eastern exposure for daylighting, and actively dissipating solar heat via ventilated roofs and cool surfaces.
In essence:
– Summer: Harvest the solar resource for energy (PV) and mitigate the heat gain (shading/cooling).
– Winter: Harvest the sun for light and passive heating while defensively blocking strong west winds to maintain thermal comfort.
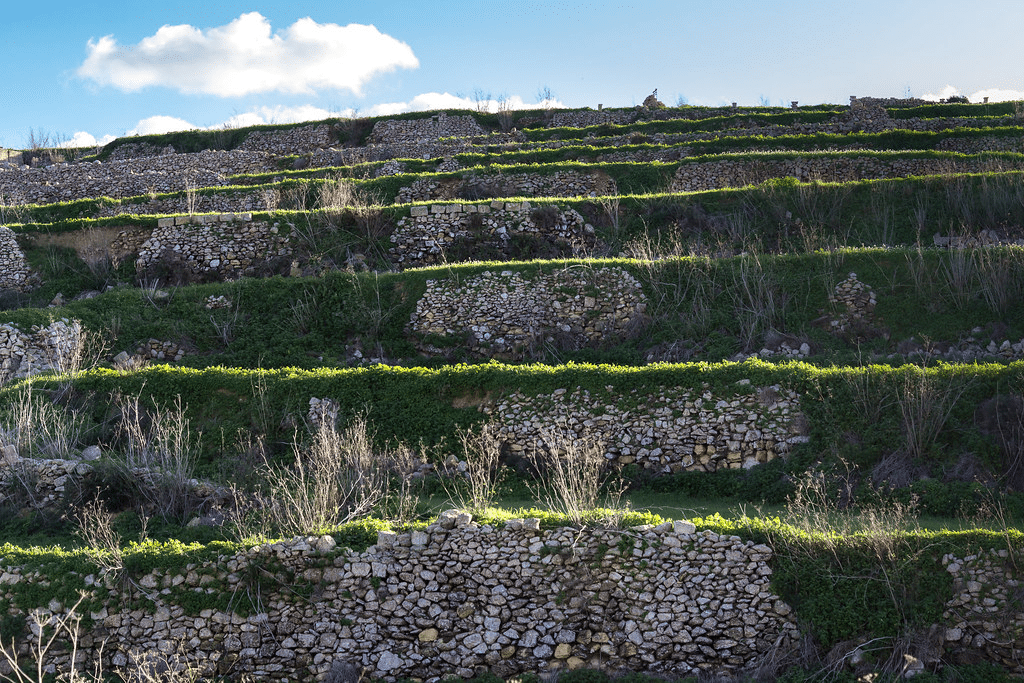
– Year-Round: Use landscaping and surface treatments to improve the microclimate
Variables
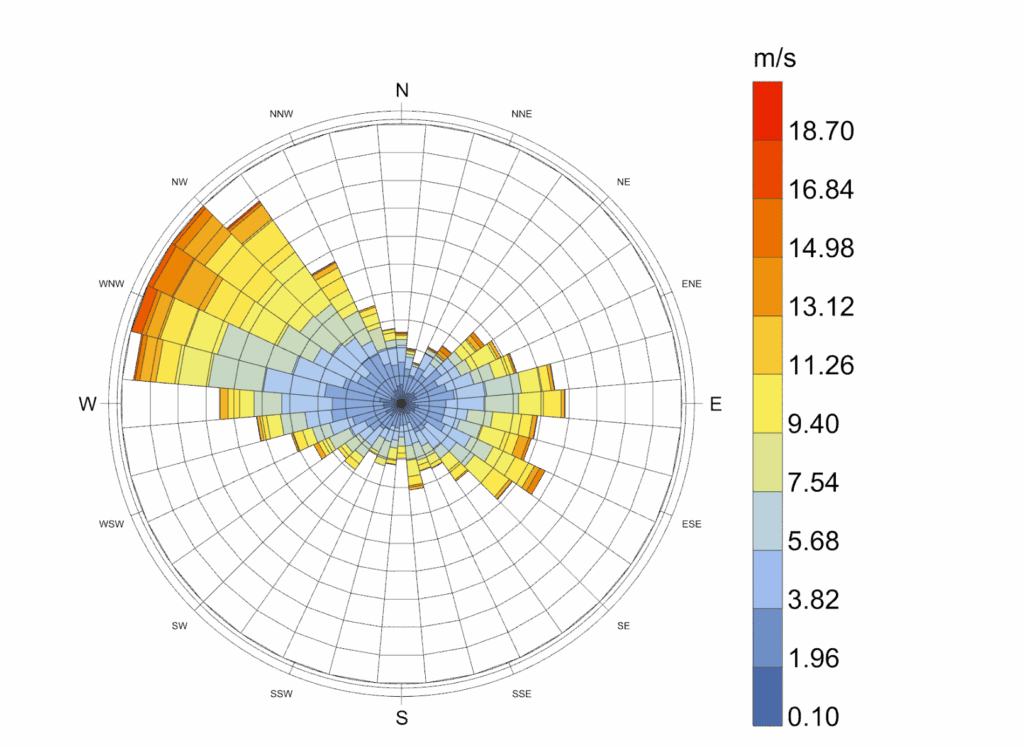
Wind
Environmental Insight
13.22 m/s max (winter)
8.3 m/s min (summer)
Strategies
Cross-ventilation W↔E; protect W–NW façades with porous screens.
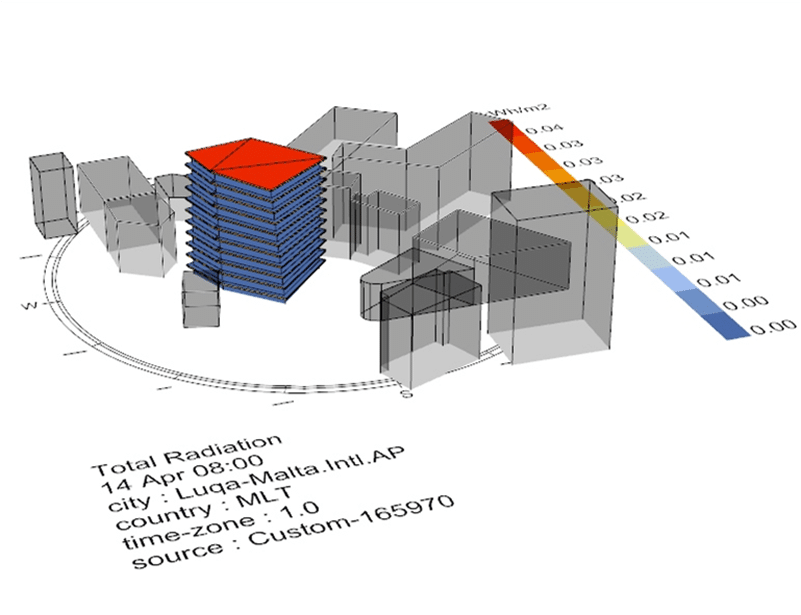
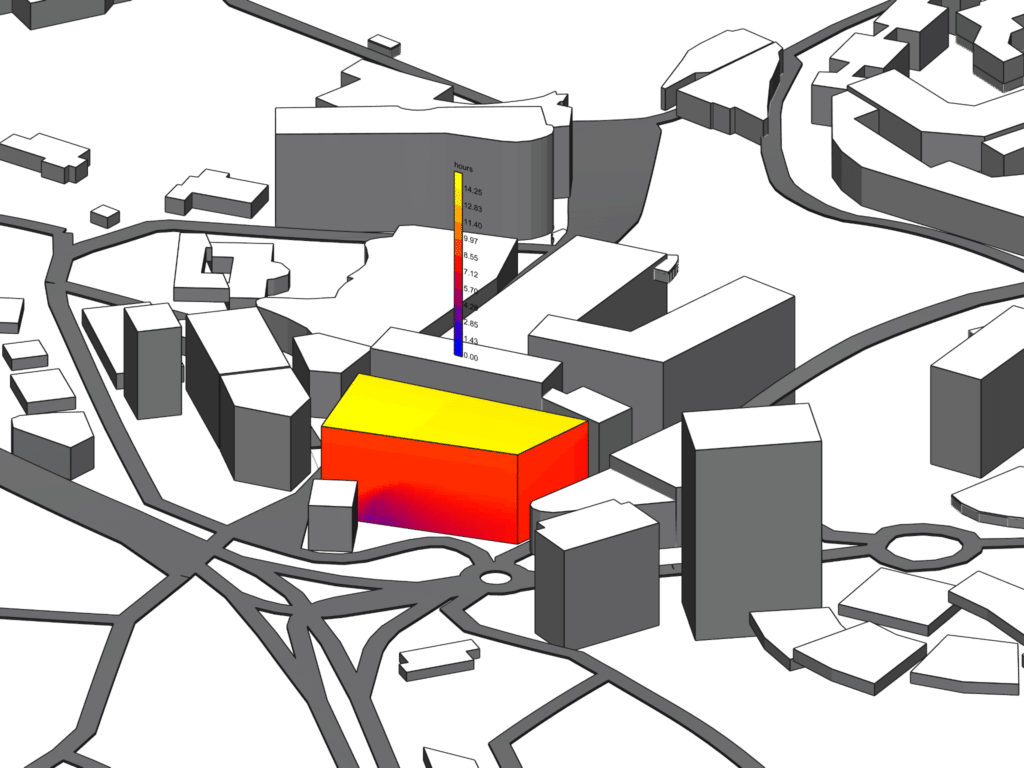
Solar Radiation
GHI 27.8 kWh/m² (summer)
13.5 kWh/m² (winter)
Seasonal PV; south overhangs + E/W vertical fins; cool roofs + continuous shade
Temperature & Humidity
27.8 °C max | 6 °C min ·
≈ 70 % RH
Night ventilation + green roofs and vegetation for microclimate cooling.
Sky Cover
99 % (Jul) | 59 % (Oct)
Diffuse light Mar–Sep; passive solar gain Oct–Feb.
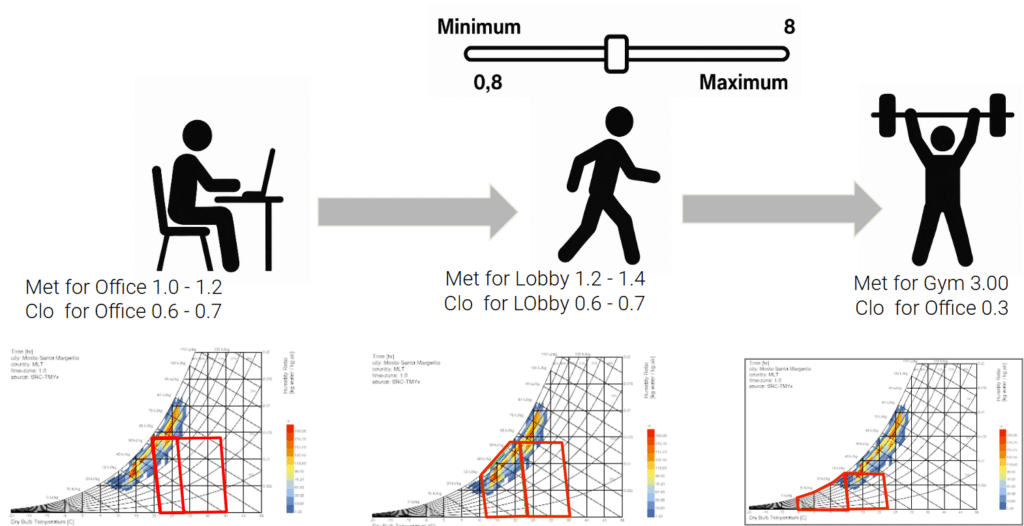
The Metabolic Diagram
Metabolic Rate & Clothing Insulation Values for Malta
Thermal Implication
- People mostly seated → internal gains are low, cooling and air movement are required even in winter.
- Transitional space → medium activity; cross-ventilation and shading reduce heat discomfort.
- Intense activity; body heat dominates comfort balance → requires natural air renewal and radiant heat dissipation rather than insulation.
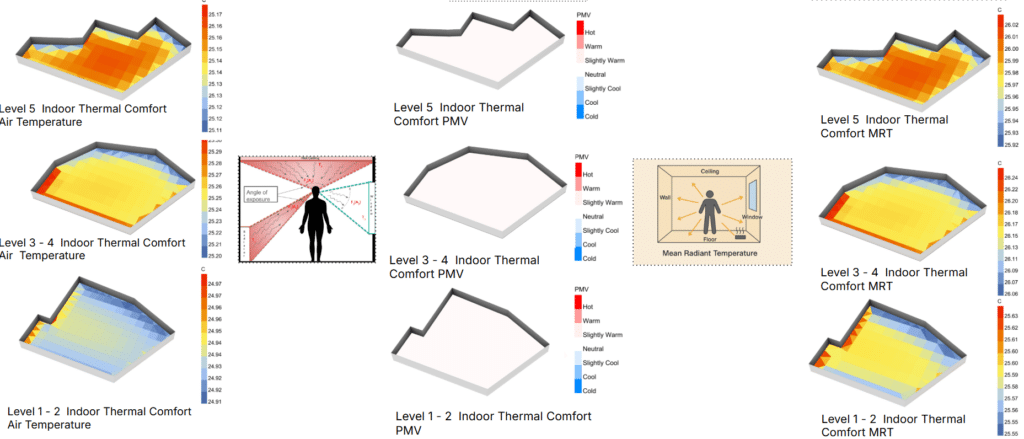
Indoor Thermal Comfort
Air Temperature (Ta) represents the macroscopic temperature of indoor air, influenced by internal heat sources, building envelope heat transfer, ventilation, and the outdoor environment.
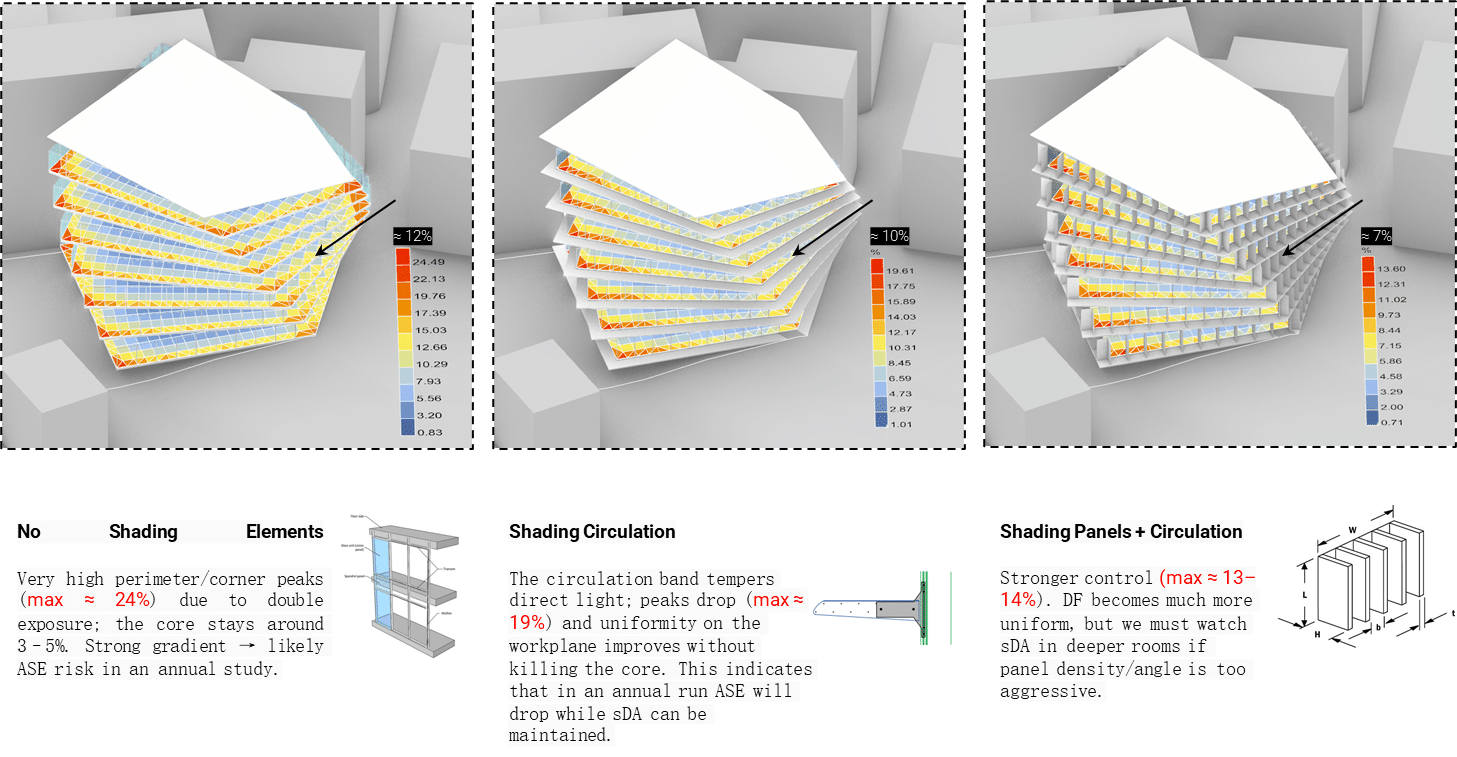
Parametric Model 7 Daylight Factor | Shading by Rotation
Shading Parameters
– We currently utilize a parametric model that enables us to achieve the desired shading results by adjusting several key parameters. These include: the number of levels, the rotation angle of each floor plate, the dimensions of exterior corridors, the quantity of window treatments (or glazing), and the dimensions of the shading elements.
Without Floor Rotation
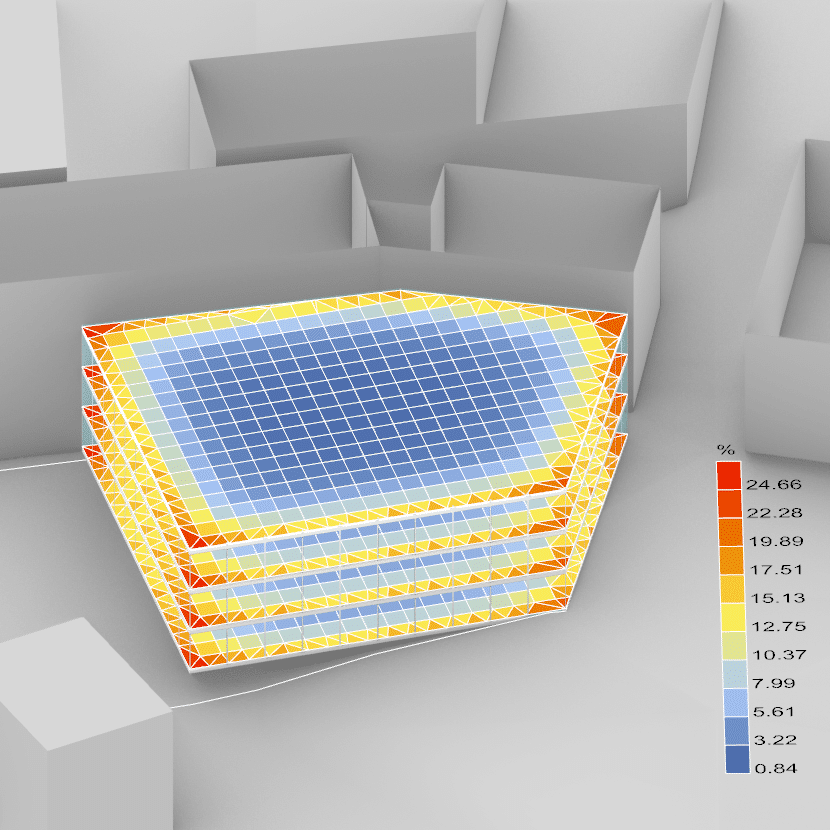
– What we see? Without rotation, perimeter hotspots peak around 13.8% DF (color scale up to ~24.7%).With 8° rotation, those edge hotspots drop to ~9.3% DF (scale up to ~23.2%), and the transition to the core is smoother.”
– So what (design impact) Rotation reduces peaks and improves uniformity, which should lower ASE in annual studies without killing useful daylight in the interior.
With Floor Rotation of 8°
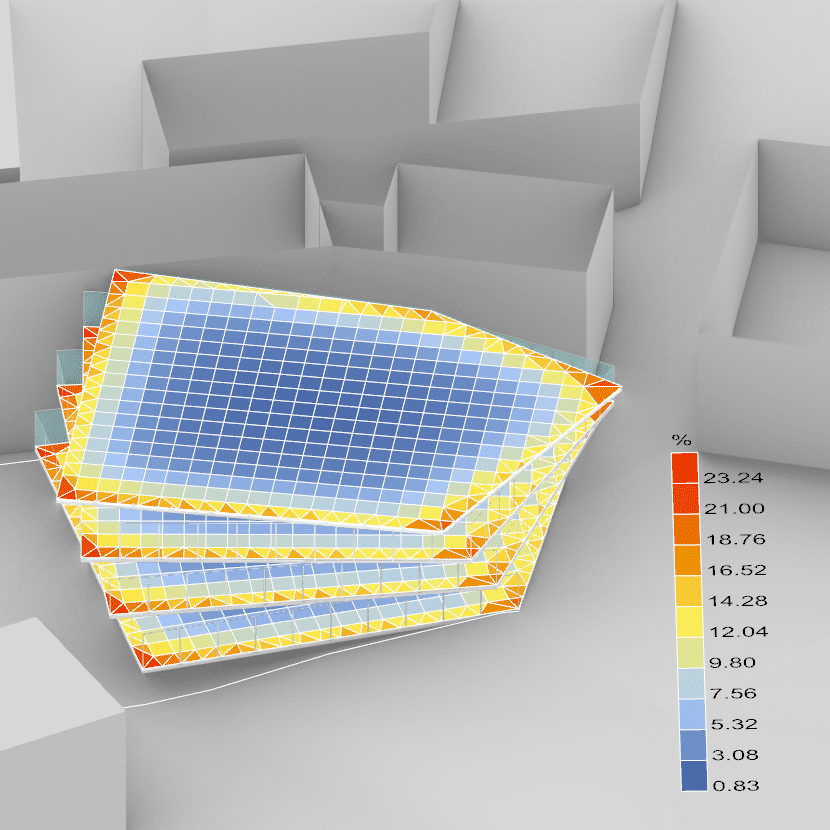
– What changed? We kept the same model, context, workplane height, grid spacing, materials and glazing. The only change is a floor rotation of 8°.”
– Why it happens? The staggered slabs create self-shading from floor to floor, cutting high-angle diffuse contributions at the most exposed edges while preserving the core.”
Non Cloudy Sky View 4.20%
– What changed? we compared Sky View under non-cloudy vs cloudy skies with the same model, context and sensor grid.
– Read: the average drops from 4.20% to 3.39% (≈ 19% lower) under cloudy. The spatial pattern holds: edges/corners see more sky (peaks ~12–13%), the core is blocked by overhangs, stacked slabs and neighbors.
Cloudy Sky View 3.39%
– Meaning: Geometry rules. Even in sunny Malta, with such limited sky access the core needs passive tactics (high reflectances, light-shelves, atrium/skylight) more than just bigger windows.
– Design: keep rotation/self-shading to tame edge peaks; to lift core daylight, prioritize top-light (atrium) or trim overhang depth where Sky View is lowest.
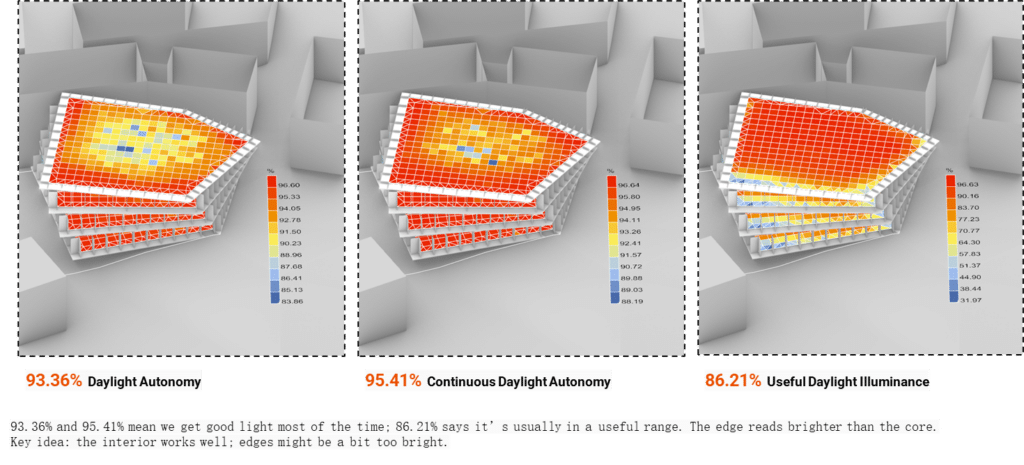
Daylight Factor | Shading Elements
Average Annual Light
93.36% and 95.41% mean we get good light most of the time; 86.21% says it’s usually in a useful range. The edge reads brighter than the core.
Key idea: the interior works well; edges might be a bit too bright.
Climatic Context & Seasonal Mismatch
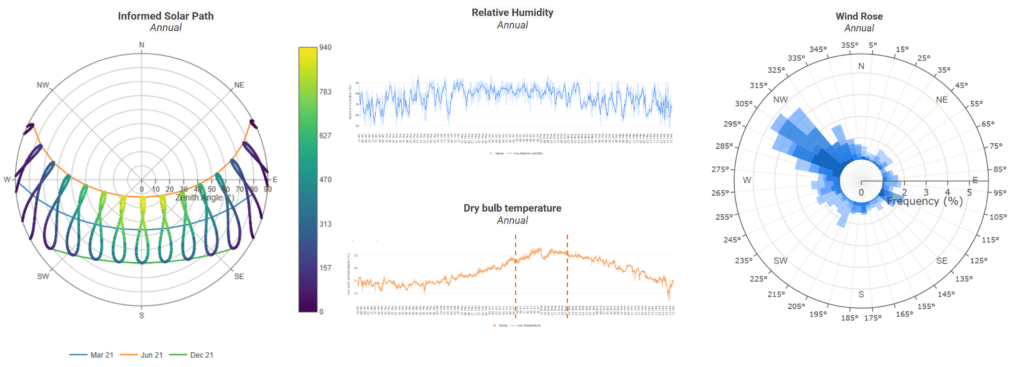
Our analysis shows solar irradiation peaks in September, with the intensity rising sharply from May. Critically, cloud coverage is lowest during the peak month, while the initial high-irradiance period (May to July) benefits from greater natural cloud protection.
The hottest months are July and August, with average temperatures typically ranging from 22 to 28 °C.
Conversely, the coldest period is from December to January, when temperatures generally settle between 8 to 16 °C.
Wind analysis shows a clear predominance from the Northwest at an average intensity of 10 m/s. Critically, wind speeds are low to moderate across summer and medium to high during in winter. This seasonal distribution creates a mismatch between wind availability and the actual cooling/ventilation needs of each season.
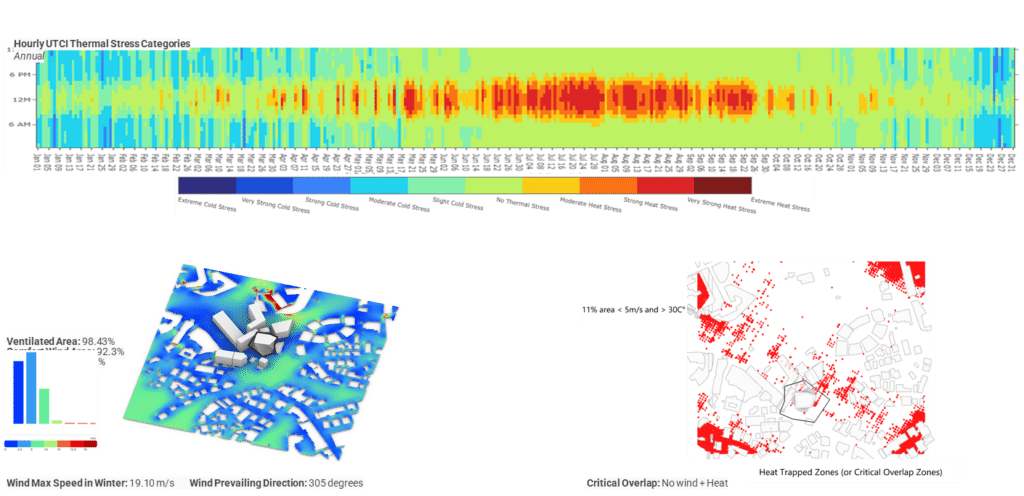
Thermal Comfort & Critical Zones
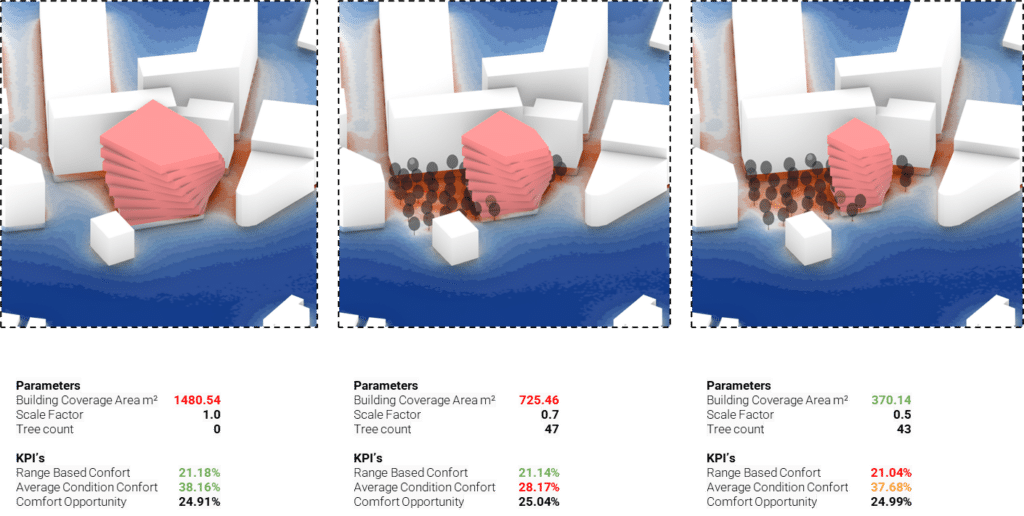
FootPrint Optimization Part I
Solar Form Finding & Final Validation Optimization Part II