
India’s solar ambition is written into its landscape. Since the launch of the Jawaharlal Nehru National Solar Mission in 2010, the country has pursued one of the most aggressive renewable energy expansions in history —targeting 500GW of solar capacity by 2030. But the geography of that expansion follows a troubling logic.
The regions chosen for development are not simply sunny — they are also among the most water-stressed, the most ecologically fragile, and the most socially vulnerable in the country.
India’s clean energy transition is being built on landscapes that were never empty, and on communities that were never consulted.
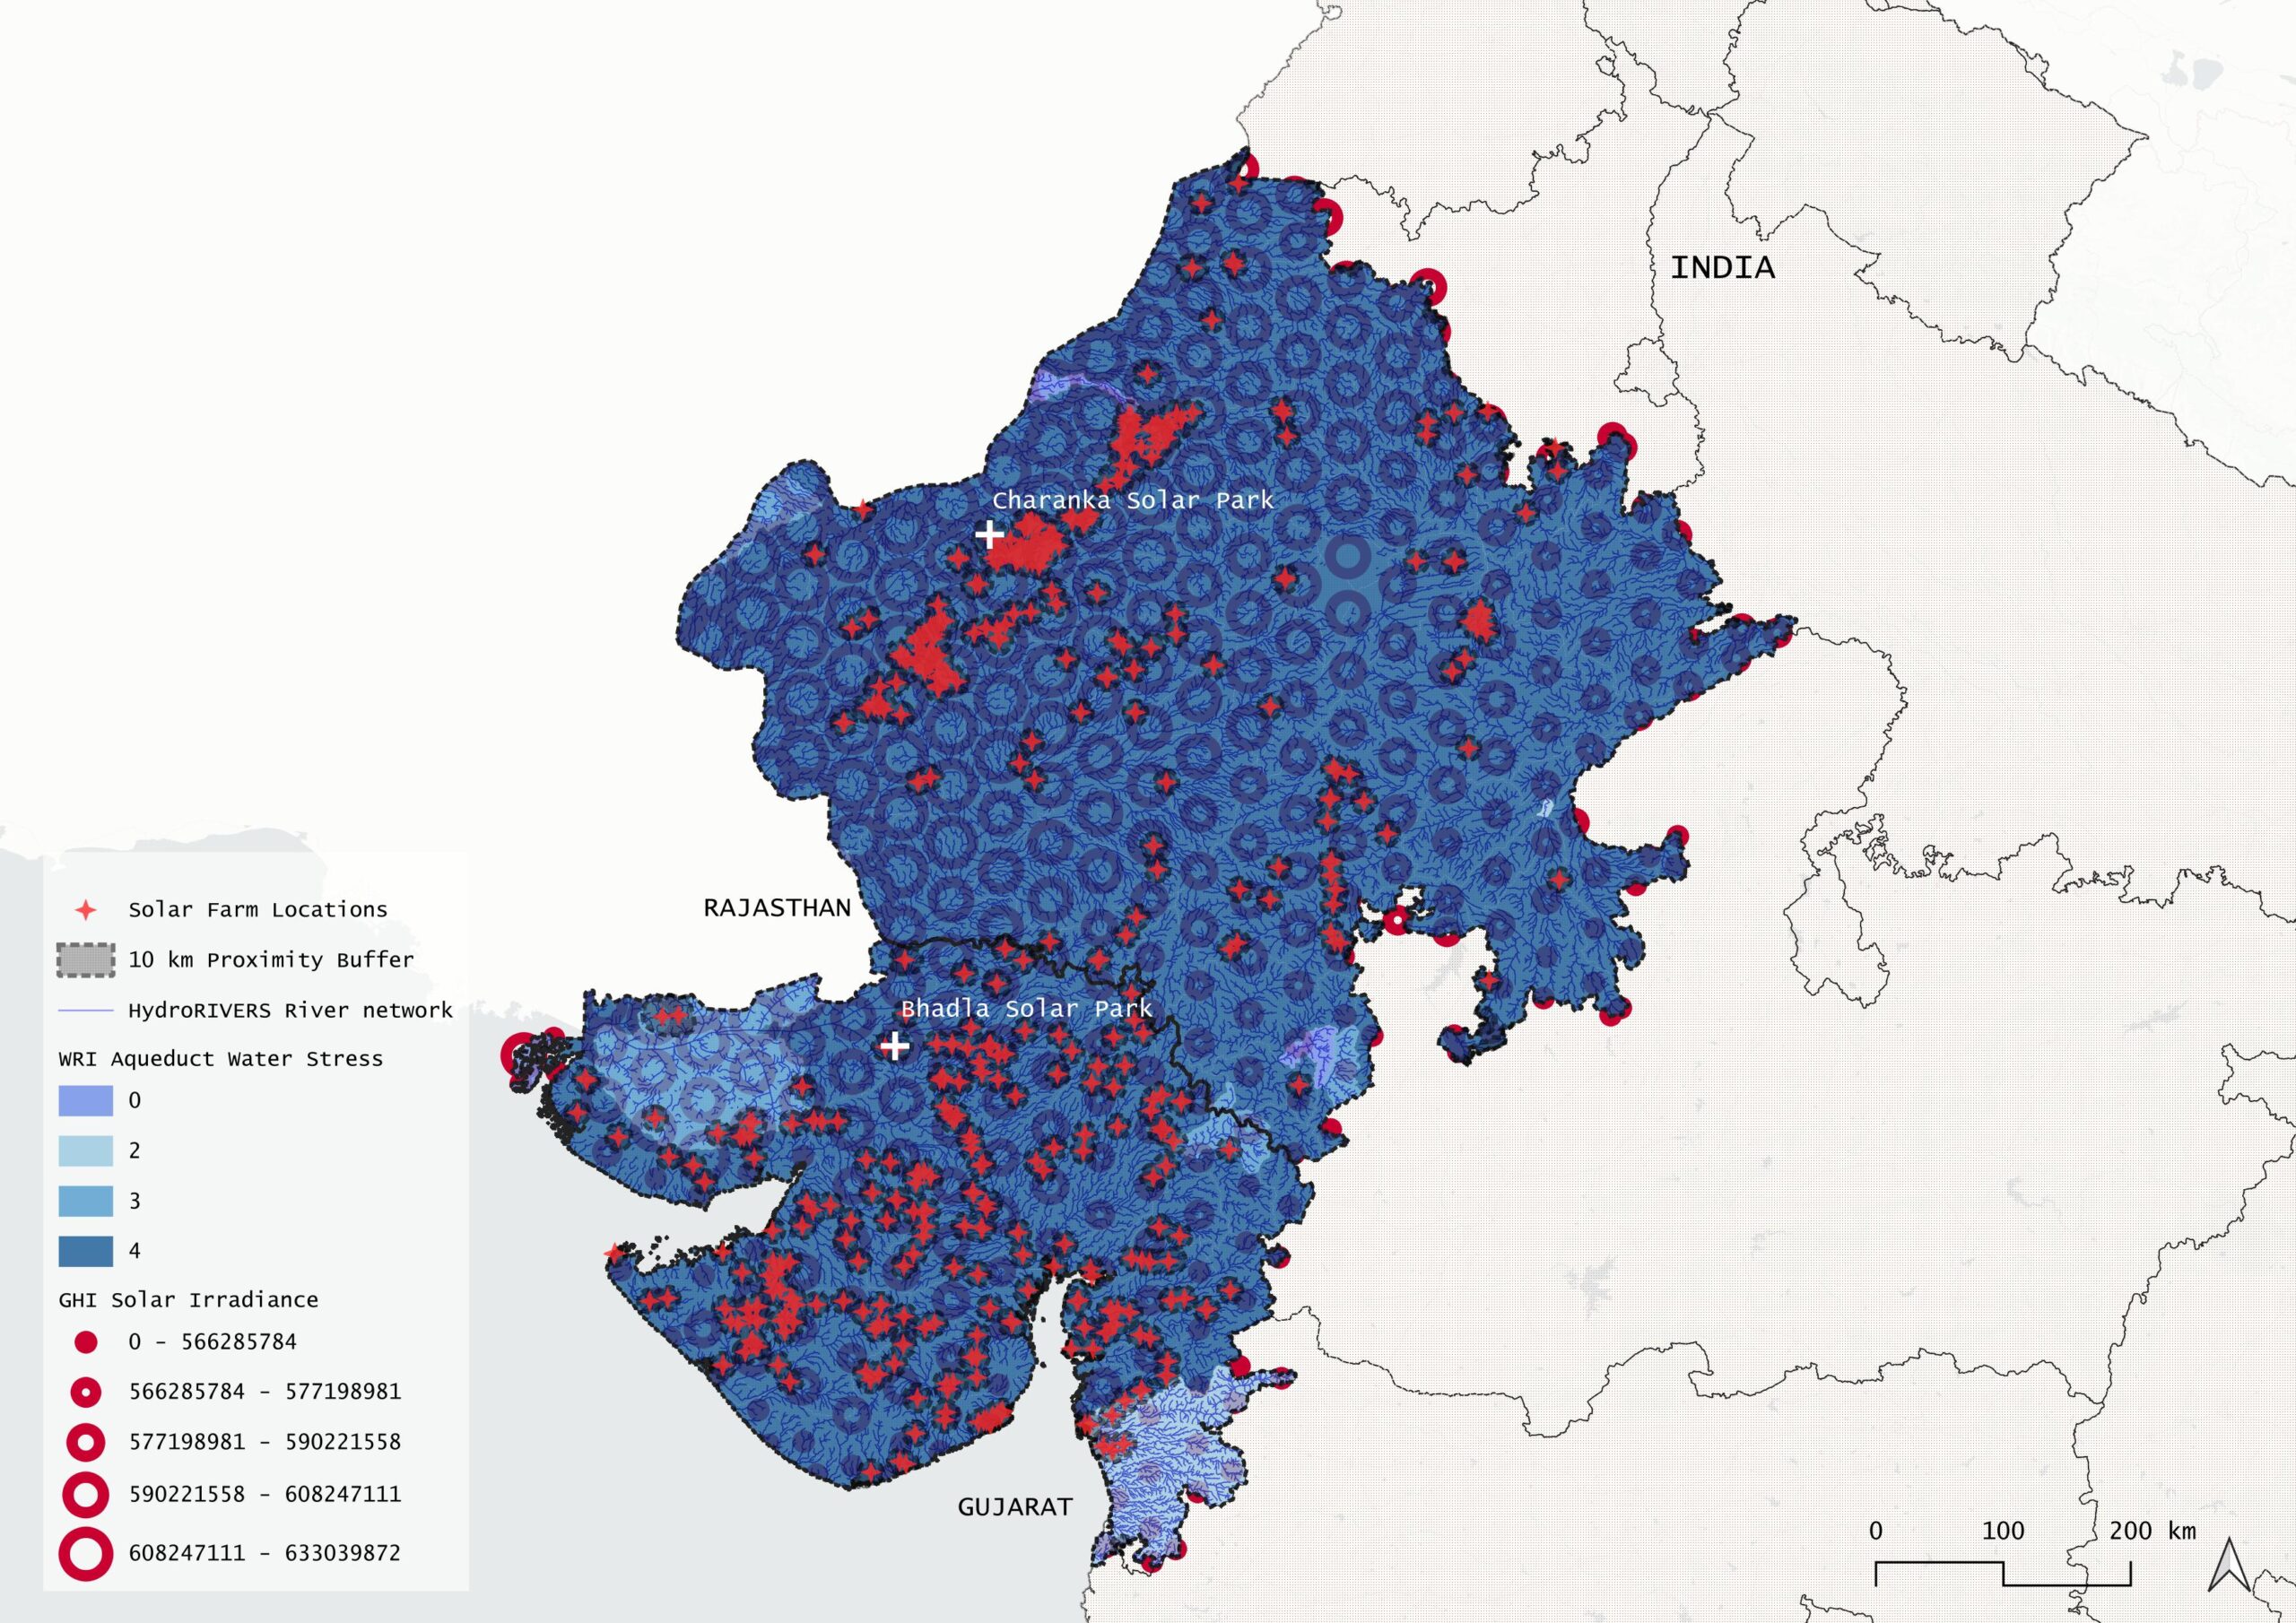
Overlaying solar farm locations with WRI Aqueduct Water Stress and GHI Solar Irradiance reveals that India’s highest solar energy potential zones closely coincide with its most water-stressed regions.
Phase 1
Research by Yenneti (University of Birmingham) and cases documented by Land Conflict Watch reveal a consistent pattern: solar development has concentrated in regions already marked by agrarian distress, pastoral displacement, and contested land tenure. Adivasi and pastoral communities report loss of common grazing land, disrupted water access, and broken promises of employment and electricity. The social cost of clean energy is not evenly distributed — it is absorbed by those with the least power to refuse it.
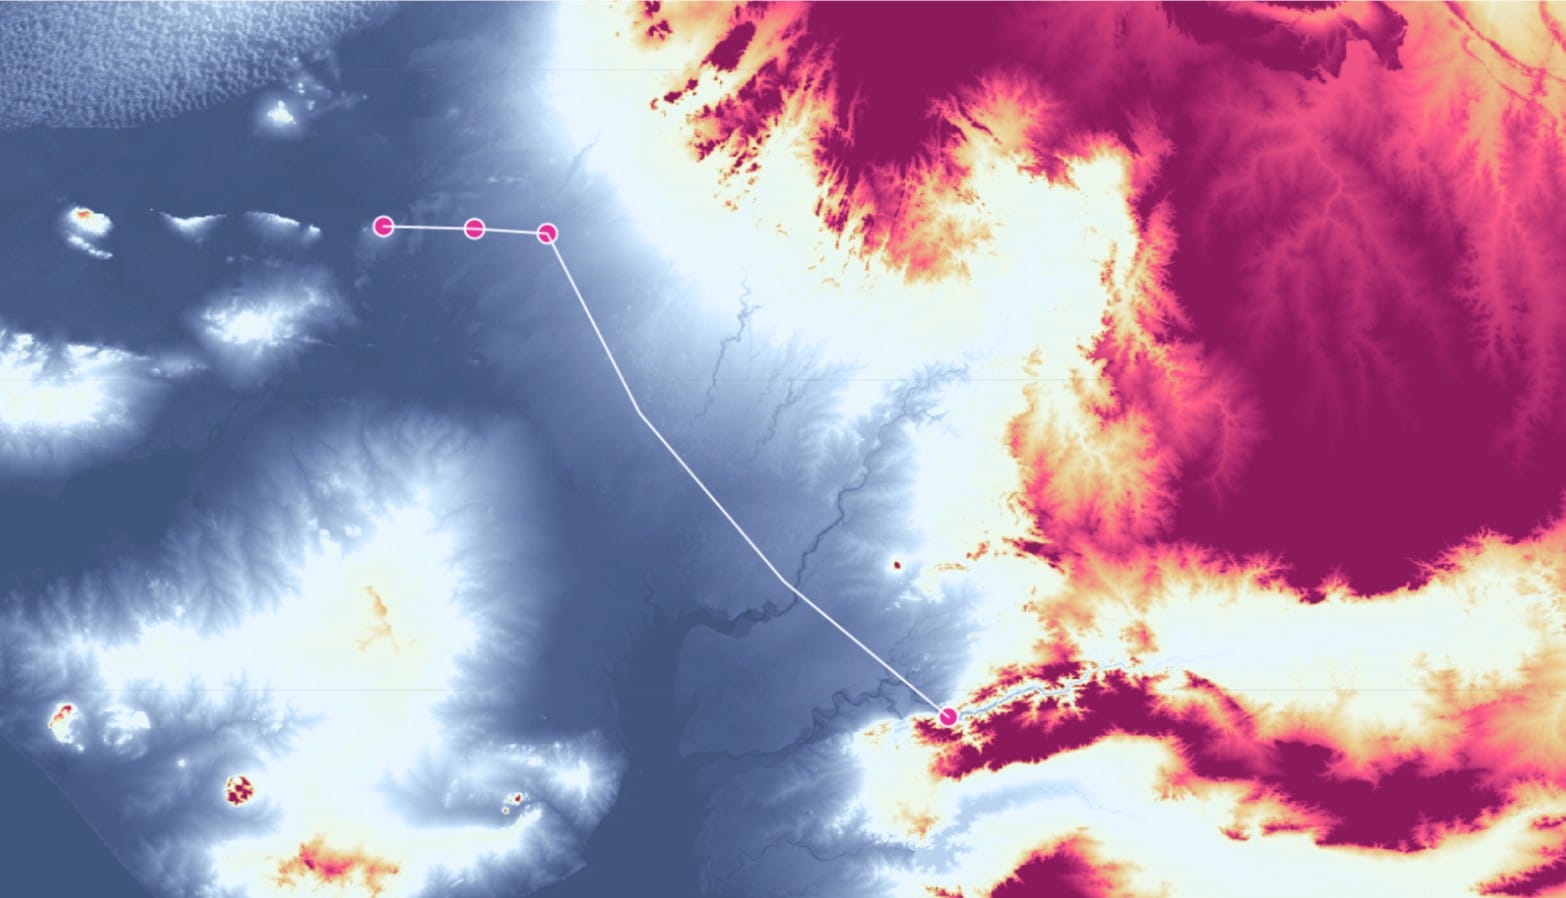
Spatially, this literature finds its confirmation in the data. ERA5 solar irradiance maps show the highest GHI values concentrated across Rajasthan, Gujarat, and the Deccan plateau — precisely the zones where WRI Aqueduct records Extremely High baseline water stress. JRC Global Surface Water occurrence data, drawn from four decades of Landsat imagery, reveals that land classified as wasteland for solar development carried seasonal and ephemeral water presence long before development began. OSM solar park locations, overlaid on these layers, make the argument unavoidable: the sun is here, the water is already scarce here, there was water here to begin with — and this is exactly where solar is being built. (shown in the map above)
Phase 2
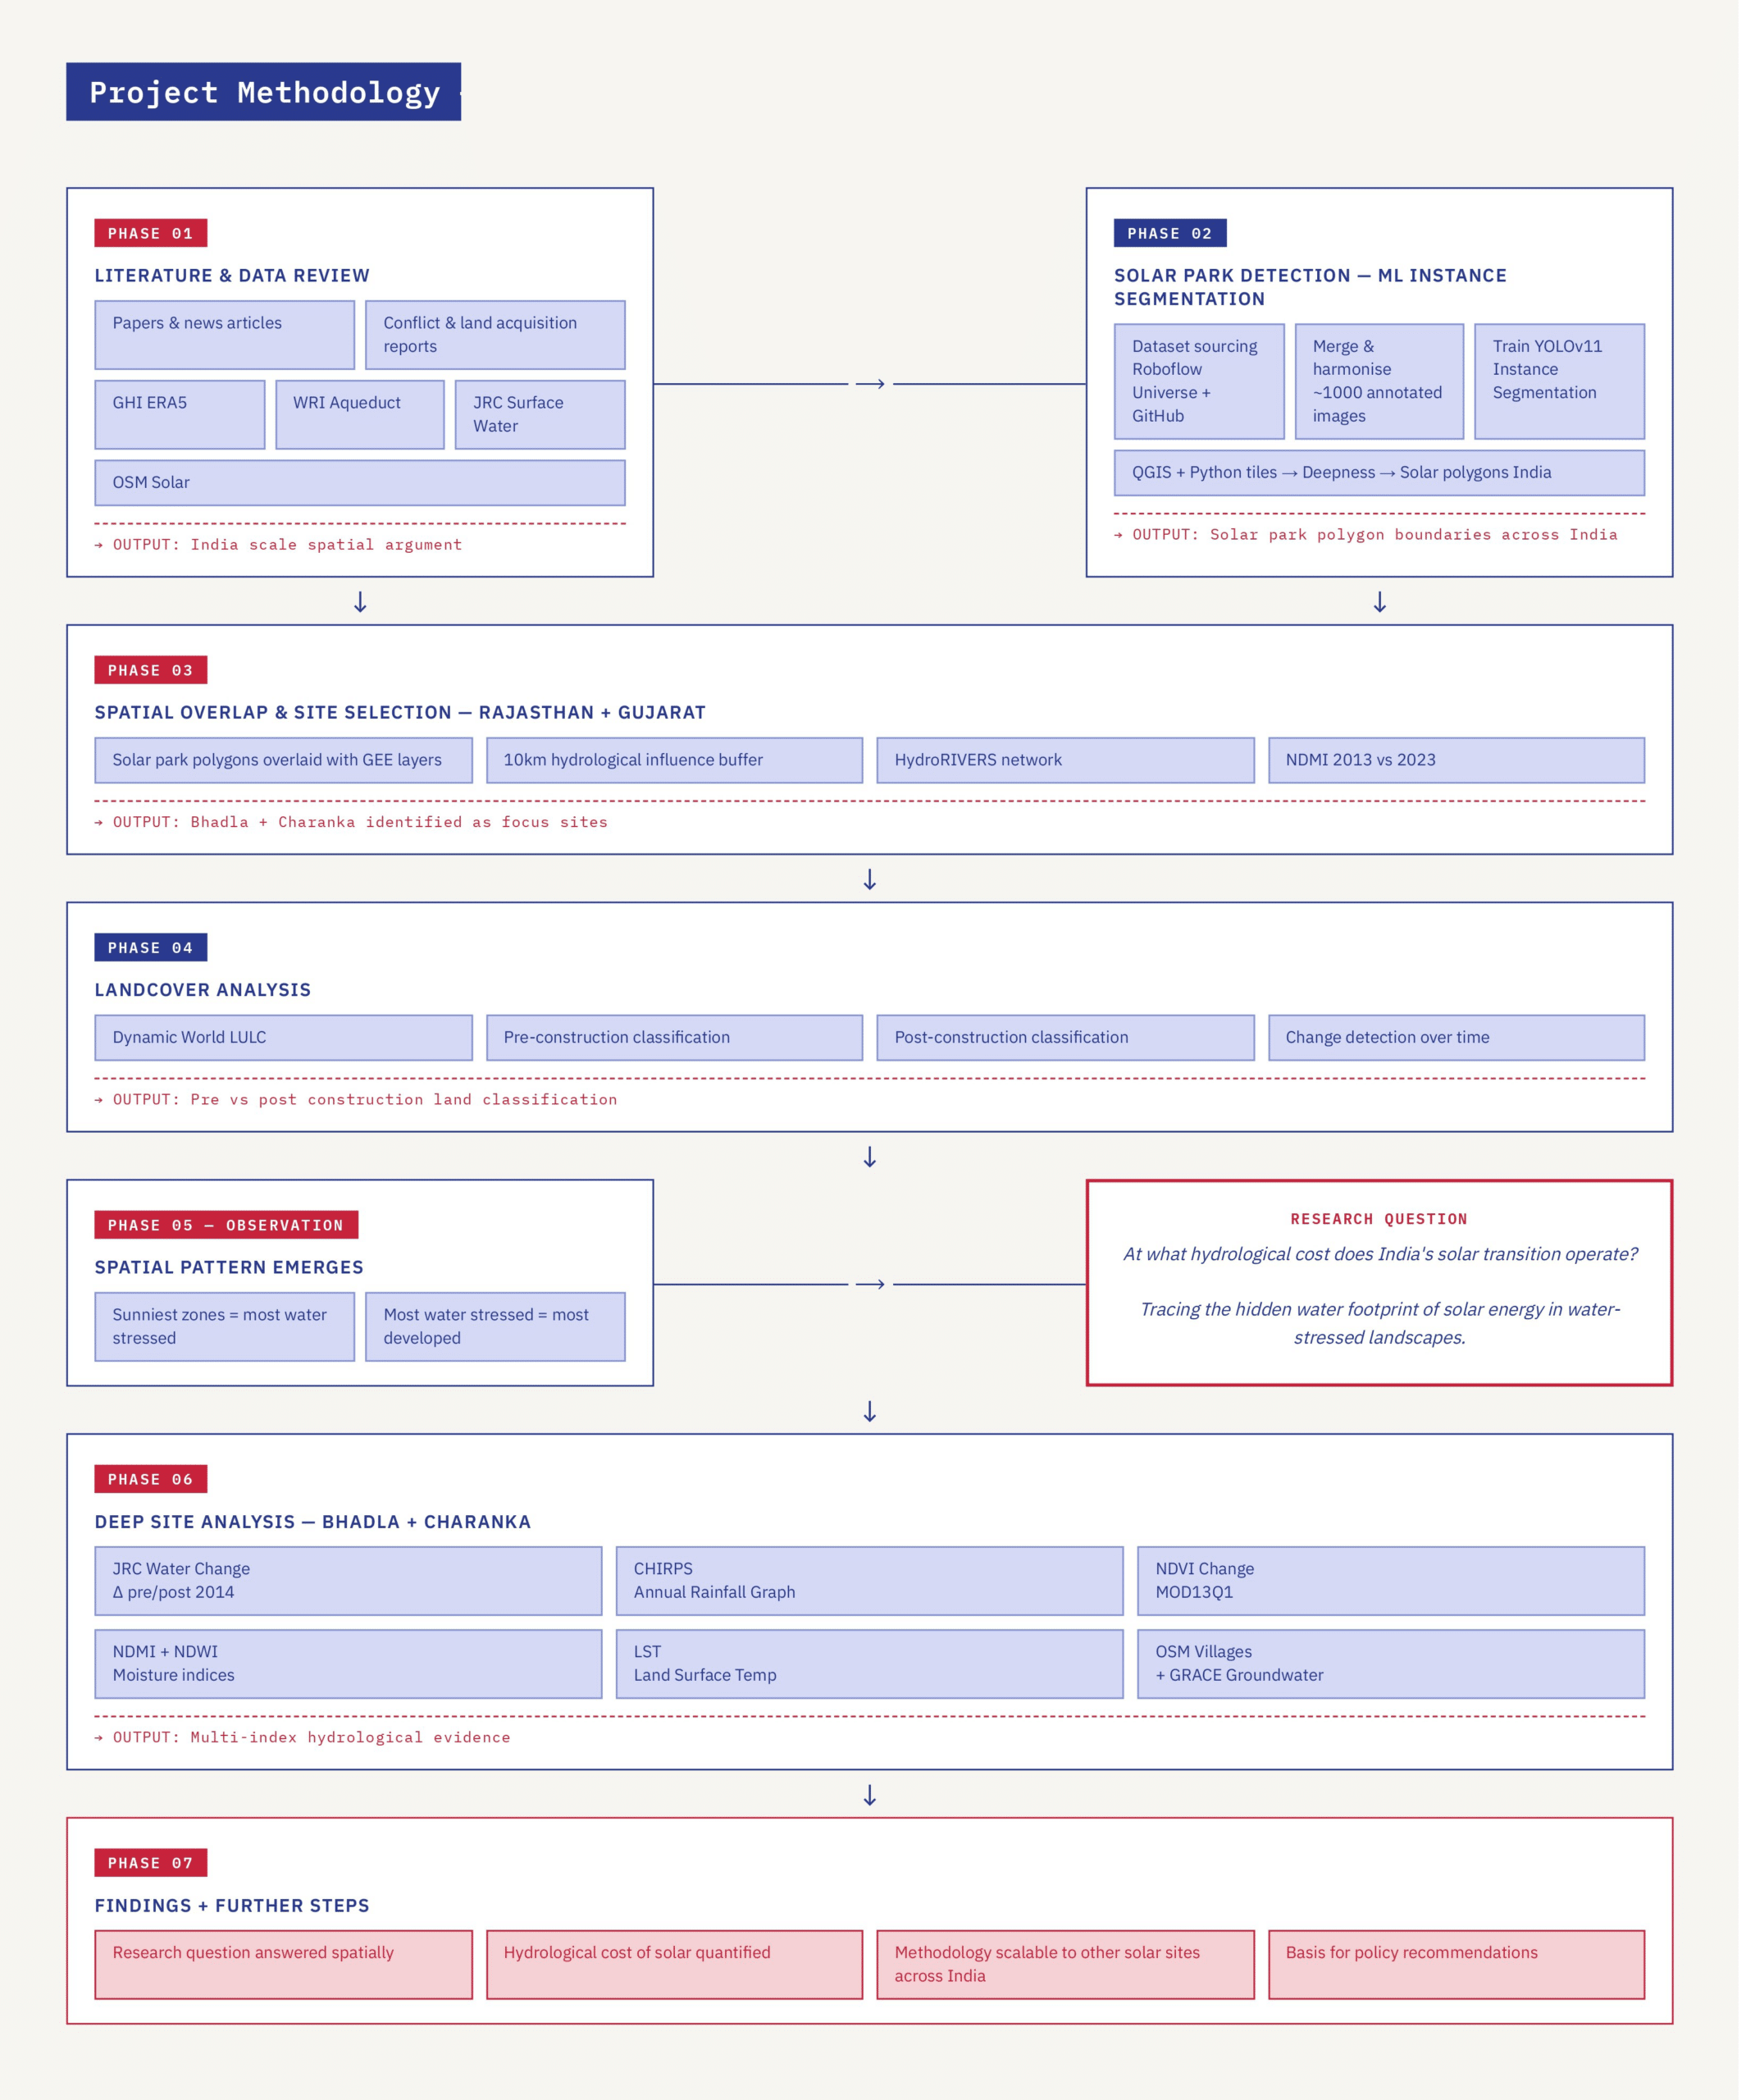
To move beyond points on a map, solar parks need to be seen as the physical infrastructures they are. Using instance segmentation — a YOLOv11 model trained on ~1000 annotated satellite images sourced from Roboflow Universe — individual solar park polygons are extracted across India. These boundaries become the analytical units for everything that follows: buffers, zonal statistics, hydrological overlap. The model achieves 89.7% mAP@50, sufficient precision to distinguish park footprints from surrounding terrain at Landsat-compatible scales.
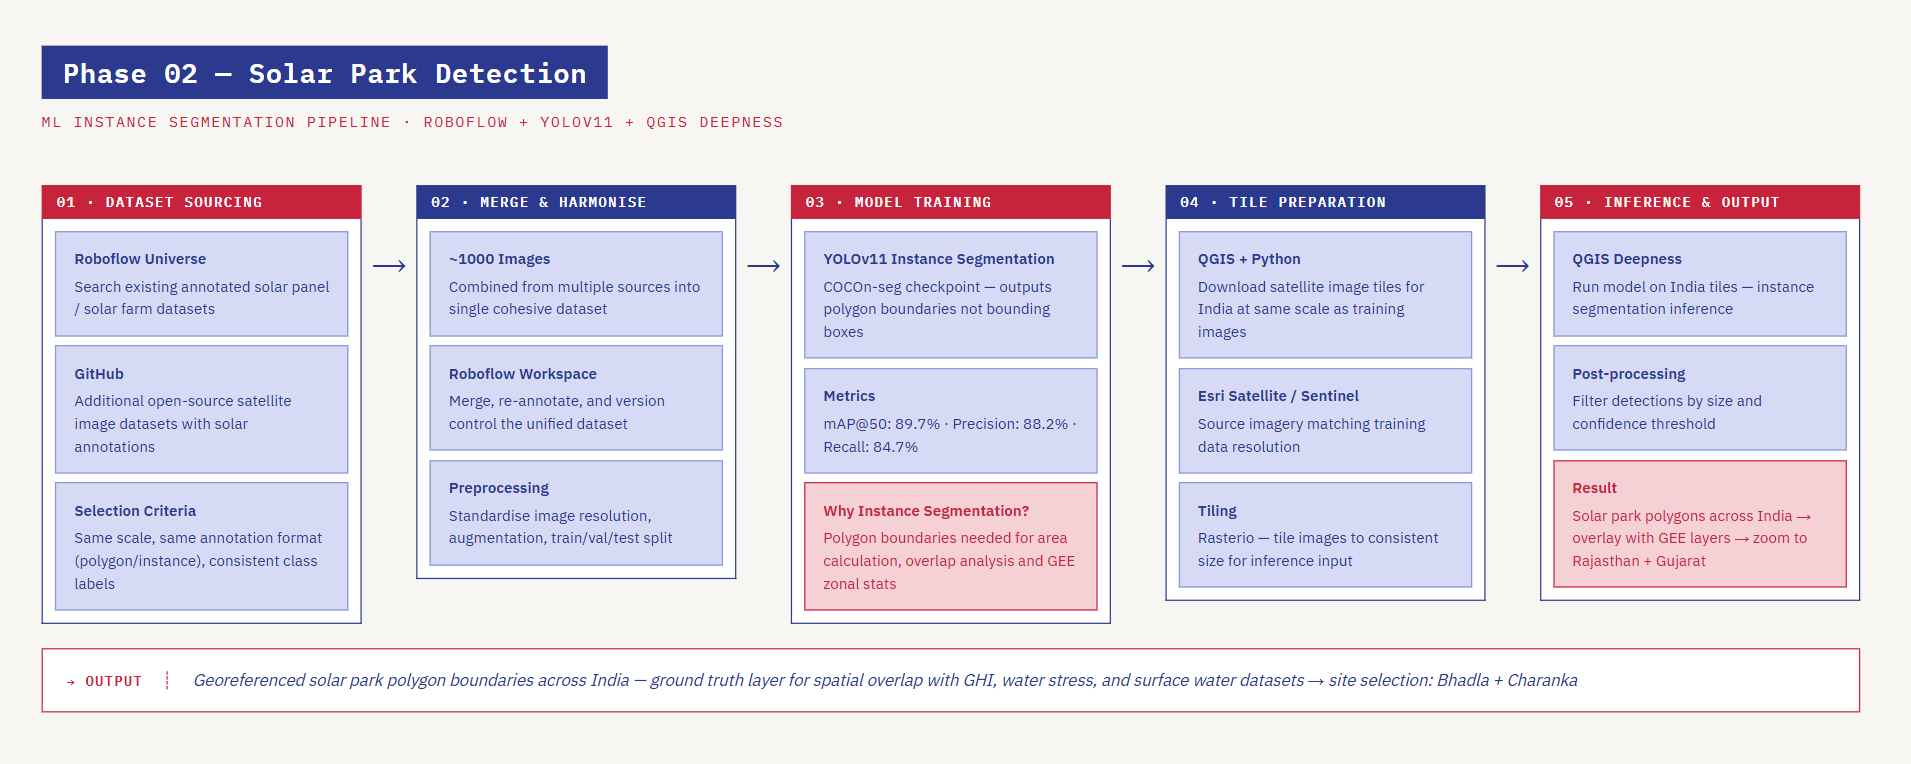
The dataset sourcing process is documented through screenshots of Roboflow and Qgis, where publicly available satellite imagery datasets of solar farms were identified, sourced, and compiled for model training.

Phase 3
Zooming into Rajasthan and Gujarat, the spatial argument sharpens. Solar farm locations cluster densely across both states, almost entirely within WRI Aqueduct’s highest water stress zones — category 4, Extremely High. The 10km proximity buffers reveal how rarely these parks exist in isolation from river networks and human settlements. The largest concentrations sit in the Thar desert fringe and the Rann of Kutch — landscapes officially classified as wasteland, but threaded with rivers, seasonal water bodies, and centuries of pastoral land use.
From this overlap, one site crystallises. Charanka Solar Park in Patan District, Gujarat — India’s first utility-scale solar farm — was launched in 2010 under the Jawaharlal Nehru National Solar Mission, with a national target of 20GW by 2022. Capacity at Charanka alone expanded from 200MW to 2,600MW by 2016, a tenfold increase in six years. What the policy narrative omitted was who lived here: the Maldhari pastoral community and other cultural groups with deep, differentiated relationships to this land — marketed a vision of clean energy, jobs, and development that has largely not arrived. The village of Charanka sits 1km from the park’s southwestern boundary, close enough to see the panels, too far from the benefits.
Phase 4
Using Google Earth Pro and Dynamic World, land cover at Charanka is examined before and after the park’s development in 2014. The landscape that was classified as wasteland reveals a more complex pre-development condition — seasonal grazing land, ephemeral water bodies, agricultural edges. Post-2014 imagery shows the consolidation of panel arrays, access roads built around the plant rather than the village, and a new water body appearing inside the park boundary by July 2016 — absent from all pre-development records.
Phase 5
A water body appeared inside the Charanka Solar Park site after development. Rainfall records show no sustained increase after 2014. The surface water did not come from the sky. It came from the Narmada canal — water transported over 500km for panel cleaning, while the village of Charanka struggles for potable water. Clean bottled water washes dust off solar panels. The village pond that once served the community now falls inside the park boundary, inaccessible. This is the moment the research question crystallises:
At what hydrological cost does India’s solar transition operate?
Tracing the hidden water footprint of solar energy in water-stressed landscapes.
vbhjn
Phase 6
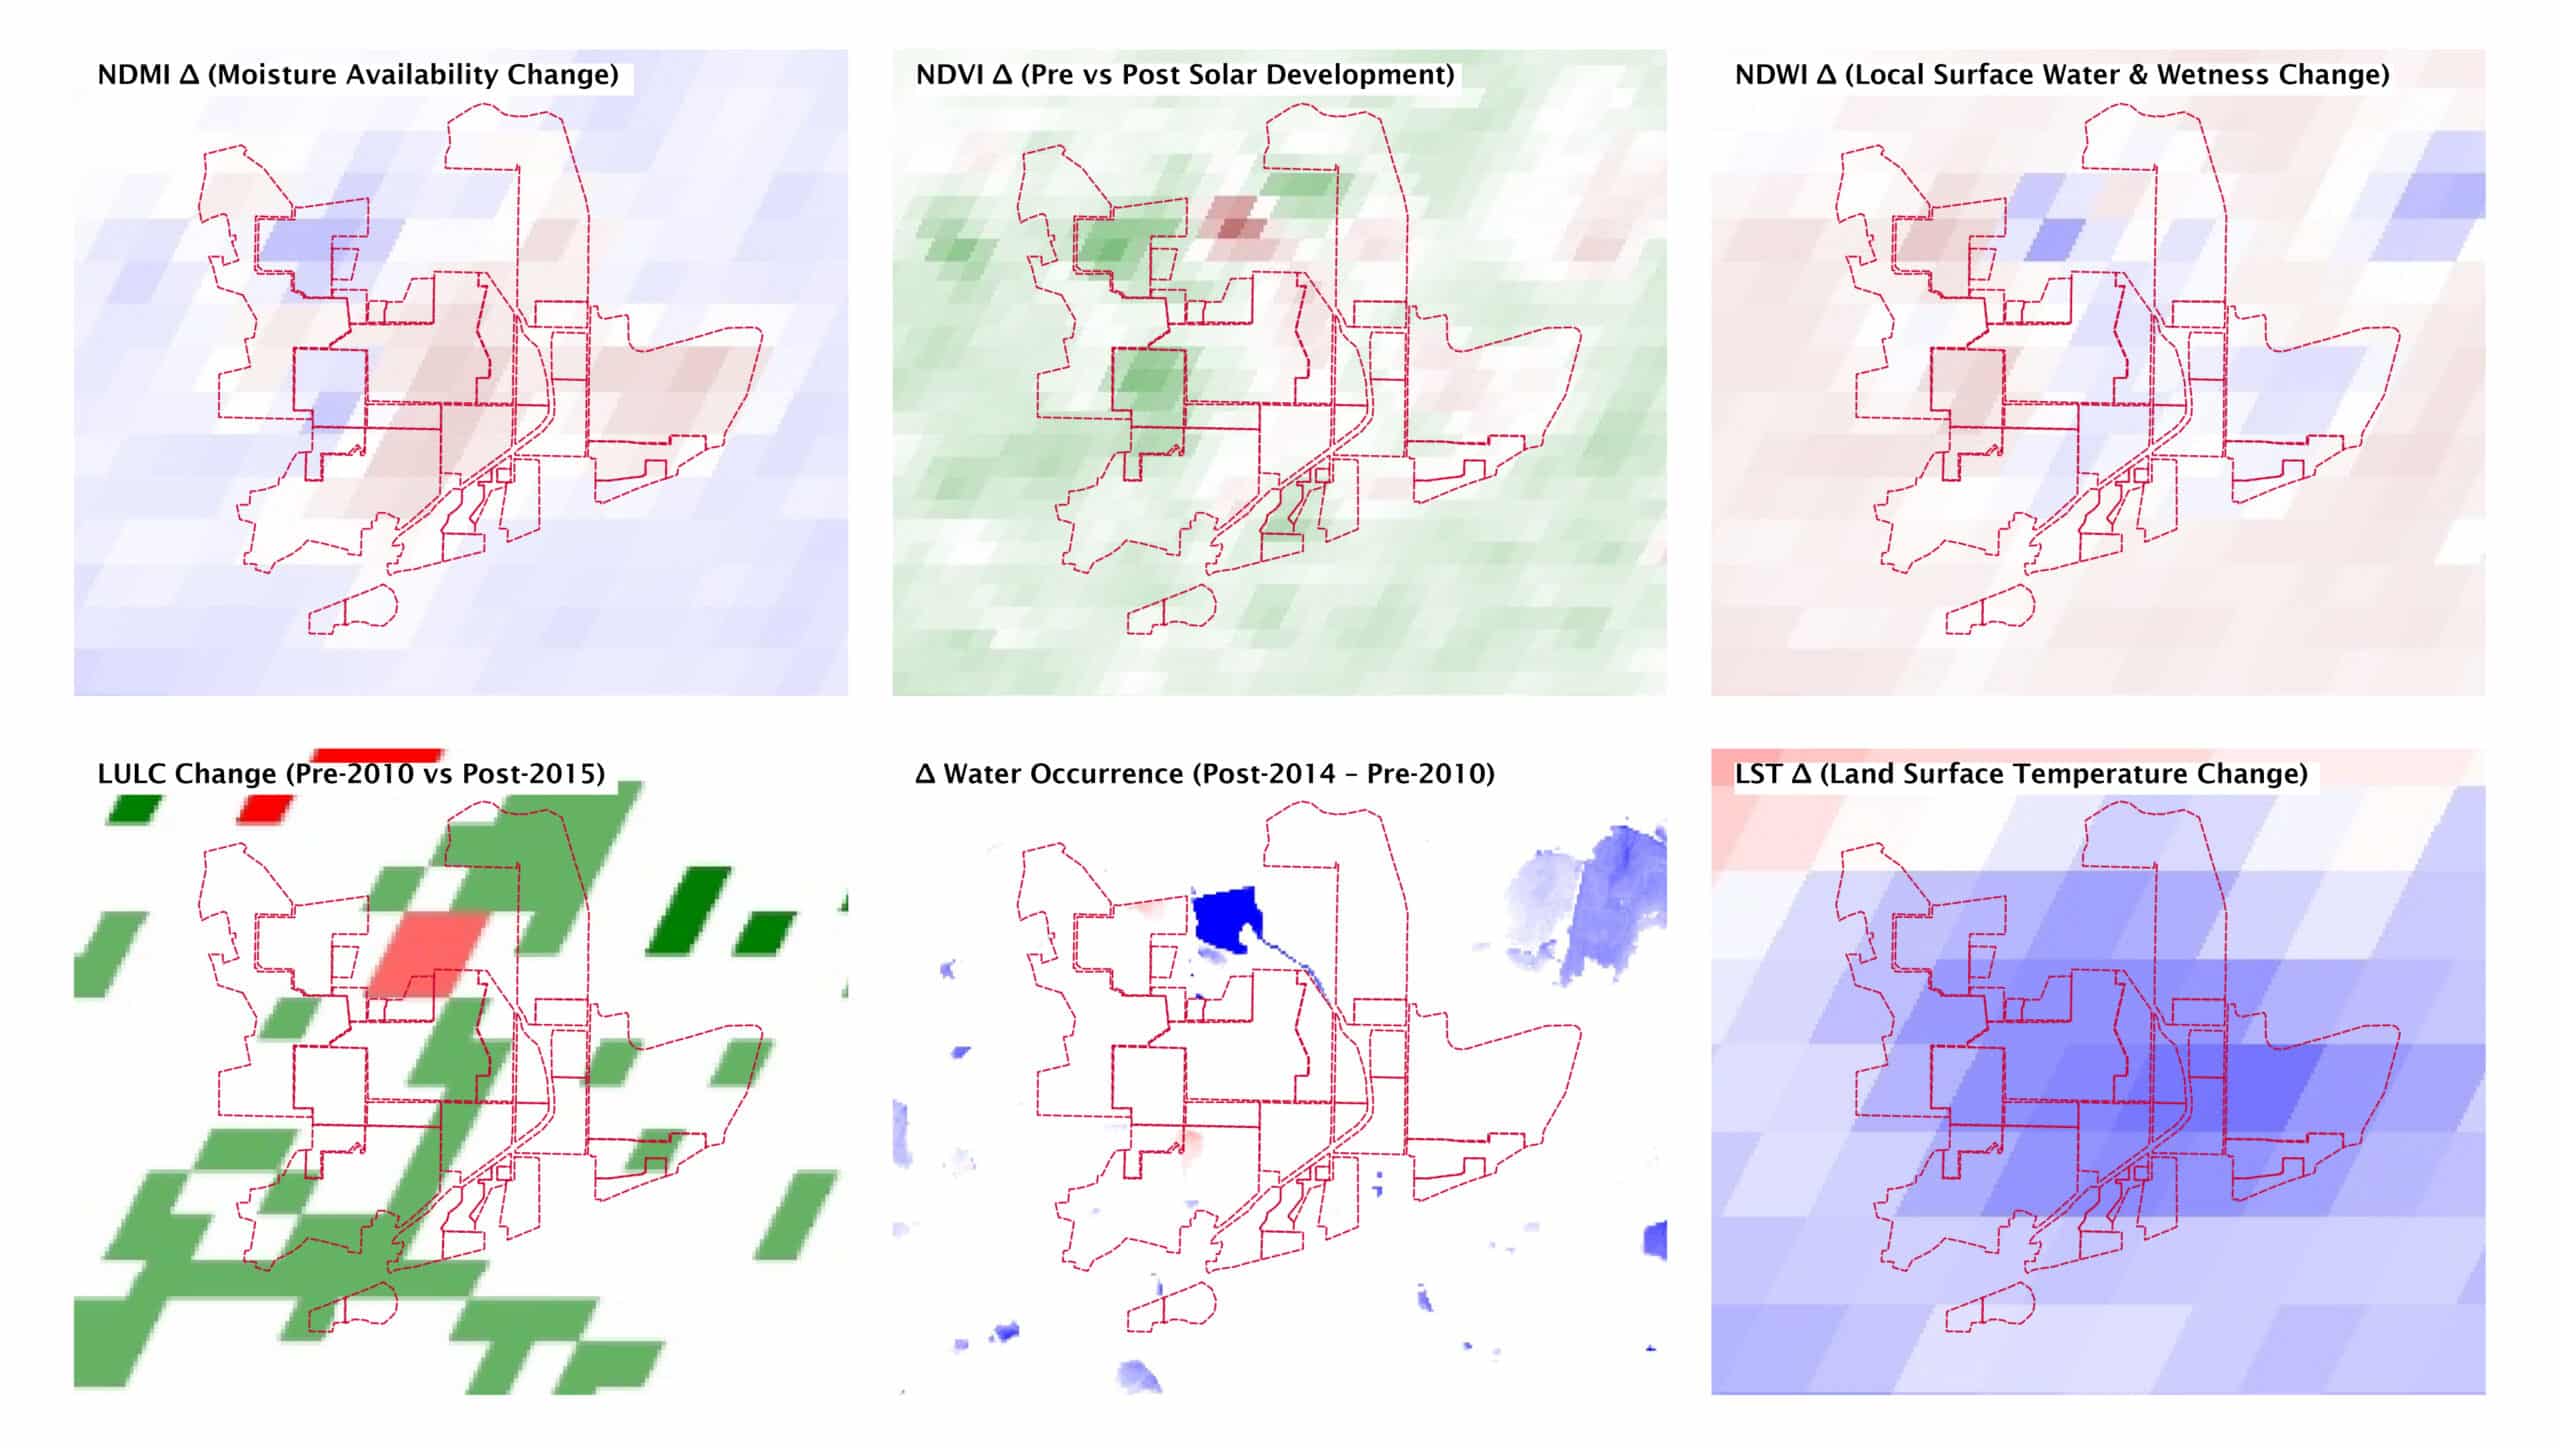
Charanka is examined through six satellite-derived change maps, each comparing a pre-development baseline (before 2010) against a post-development period (after 2014). The findings are more complex than a simple story of degradation. NDMI shows moisture increasing within specific zones inside the park while declining at its edges — a pattern of hydrological redistribution rather than uniform loss. NDVI reveals broad vegetation increase across the region, likely reflecting reduced grazing pressure following community displacement, but with a concentrated zone of vegetation loss at the park’s densest infrastructure core. Most strikingly, the water occurrence change map shows a large, permanent water body emerging inside the park boundary after 2014 — absent from all pre-development records. LST maps show the site and surroundings becoming cooler post-development, consistent with the thermal effect of a new reservoir and irrigated infrastructure. The landscape did not simply dry out. It was reorganised — moisture and water concentrated inside the park’s operational boundary while the surrounding community landscape experienced the inverse. The question is not whether water is present at Charanka. It is who it belongs to.
Phase 7
The analysis converges on a set of findings that open as many questions as they close. Surface water occurrence substantially increased after 2014 — not explained by rainfall, but consistent with the construction of a reservoir tied to the park’s operational infrastructure. Land surface temperature shifted, vegetation patterns changed, and moisture indices trace a landscape reorganised around the park’s needs rather than the community’s.
But the data points toward questions that satellite imagery alone cannot answer. Who controls the reservoir inside the park boundary — the solar operator or local communities? Do the villages surrounding Charanka actually receive electricity from the energy generated on their former land, or does it bypass them entirely? In a region already classified as Extremely High water stress, is the volume allocated to panel cleaning disproportionate to what local households access daily? Did the construction displace farmers, pastoralists, and fishing communities who previously depended on this landscape — and if so, where did they go? What hydrological reordering, invisible in policy documents, was quietly required to make clean energy possible here?
These are not edge cases. They are the central questions of any honest accounting of India’s solar transition.
