
This article presents a project exploring how collected data can be processed and translated into automated classification and robotic decision-making logic. The core concept revolves around studying the physical condition and spatial arrangement of reclaimed construction material, extracting geometry-based and surface-level information to generate a data-driven sorting and retrieval workflow. By combining artificial intelligence with parametric design and assembly modelling, the project bridges digital analysis and physical action — enabling an automated system to assess material quality, assign condition categories, and determine appropriate handling paths for each individual component.
The broader context and motivation behind the project. Europe generates over 780 million tons of construction and demolition waste annually, with just seven countries responsible for 70% of that total. Spain, despite being a relatively smaller contributor to overall waste volumes, is a significant player in the brick industry specifically — home to over 19 active brick factories concentrated in Catalonia, and ranking second globally in brick exports with €5.18 billion in revenue. Critically, 32% of brick waste originates directly from demolition — a substantial and largely recoverable stream of material. This data establishes the real-world urgency behind the project: the scale of brick waste in the region makes automated material recovery and reuse not just technically interesting, but economically and environmentally necessary
The Project

Goals
This project aims to enable the autonomous recovery and reuse of terracotta bricks from demolition sites by building a system that takes site scan data, demolition debris, classification criteria, and storage layouts as inputs, processes them through a sequence of core functions — site scanning, material detection, condition assessment, material classification, sorting instruction, pick and place, and reporting — and produces two key outputs: a physical sorting of bricks into full, broken, or rubble categories, and a digital inventory complete with classification data and reuse potential metrics.
Project Architecture

Process & Evaluations
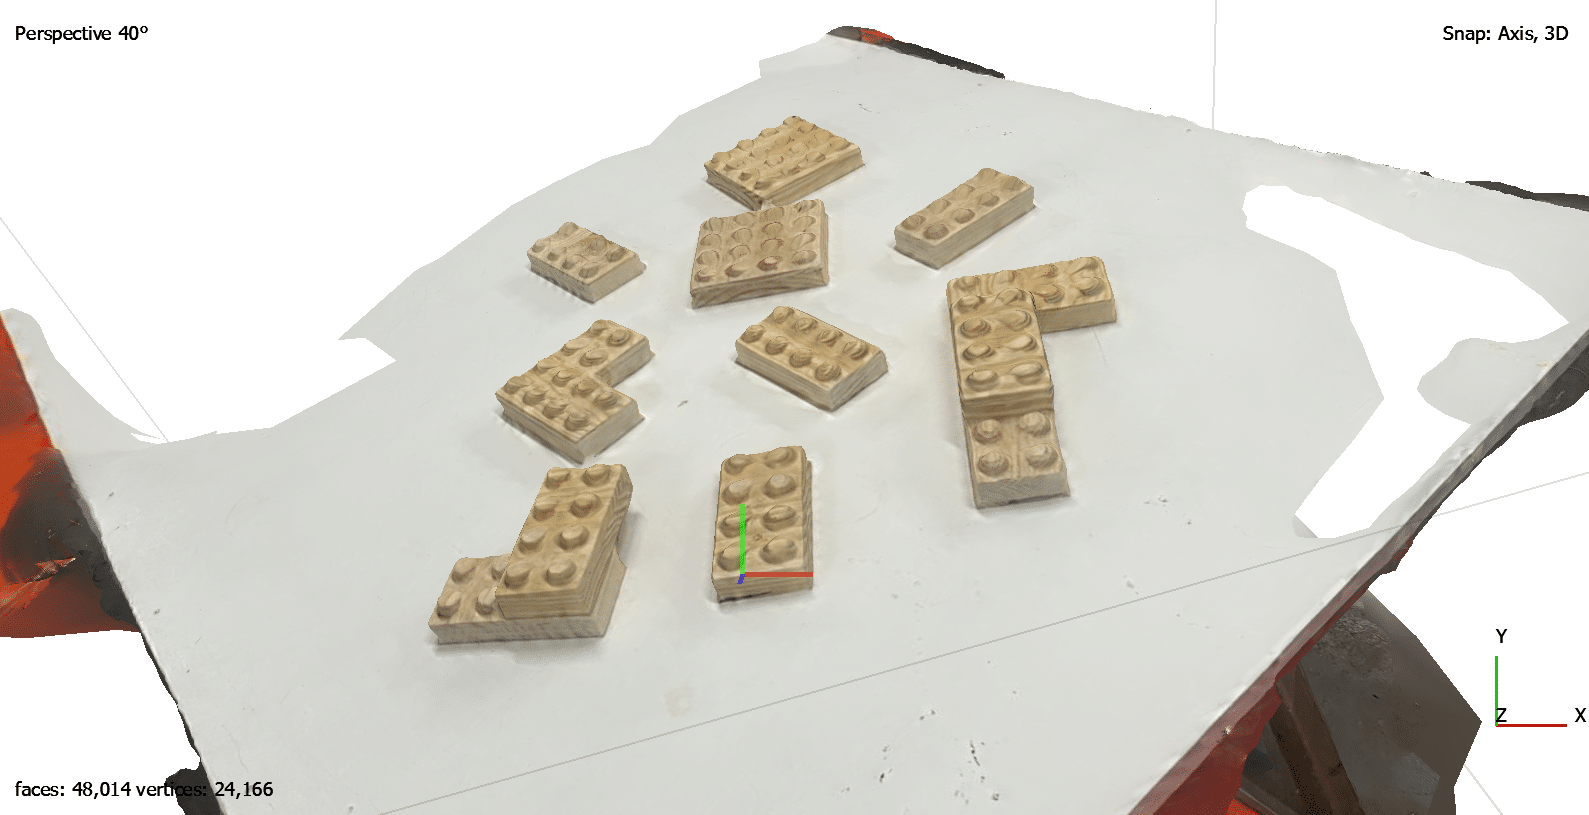
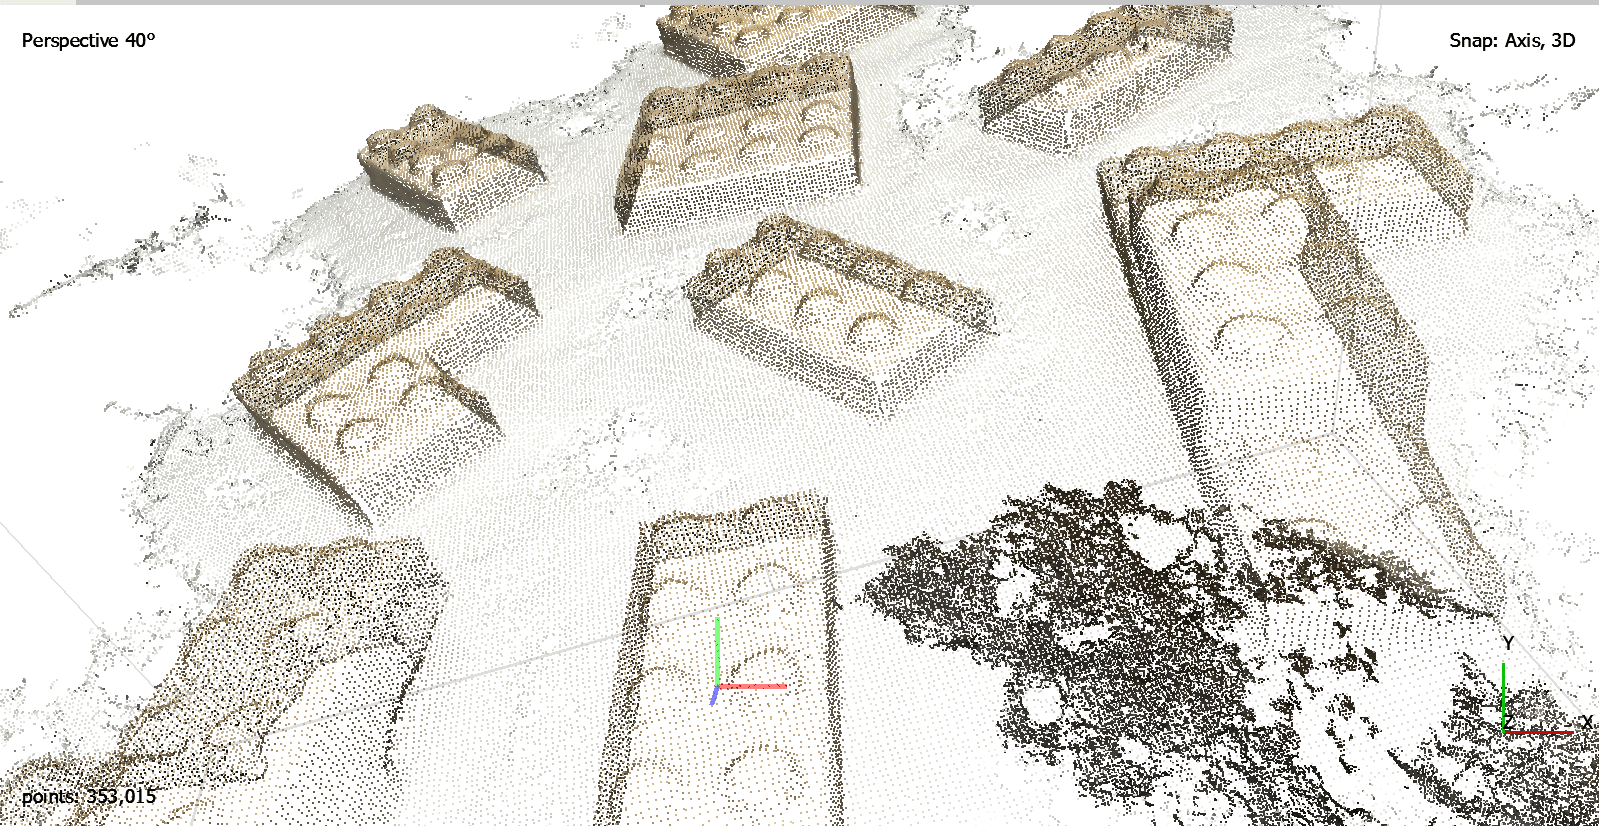
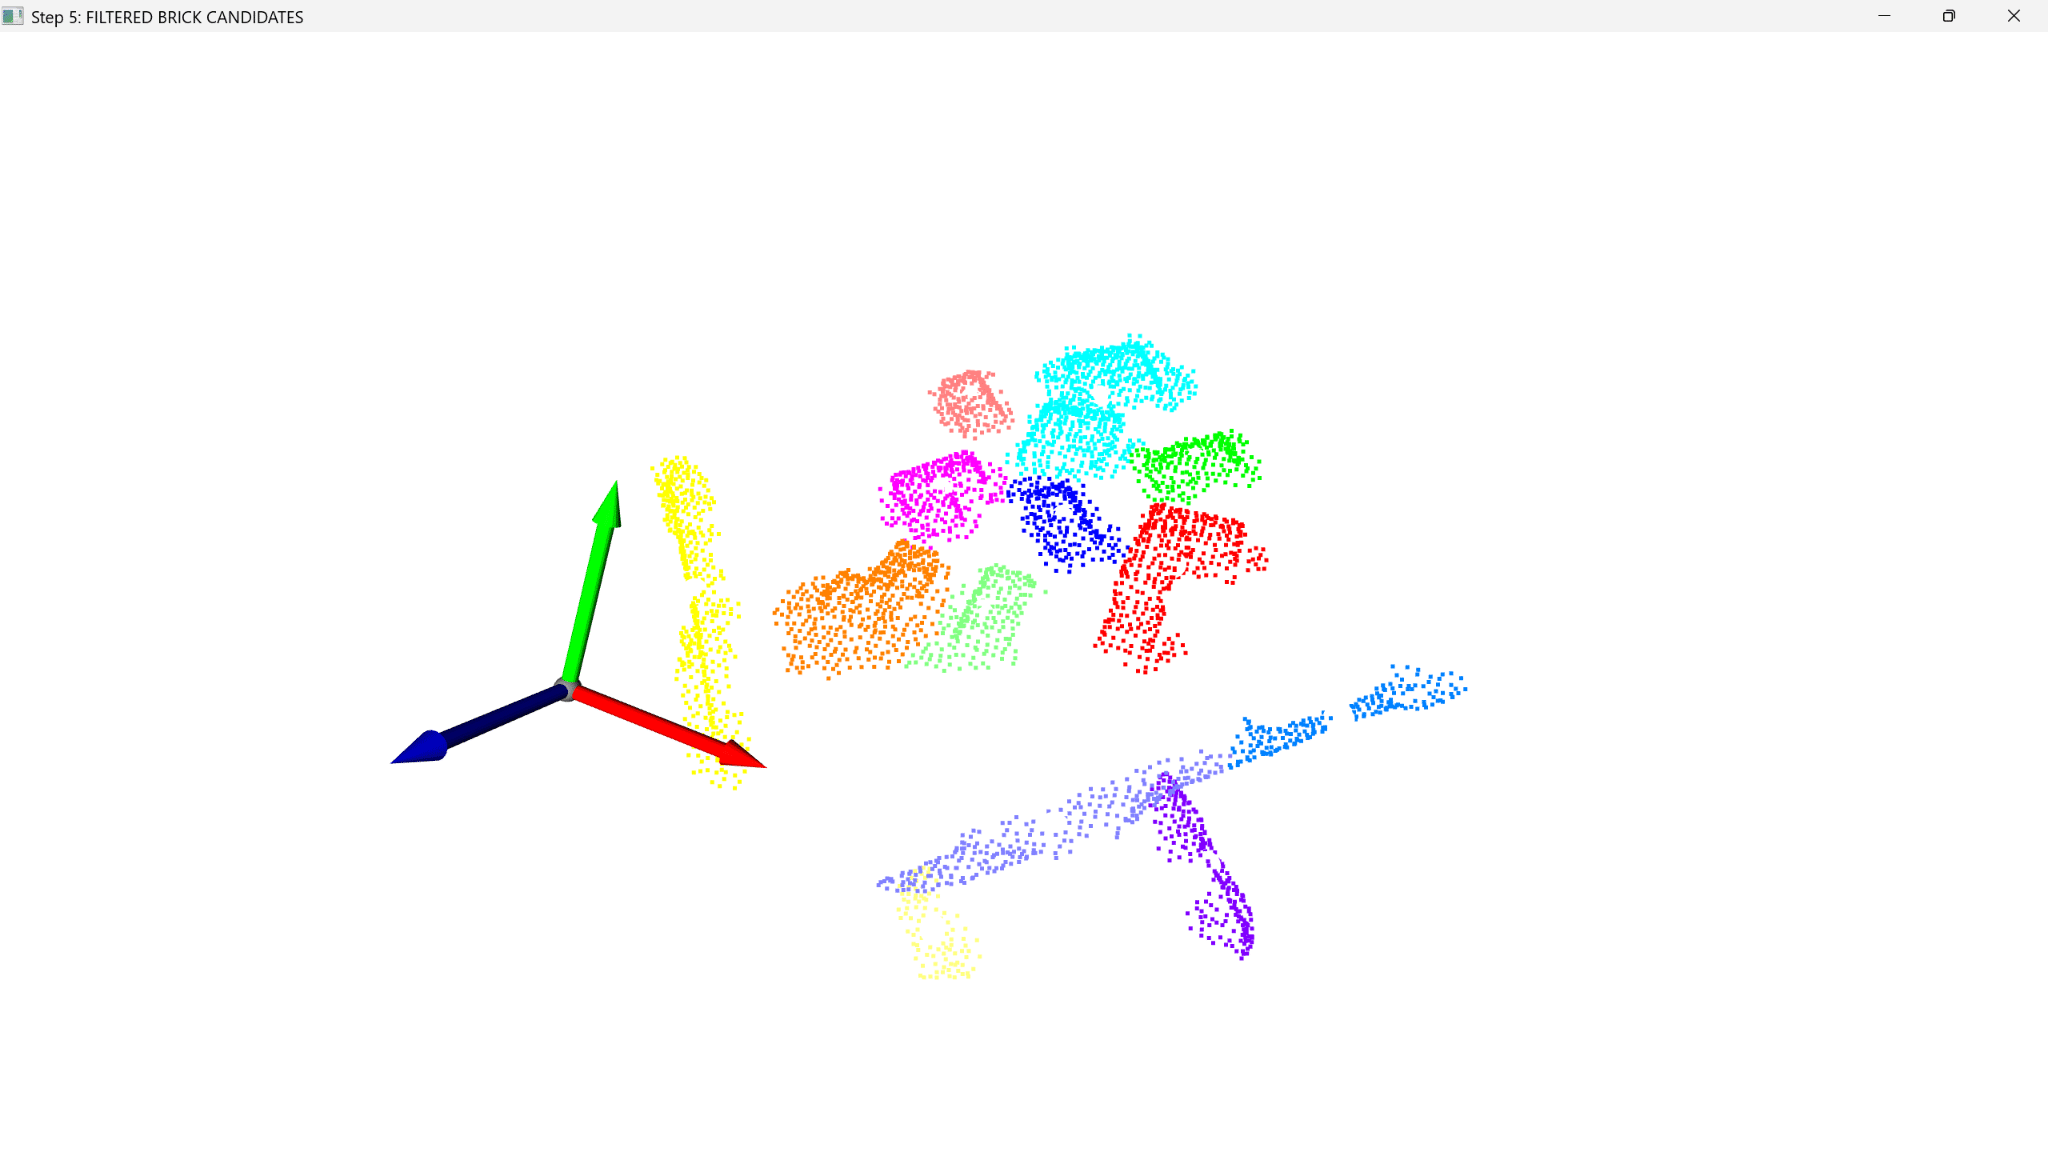
The process begins by acquiring a raw point cloud, which is then cleaned through voxel downsampling and outlier removal. Density-based clustering identifies distinct objects, which are filtered against expected brick dimensions, followed by surface texture analysis to confirm materiality and final brick categorisation.
Considerations Table Removal: Single plane RANSAC
An early consideration was in what format to export the point cloud from Metashare as. Whilst PCD would be better if you were doing real-time robotic manipulation. For the demo PLY is simpler but still suitable format for scanning static bricks.
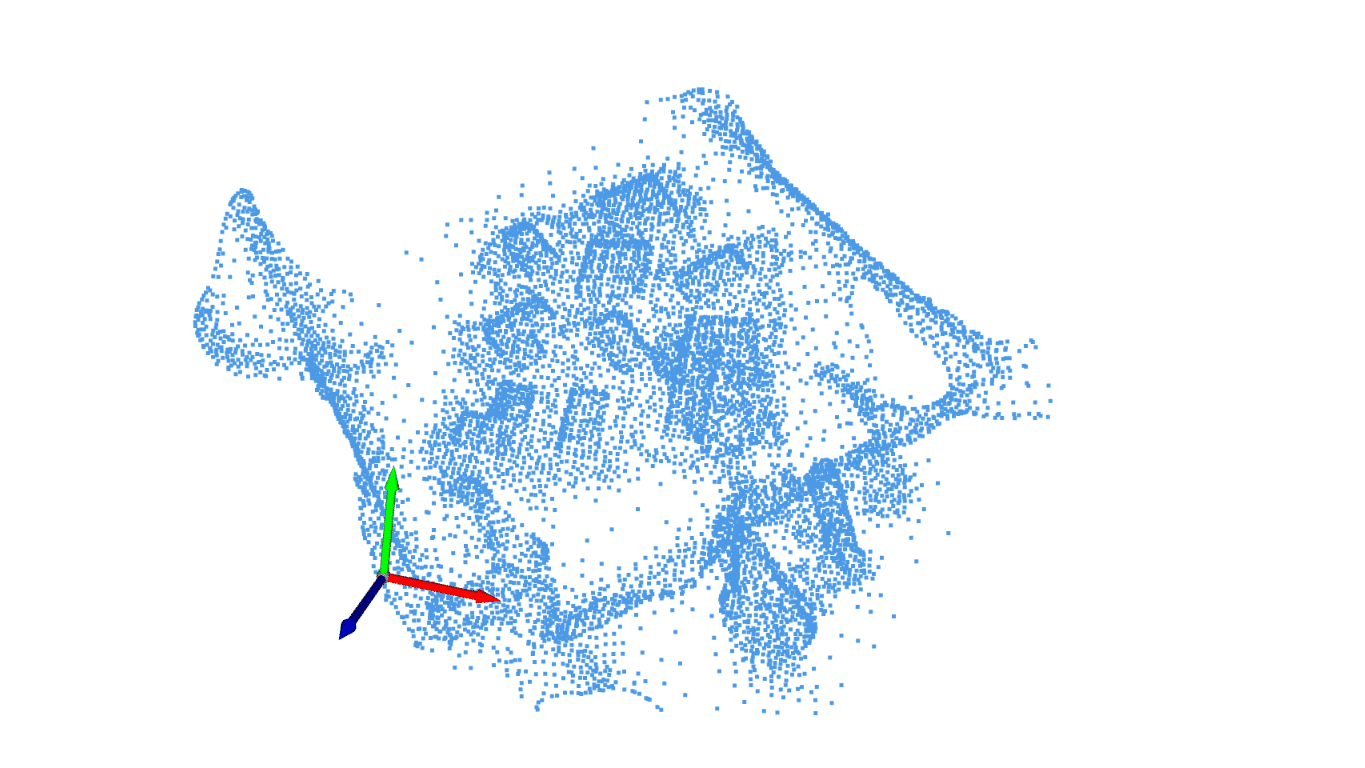
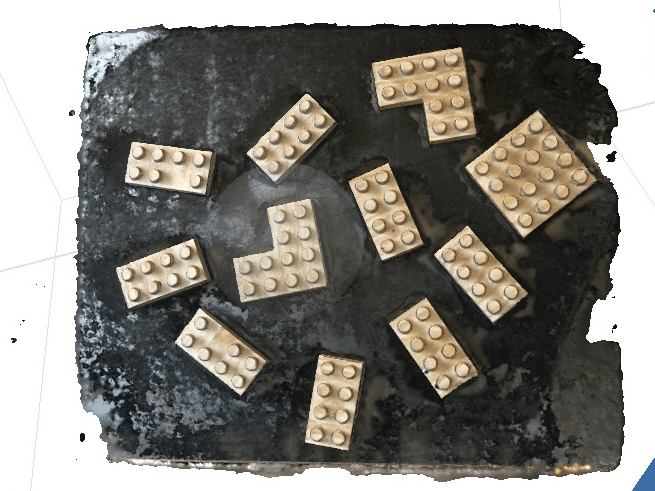
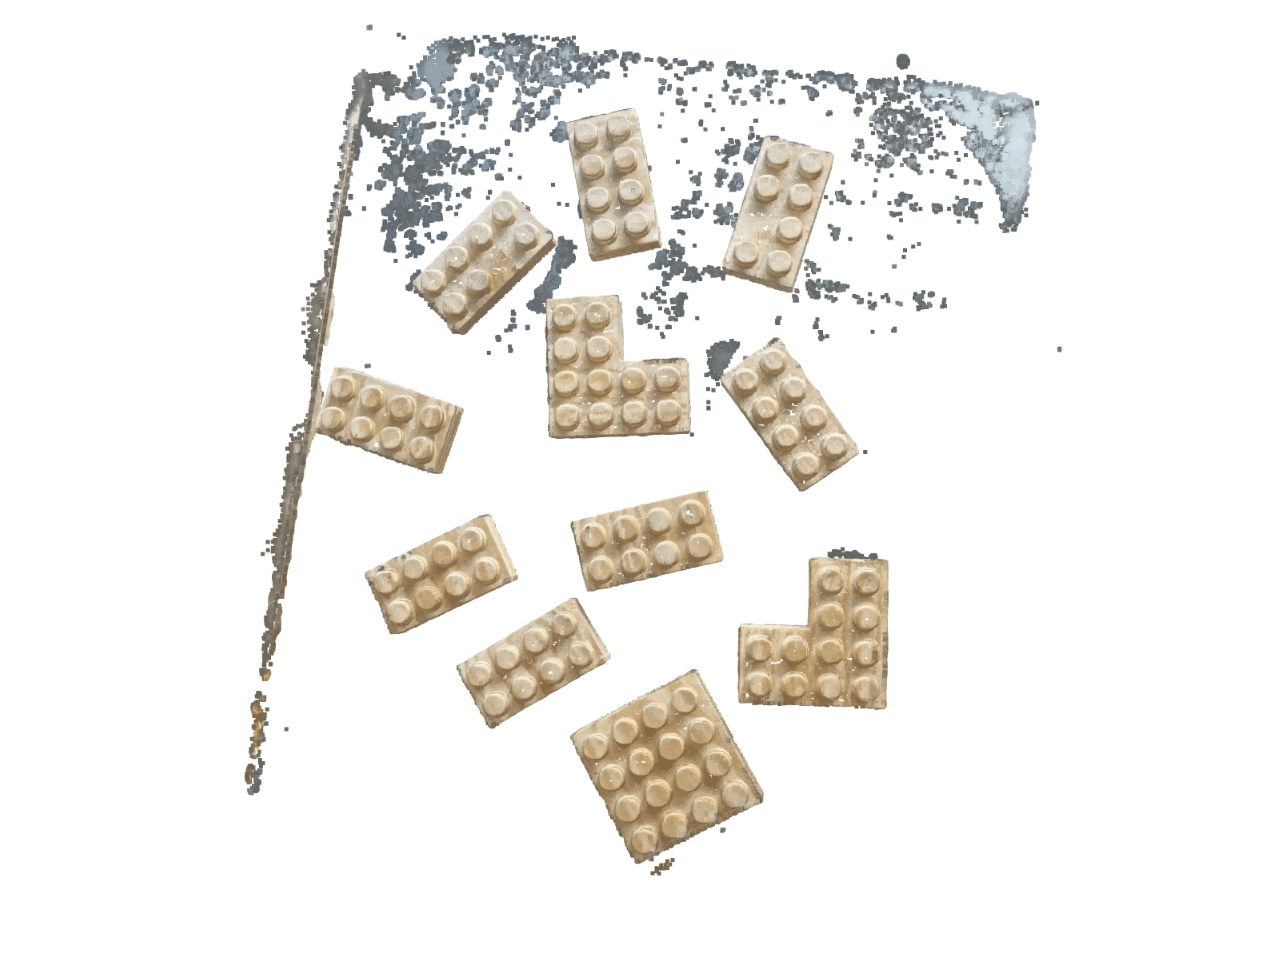
We used RANSAC to try and find the table as our main surface. By determining the table we could remove this and more easily identify the brick clusters in isolation.RANSAC (RANdom SAmple Consensus) takes input data which is checked a model for desirable outcome and produces a proposed solution. This is repeated in iterations over which the algorithm learns through ‘cost analysis’ to find a best fit.Whilst the algorithm was able to learn how to detect the bricks in our model, it struggled to differentiate between joined bricks and where brick faces ended and the table surface began.As a result it was too aggressive in segmentation and removed the bottom parts of the bricks and caused the bounding boxes to understand the bricks as broken from failing to fill the volume of what a brick should be.(It would of improved with use but for sake of time we removed this step from the code)
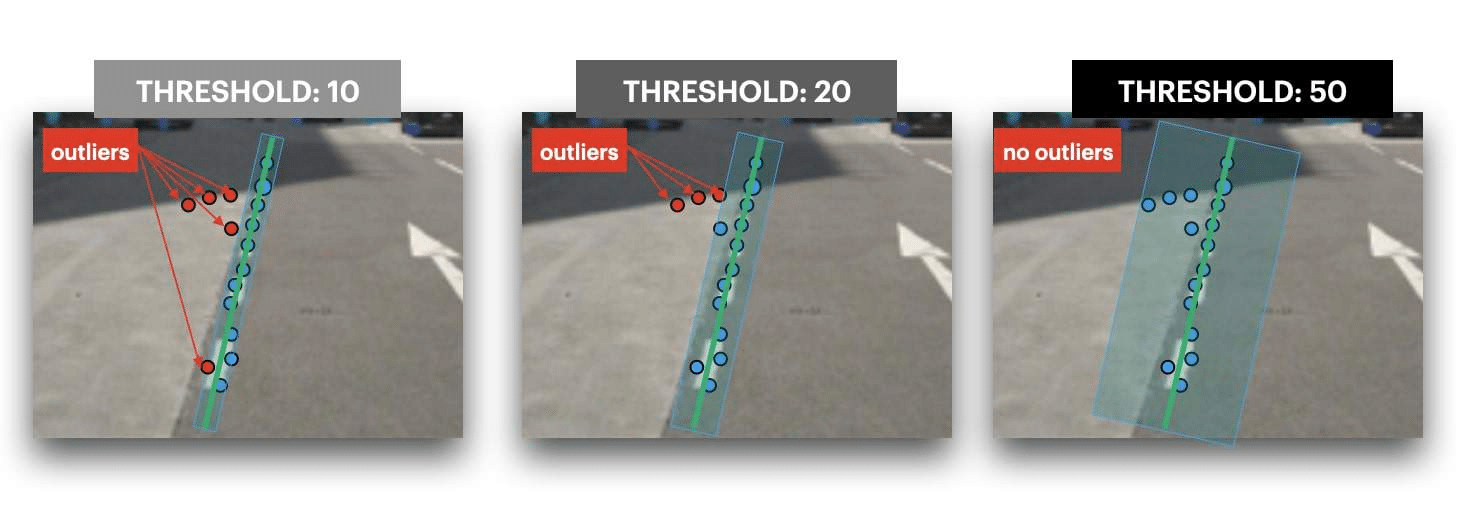
Table Removal: Alternative strategies
We took photos against a contrasting background to explore the possibility of using colour segmentation as proposed for the real version in our System Architecture
Multi-Plane RANSAC:
Whereas single plane RANSAC is designed to find the predominant surface: floor, wall, ect. Multiplane would be much more suitable for a demolition site where architectural elements could only be in part. (Demolished walls/ multi planar floor).
Colour Segmentation:
As proposed in our System architecture a key component of how the robot could find terracotta bricks would be Colour segmentation. By looking for the colour normals of the distinctive red, the robot would be able to quickly identify and distinguish the bricks from the rest of the site.
Z-Axis Cleaning:
Something we considered for the demo as opposed to the real model was using Z-Axis cleaning. (As everything would be above the table at Z0.) However, even with the tables we laid the bricks on were warped and so as in the real world made this as unsuitable solution.
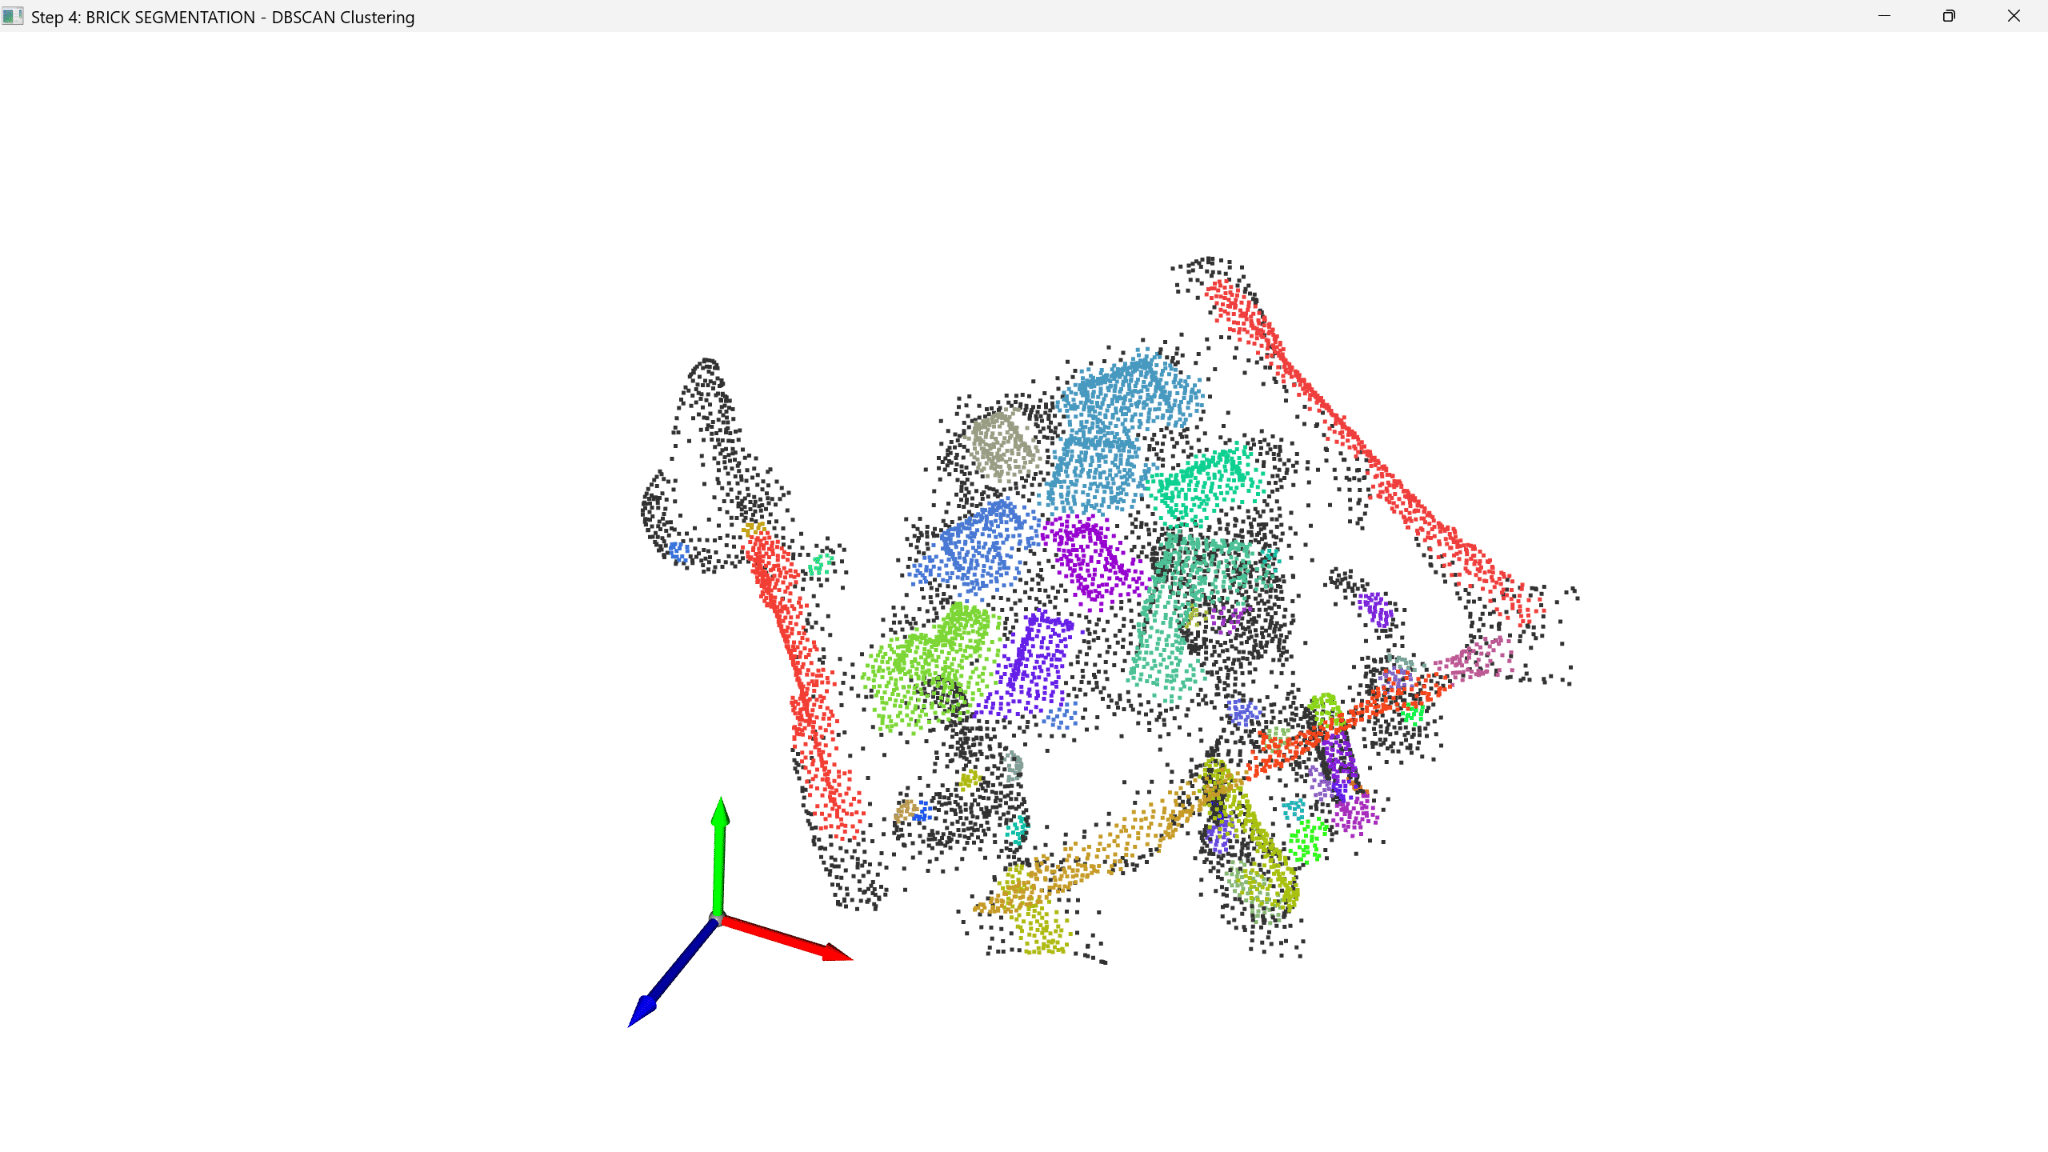
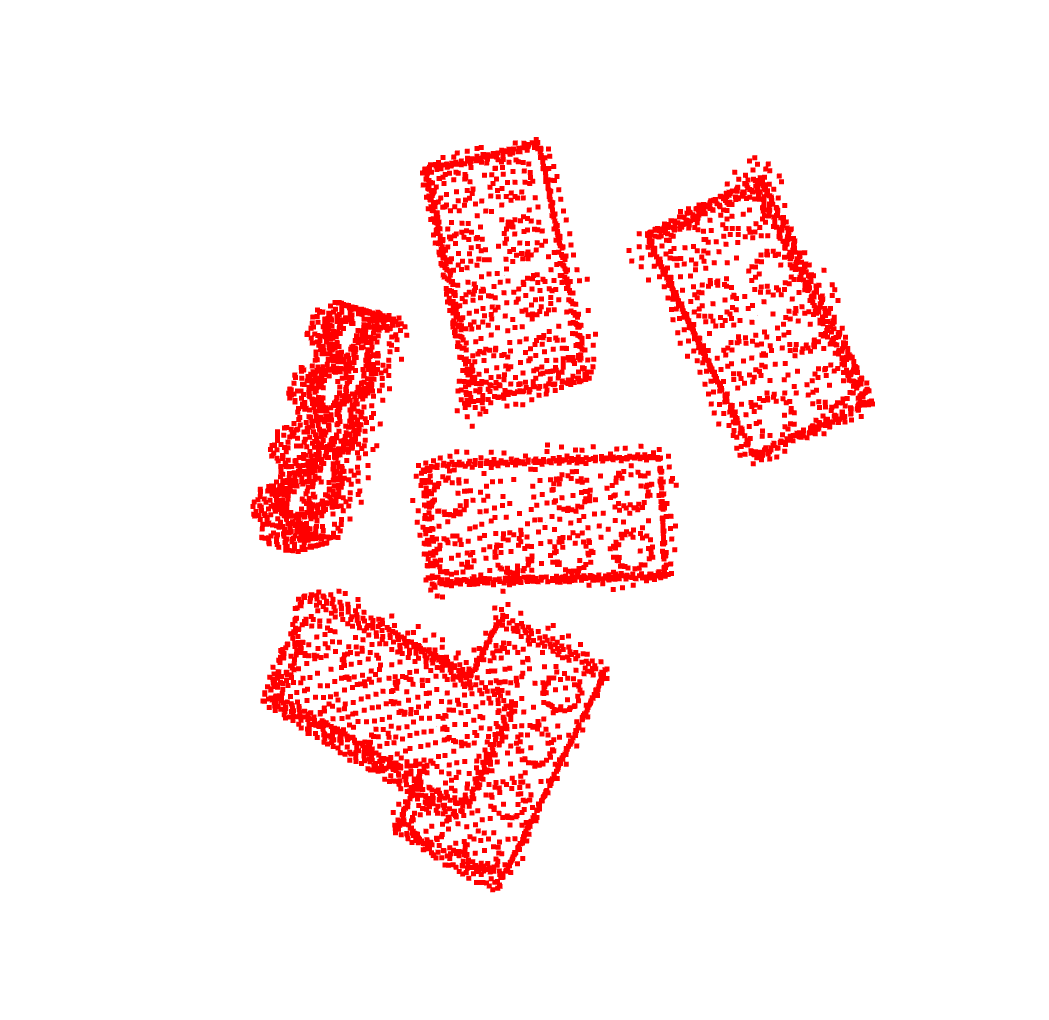
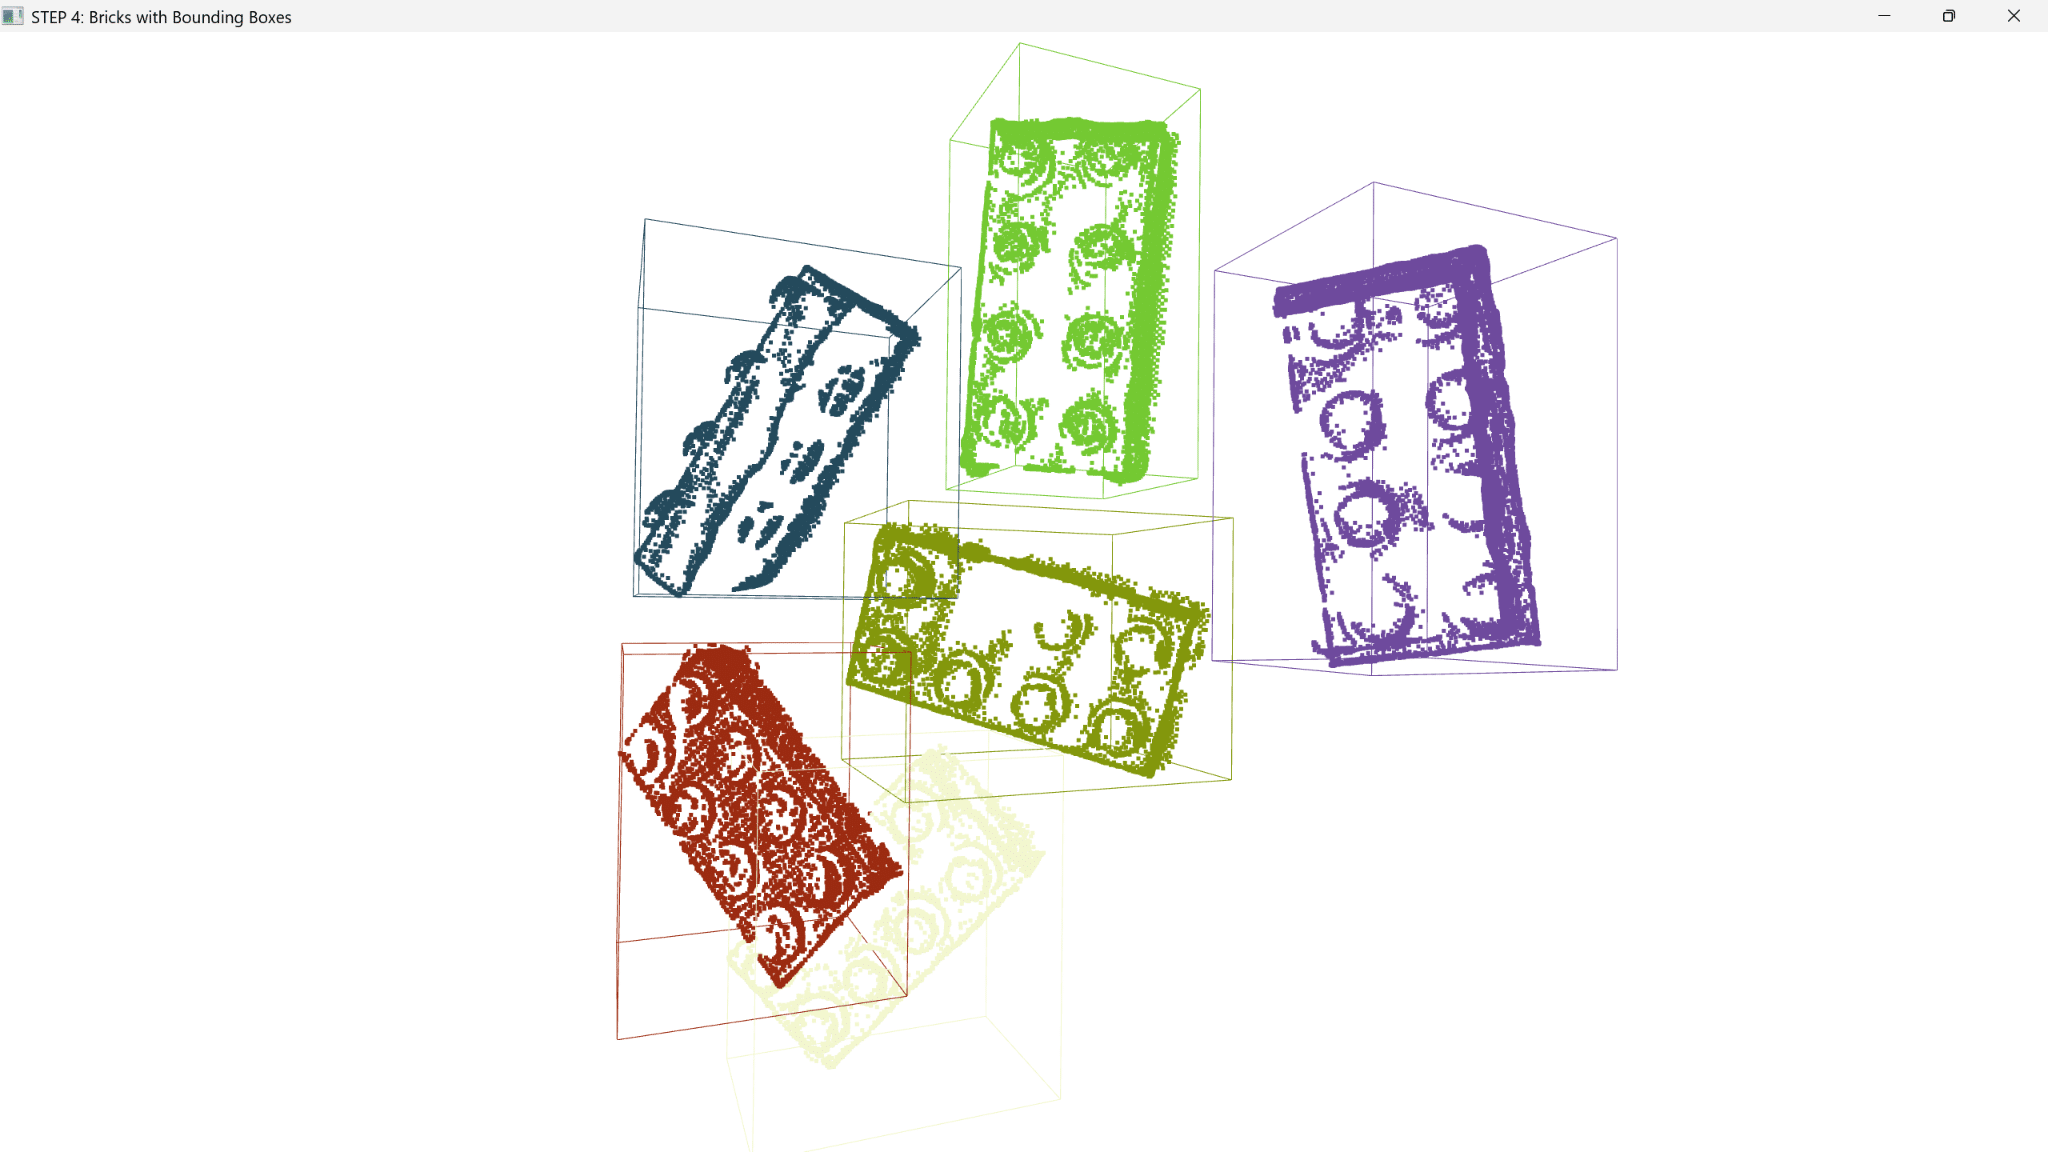
Clustering
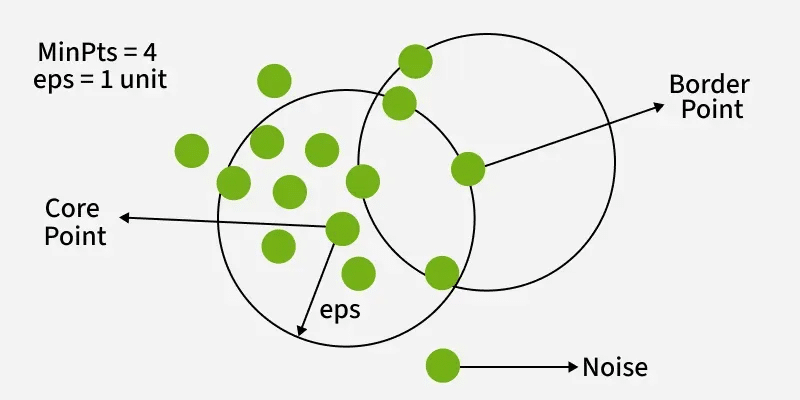
n the end we used Density Based clustering (DBSCAN) to identify the bricks in our model. This works by analyzing the relationship random points have with their neighbours. It looks at both:
- The epsilon (eps) which establishes a radius around the point.
- A minimum density of points required within the area defined by the eps.
With these two factors DBSCAN models draws a density mask over the point cloud and clusters accordingly.
The data was not cleaned properly and chairs around the table edge were falsely identified by the clustering as both potential and ‘desirable’ bricks.
Alternative Clustering: Using hierarchical models instead
DB SCAN:
- Works by density to differentiate between high and low levels and so is able to work with both regular and arbitrary forms.
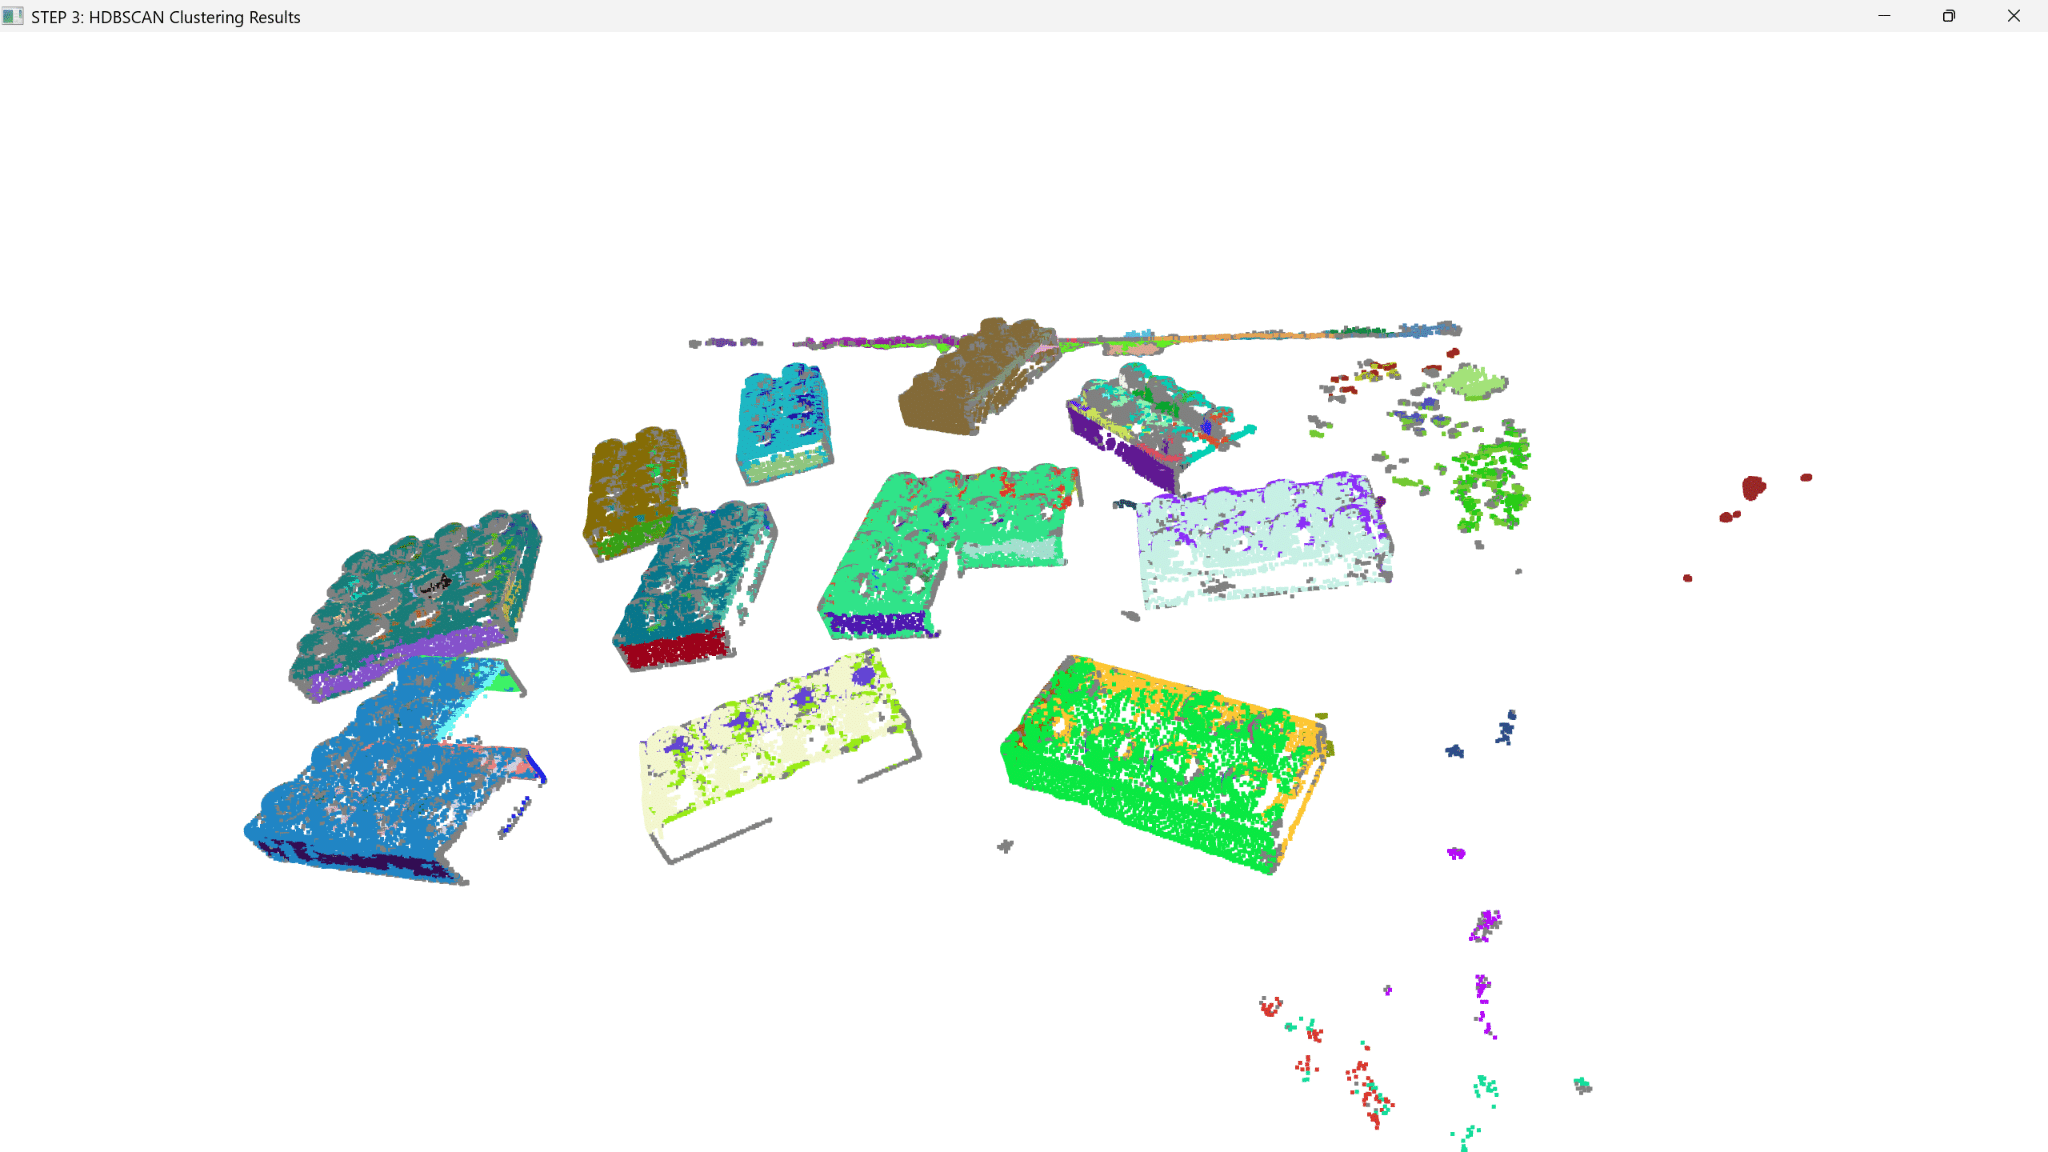
HDB SCAN (Hierarchical Density-Based)
- Similar to DB Scan but evolved to the sort of the identified clusters into a hierarchy. This then tests the variability of the clusters to understand what ‘real’ and reproducible relationships between different levels of granularity are.
OPTICS:
- Produces a reachability plot to assess the varying levels of density between clusters. However, cores must meet a minimum number of points within an eps before plotting.
AGRID/ GRID based density models:
- Divides the data into groups of cell and then performs analysis on the level of density in each cell. Adjacent high-density cells are then merged to form clusters. Potentially good for finding cuboid objects like bricks but less appropriate for irregular shaped building waste.
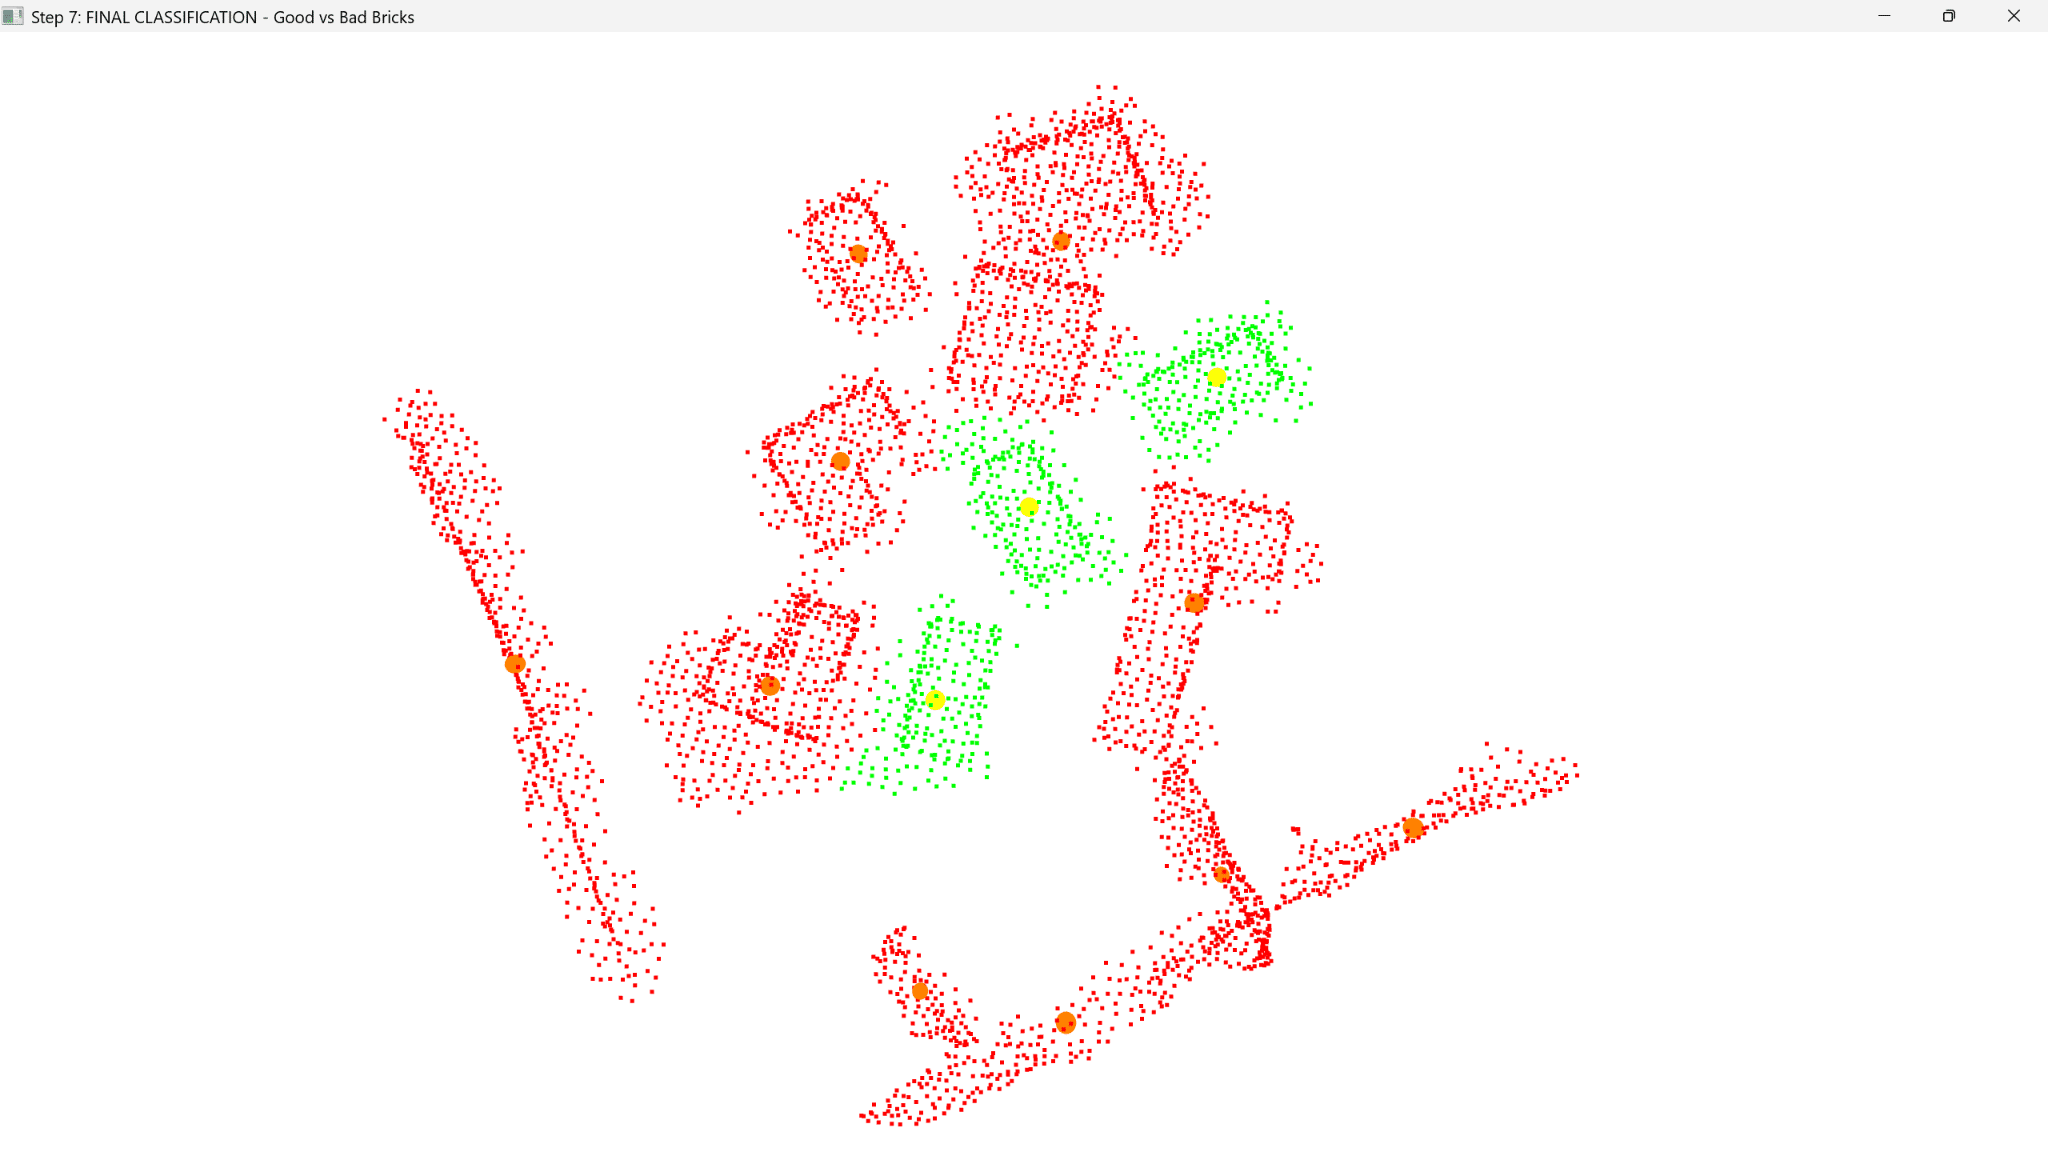
An issue we realised between different scenes of the data was the brick aspect was overfitted to work for just the original brick point clouds.
As a result the program had to be edified to be able identify different densities and dimension across scenes whilst keeping within constraints that separated how ‘good’ and ‘bad’ bricks were labelled.
Scene 1: ~200-300 points per brick
Scene 2 ~779-1552 points per brick
(3-5x denser!)
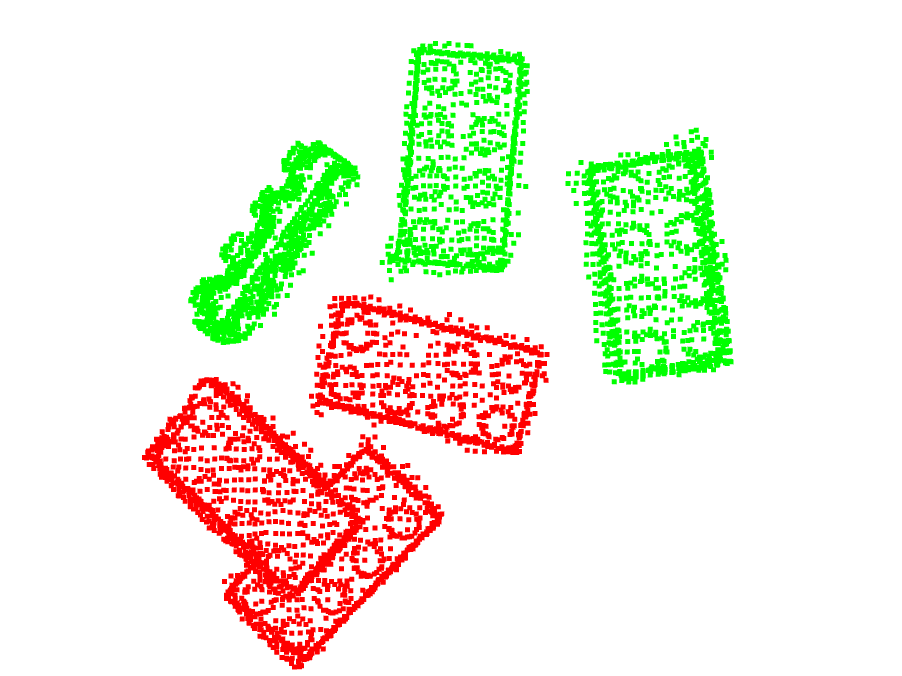
After
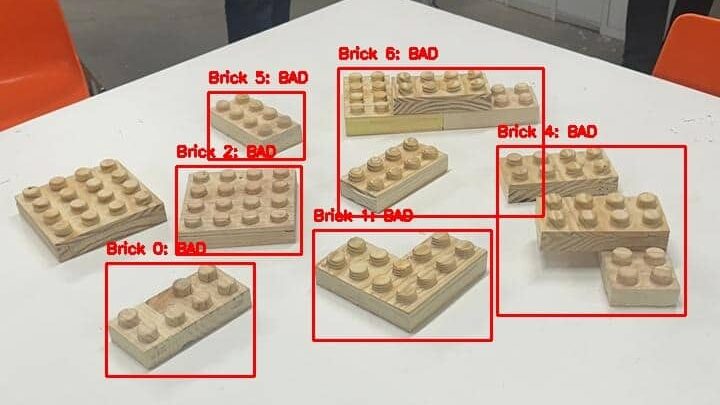
Yolo
We tried to use YOLO from the original RBG images as an overlay to the point cloud to confirm which brick were desirable.
However, we experienced initial problems with training the library especially with image distortion, bricks being non-flat positions, proximity.
This was then further impounded by 2D-to-3D mapping complexities between YOLO and the point cloud. Especially with the studs whilst they were easily countable in an RGB, aligning this to a 3D space resulted in many bugs.
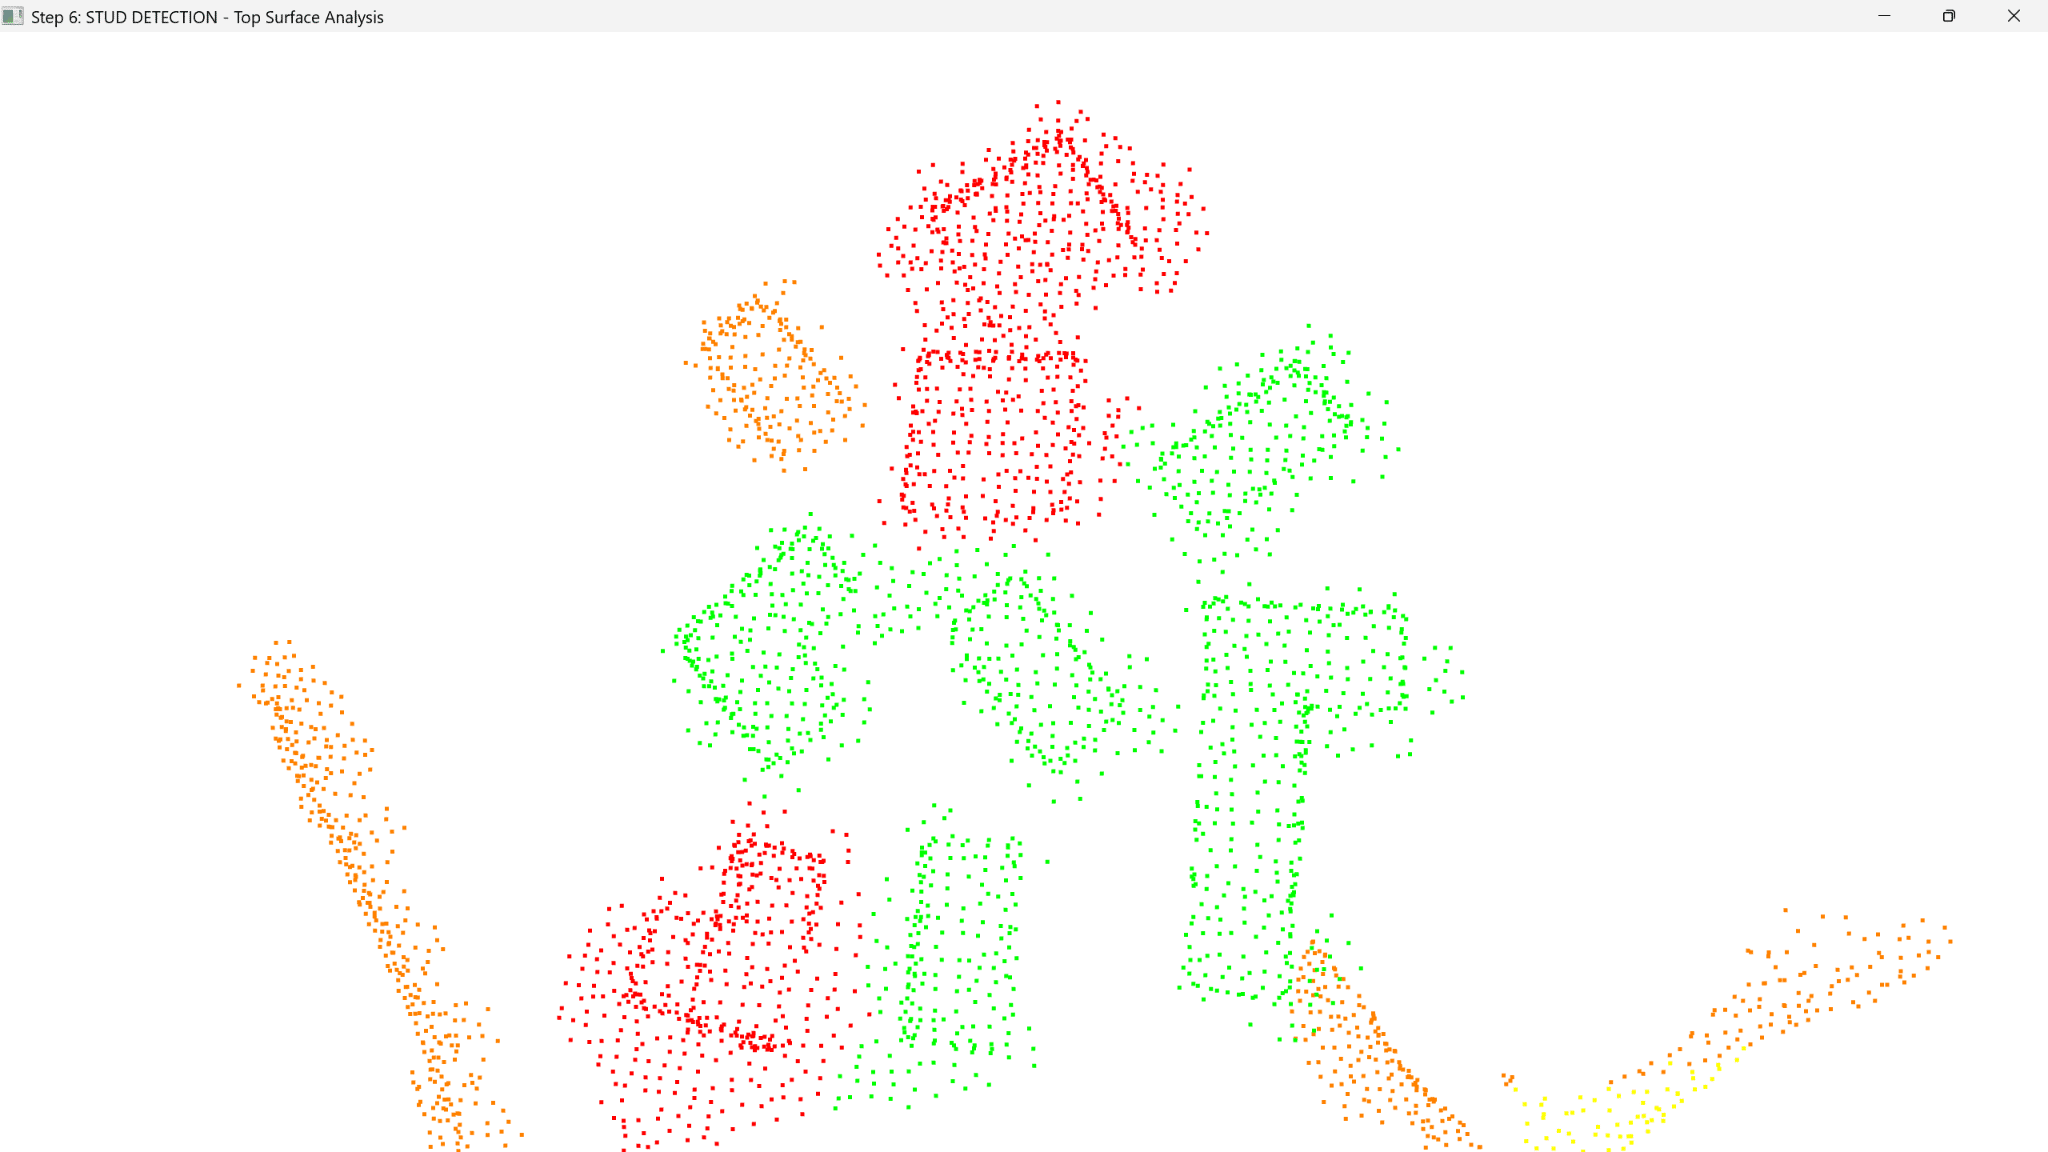
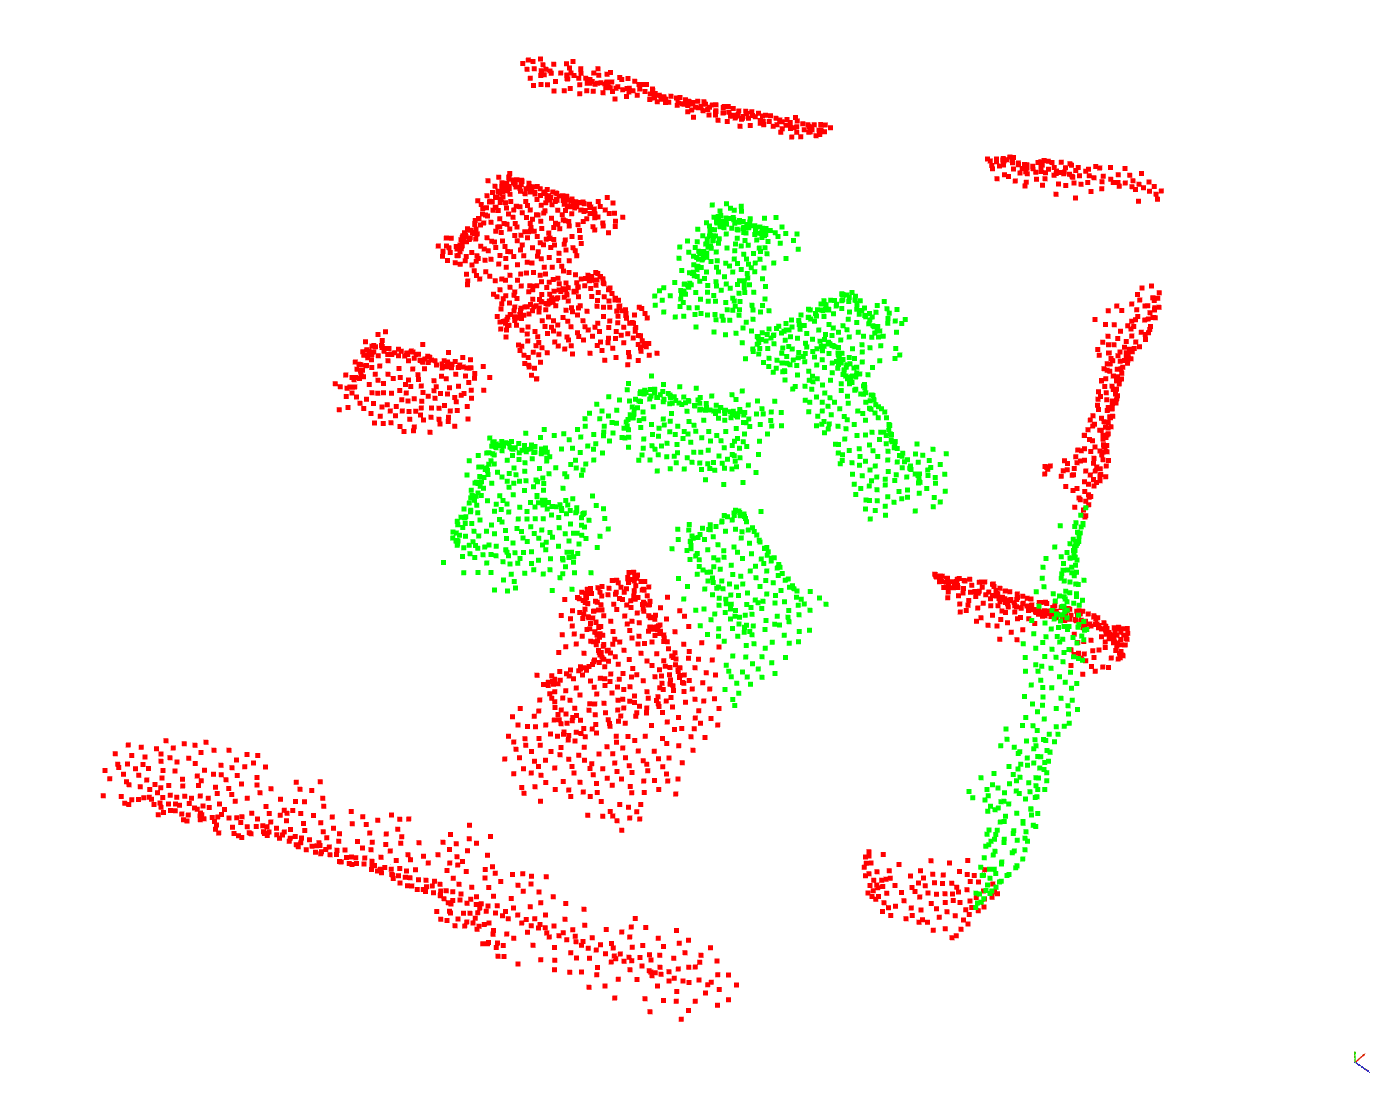
HDB SCAN and Colour Segmentation
After using DB Scan we explored using HDB SCAN and colour segmentation to first, better detect the bricks by their colour and then secondly, read the surface textures for the text and differentiate between touching bricks.
Something we had to think about when using these two together was the range of colour weights.
A wide range of RBG values:
R:120-240, G:100-230, B:80-200
helped catch all the bricks point for segmentation, but then meant the bricks surface clusters were 114 multiple smaller relationships than 11 singular objects.
