
Tile-based machine-learning workflow for indoor plant suitability prediction
Introduction
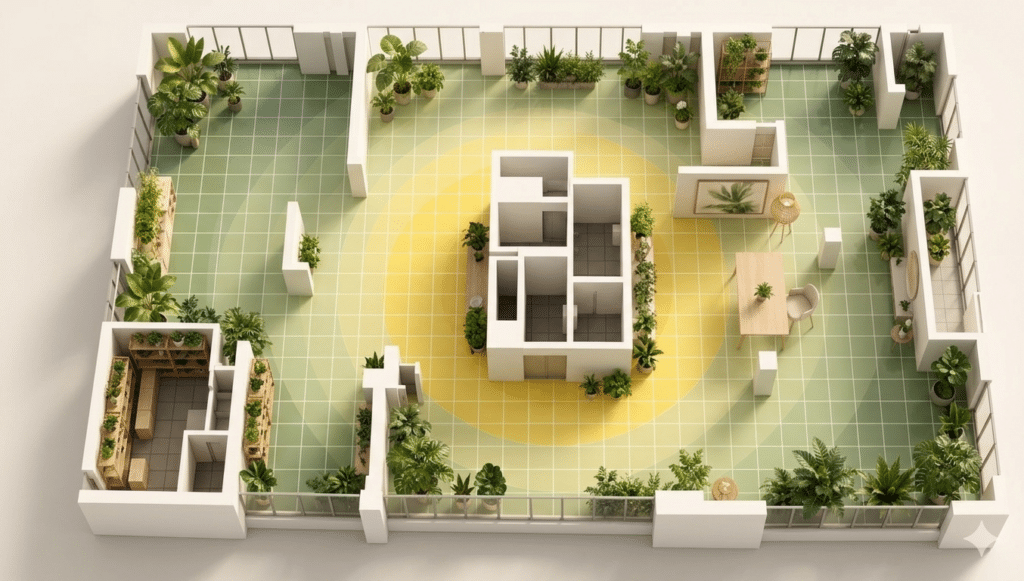
Plant placement in interior spaces is usually treated as an intuitive or aesthetic decision. However, different areas inside the same room can receive very different levels of sun, radiation, useful daylight and humidity. This project proposes a machine-learning workflow to classify interior space into plant suitability categories and support design decisions through a readable spatial recommendation map.
Research Framing
Research Problem
Interior plant placement is often not systematically encoded during early-stage design. Architects may know that a room receives natural light, but this does not mean that all locations inside the room provide the same environmental conditions for plants.
The main research question is: Can environmental data help predict which plant profiles are suitable for each location inside an interior space?
Project Aim
The aim of the project is to classify interior space into plant suitability categories. The workflow connects environmental tile data with plant requirement profiles and prepares the results for visualization and deployment in Grasshopper.
The objective is not to replace design judgement, but to create a traceable decision layer that helps designers understand why a plant profile may be more suitable in one location than another.
Computational Workflow Overview
The project follows a structured computational workflow:
- Clean and encode plant requirement data.
- Cluster plants into environmental plant profiles.
- Divide indoor scenarios into comparable environmental tiles.
- Score each tile against each plant profile.
- Generate a derived classification label based on highest suitability probability.
- Train and validate machine-learning models.
- Export final predictions for Grasshopper visualization.
Dataset Construction and Environmental Encoding
Plant Requirement Dataset
The plant dataset contains 209 cleaned plant records. Botanical descriptions were converted into comparable environmental variables, including:
- Direct sun range
- Shade tolerance
- Lux range
- Humidity range
- Soil moisture
- Drought tolerance
- Temperature preference
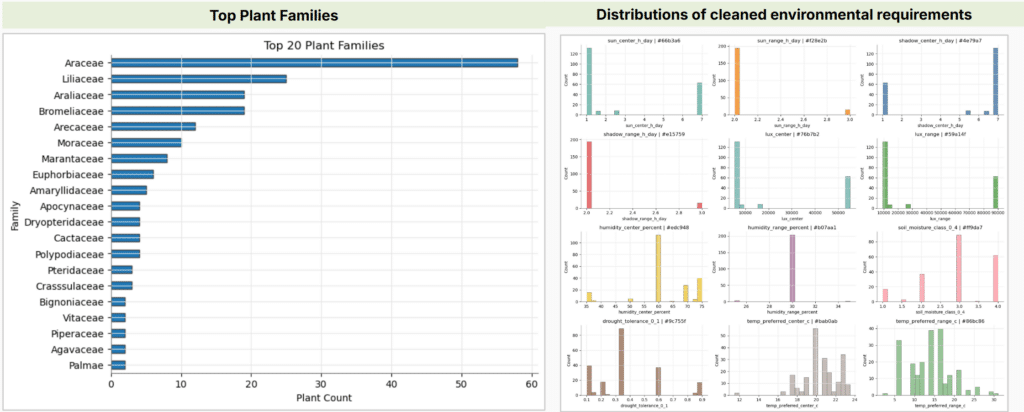
This process converts qualitative plant information into a numerical parameter space. Instead of treating each plant as an isolated species, the workflow groups plants according to shared environmental strategies.
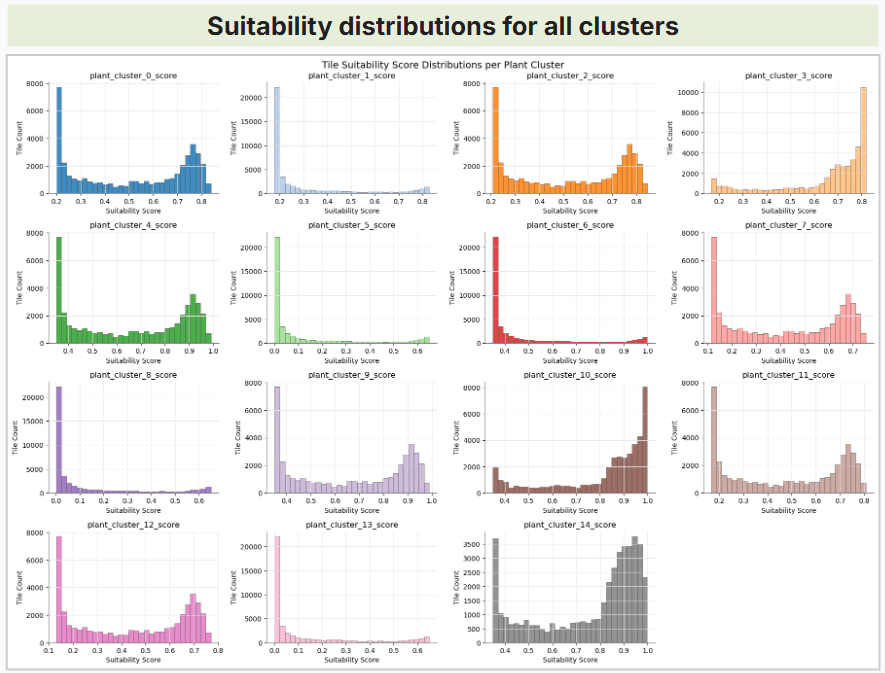
Plant Clustering
K-means clustering was used to organize the 209 plants into environmental profiles. The number of clusters was selected using elbow and silhouette diagnostics.
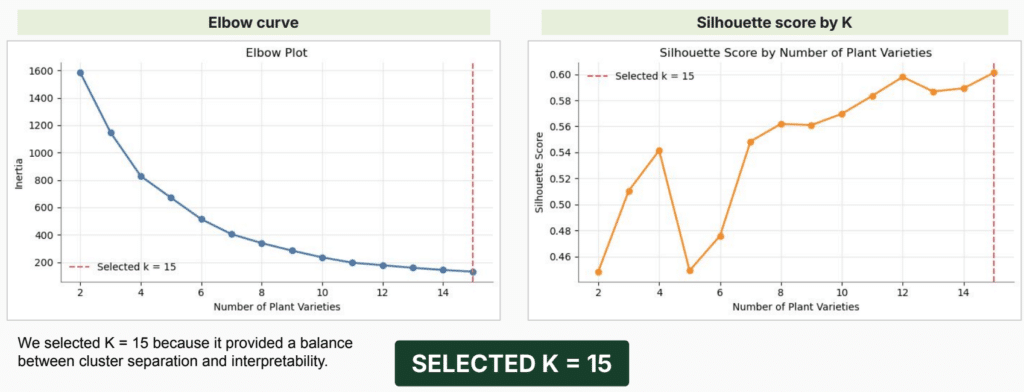
The final value was K = 15, because it provided a balance between cluster separation and interpretability.
These clusters do not represent individual species. Each cluster represents a plant suitability profile based on similar combinations of light, humidity, moisture, drought tolerance and temperature requirements.

Indoor Environmental Tiles
The spatial dataset is based on the idea that a room is not one uniform environment. Environmental conditions change depending on building orientation, facade ratios and the position of each point inside the room.
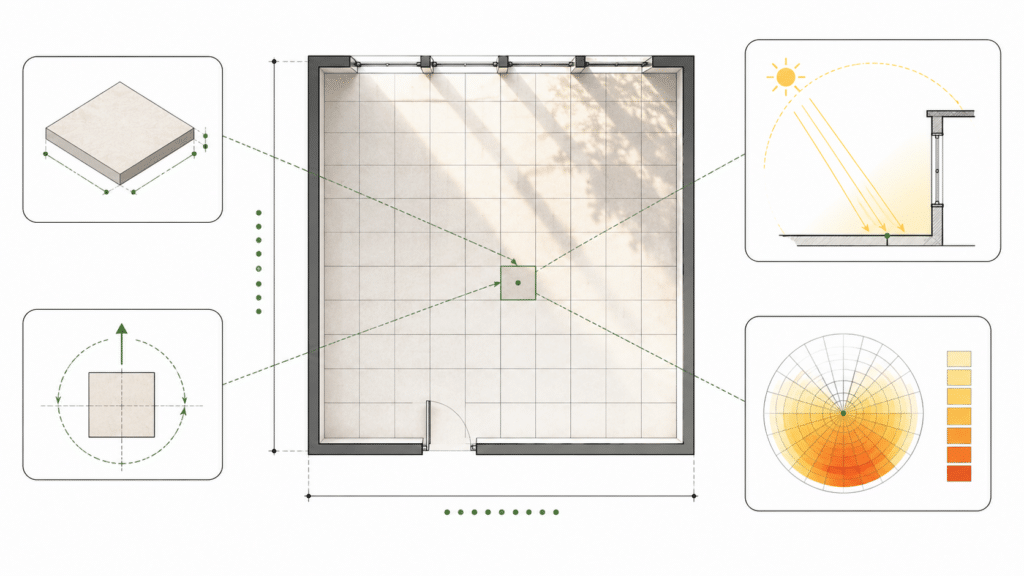
Each design scenario is divided into a grid of 100 comparable tiles. Every tile stores environmental information such as:
- Relative humidity
- Useful Daylight Illuminance, or UDI
- Sun hours
- Radiation
- Light index
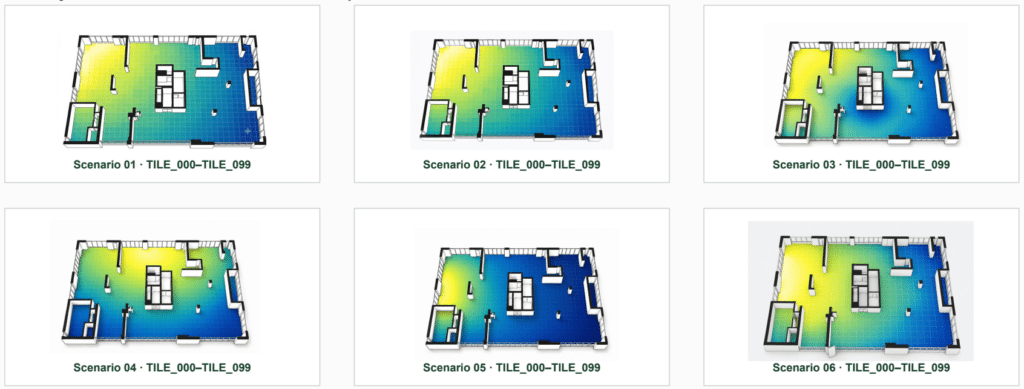
The project evaluates 431 scenarios. Since each scenario contains 100 tiles, the final spatial dataset contains:
431 scenarios × 100 tiles = 43,100 tile records
Suitability Scoring and Label Generation
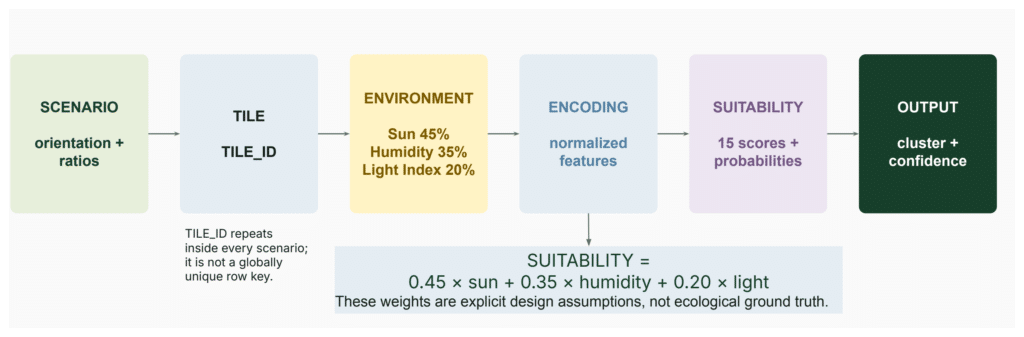
Each tile is compared with all 15 plant profiles. The suitability score is calculated using a weighted compatibility formula:
Suitability = 0.45 × sun compatibility + 0.35 × humidity compatibility + 0.20 × light index compatibility
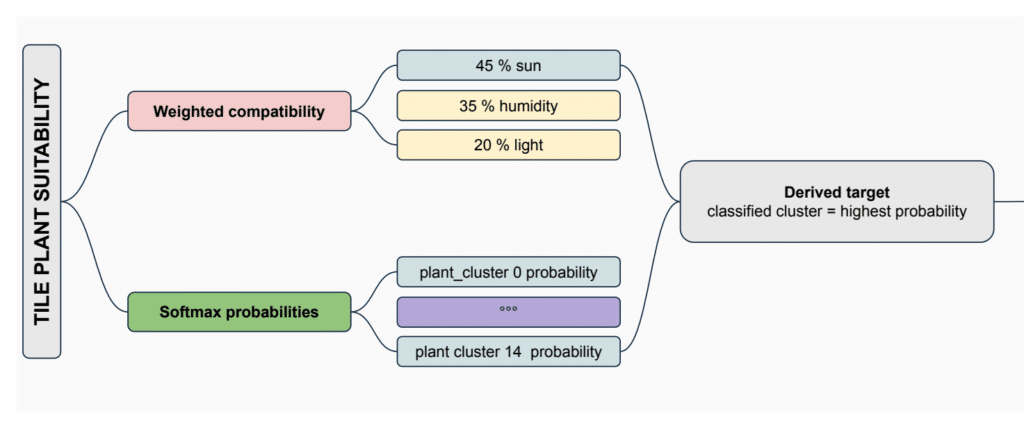
These weights are explicit design assumptions. They make the decision process clear and traceable, but they should not be interpreted as universal ecological truth.
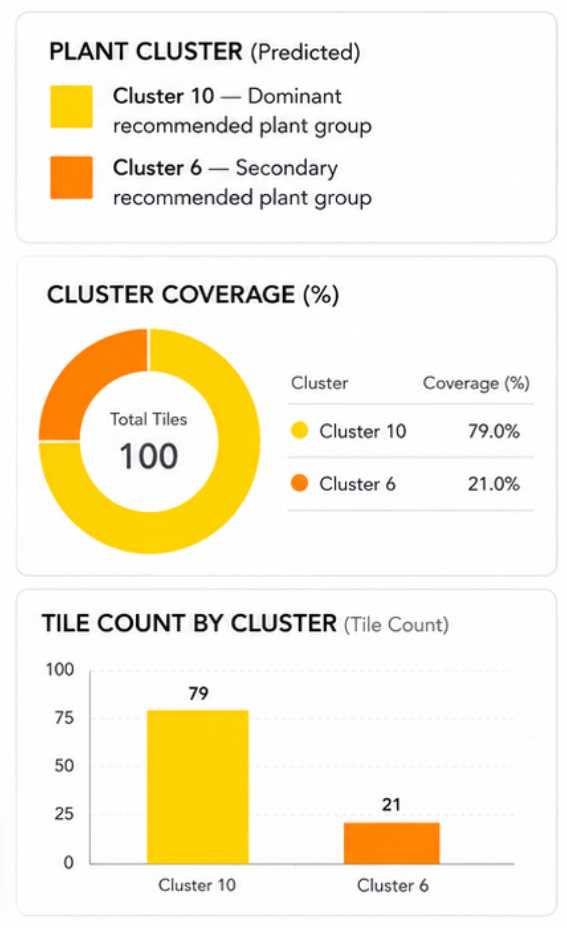
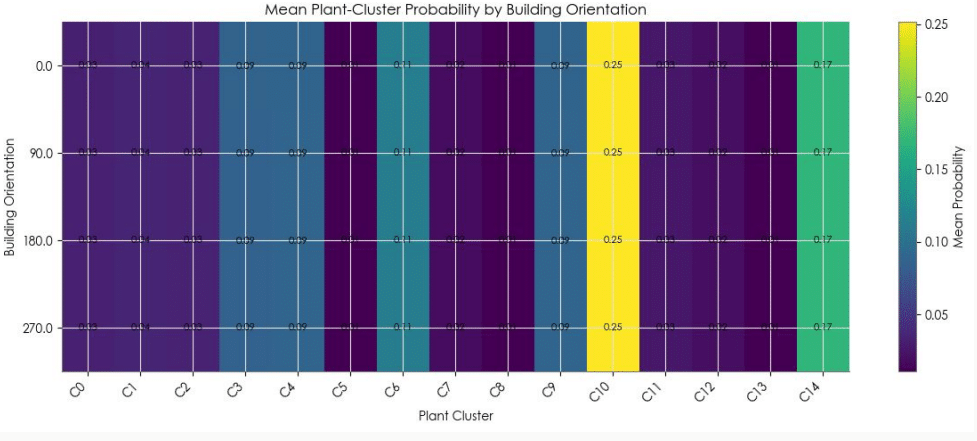
For every tile, the workflow generates 15 plant cluster scores and converts them into probabilities. The cluster with the highest probability becomes the derived label: classified_cluster.
Machine-Learning Validation
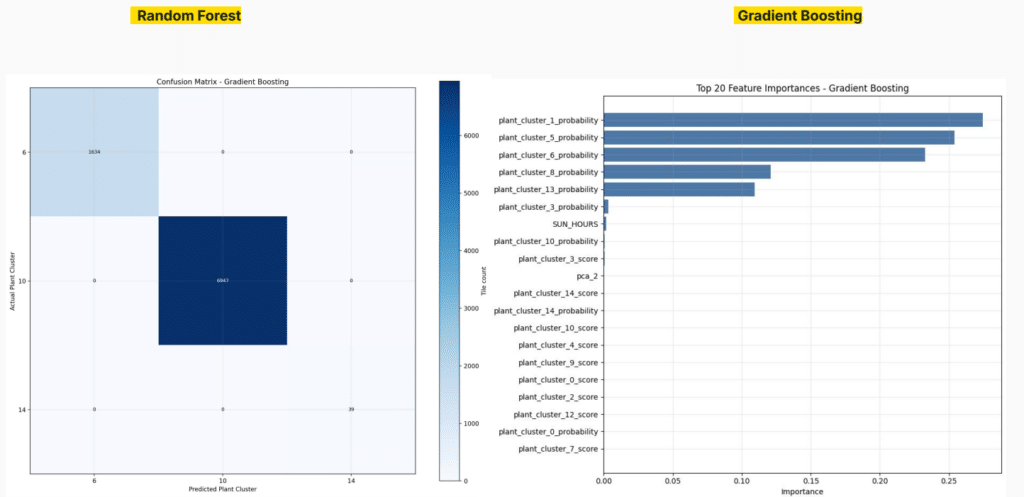
The project uses the derived classified_cluster label as the target for machine-learning classification. Two main model families were tested:
- Random Forest
- Gradient Boosting
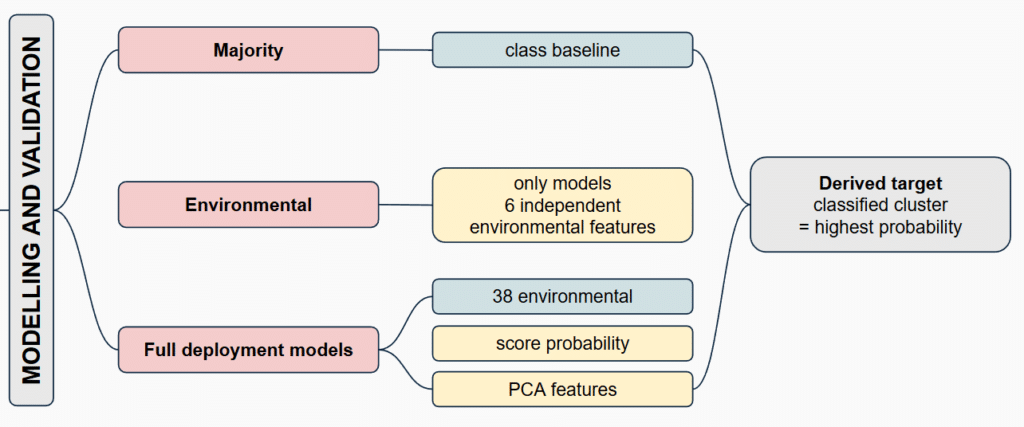
The validation separates two different questions:
- Environmental-only models test whether raw spatial conditions can predict plant suitability.
- Full deployment models include environmental features, suitability scores, probabilities and PCA features, acting as a deployment layer for Grasshopper.
Because the target label is generated from the scoring workflow, the model results are interpreted as internal workflow consistency, not as independent ecological validation.
Class Imbalance
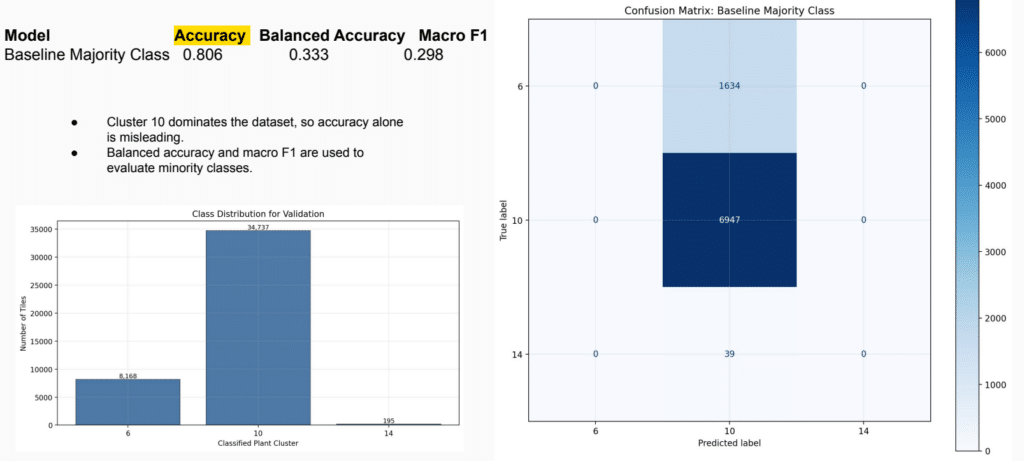
The dataset is imbalanced. Cluster 10 dominates many scenarios, so accuracy alone can be misleading. For this reason, balanced accuracy and macro F1-score are used to evaluate how well the model performs across minority classes.
This distinction is important because a model can appear accurate by predicting the dominant class, while still performing poorly on less frequent plant profiles.
Grasshopper Deployment
The final output is exported as a CSV file for Grasshopper. The deployment does not load all 43,100 rows at once. Instead, Grasshopper reads one selected scenario at a time, using 100 tiles per scenario.
The deployment workflow uses:
- CSV path
- Start row
- Maximum rows
- Python CSV reader
- Tile generator
- Custom Preview
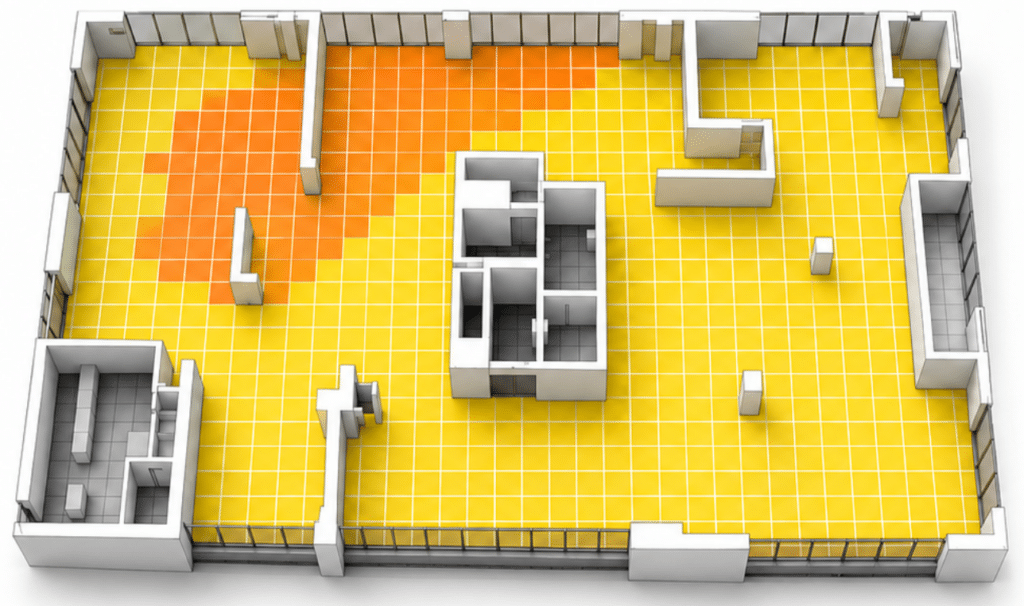
The final Grasshopper visualization maps each TILE_ID with its predicted plant cluster, producing a coloured spatial tile map.
Limitations
The project has several important limitations:
- The classified labels are generated from the scoring workflow, not from real plant survival observations.
- The dataset is imbalanced, with Cluster 10 dominating many scenarios.
- The suitability weights are design assumptions.
- The Grasshopper deployment currently visualizes one selected scenario at a time.
Future Work
Future development could include:
- Real monitored plant performance data.
- Additional environmental variables such as airflow, maintenance, seasonal variation and temperature.
- Testing the workflow on real interior layouts.
- Improving the Grasshopper interface for interactive scenario selection.
Final Contribution
Plant Suitability Predictor demonstrates how environmental simulation, plant requirement data and machine learning can be combined into a spatial recommendation workflow for interior planting.
The project contributes a method for translating environmental tile data into plant suitability predictions, while keeping the process transparent, interpretable and ready for computational design deployment.
Rather than producing a fixed planting plan, the workflow creates a flexible decision layer that can support architects when evaluating where different plant profiles may perform better inside interior spaces.
