
In the traditional Architecture, Engineering, and Construction (AEC) industry, there is a painful disconnect between the creation of geometry and the calculation of its cost. Architects design in spatial environments (CAD, BIM), while Quantity Surveyors and estimators work in abstract spreadsheets. The result? Budget overruns are usually discovered weeks after a design phase concludes, leading to heavy-handed, reactive Value Engineering that compromises the original design intent.
What if we could bridge this gap? What if you could literally see where your budget resides inside a 3D floor plan in real-time?
PlanWise is a decision-support system that takes building spatial data and maps expenditure directly onto the building’s geometry.
In this post, we’ll take a deep dive into the PlanWise platform, how our pipeline works under the hood, and how we are using Large Language Models (LLMs) to automate cost matching, sustainability analysis, and client profiling.
The Vision: Who is PlanWise For?
We designed PlanWise to democratize financial and material intelligence across the entire lifecycle of a project. Our interface caters to four distinct personas:
- Project Architects: For the designers who need to make agile material and layout decisions early in the schematic phase, while the geometry still has room to adapt.
- Design Teams: For teams working directly with strict client briefs, resolving design conflicts using real-time budget constraints.
- Enterprise Companies: For firms dealing with returning clients, allowing them to instantly align new proposals with historical spending habits.
- The Client: For owners and developers who want to independently explore “What if?” scenarios without needing to learn complex BIM software.
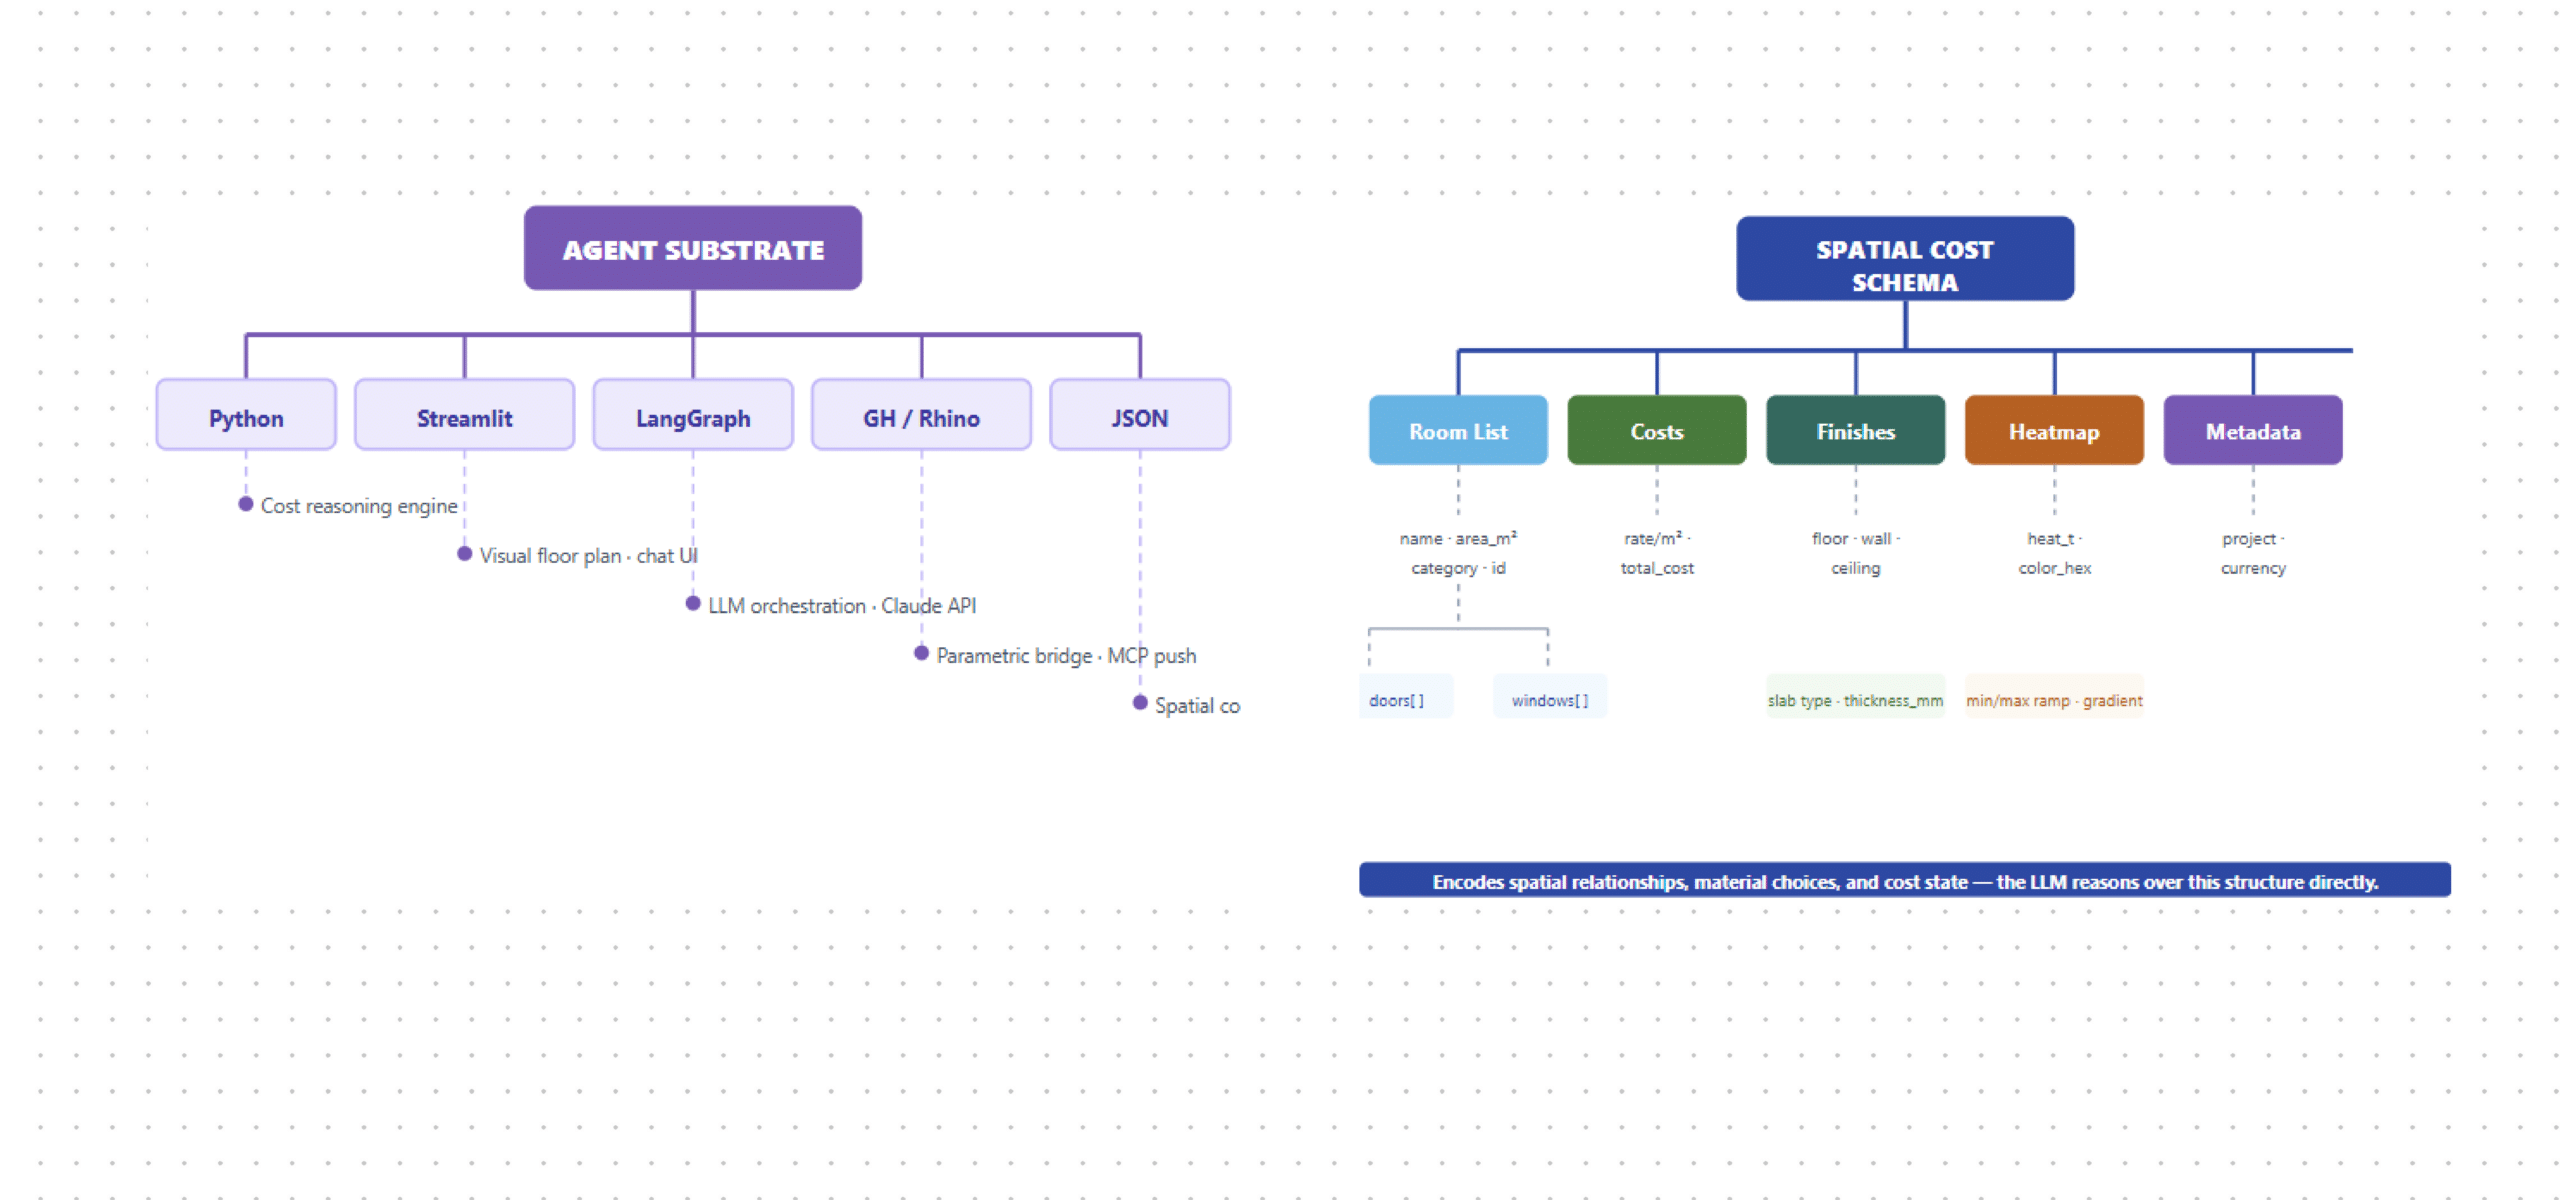
Agent Substrate & Spatial Cost Schema
The system runs on five layers — Python, Streamlit, LangGraph, Grasshopper/Rhino, and JSON — unified by a spatial cost schema encoding rooms, finishes, heatmap values, and metadata as a single structure the LLM reasons over directly.
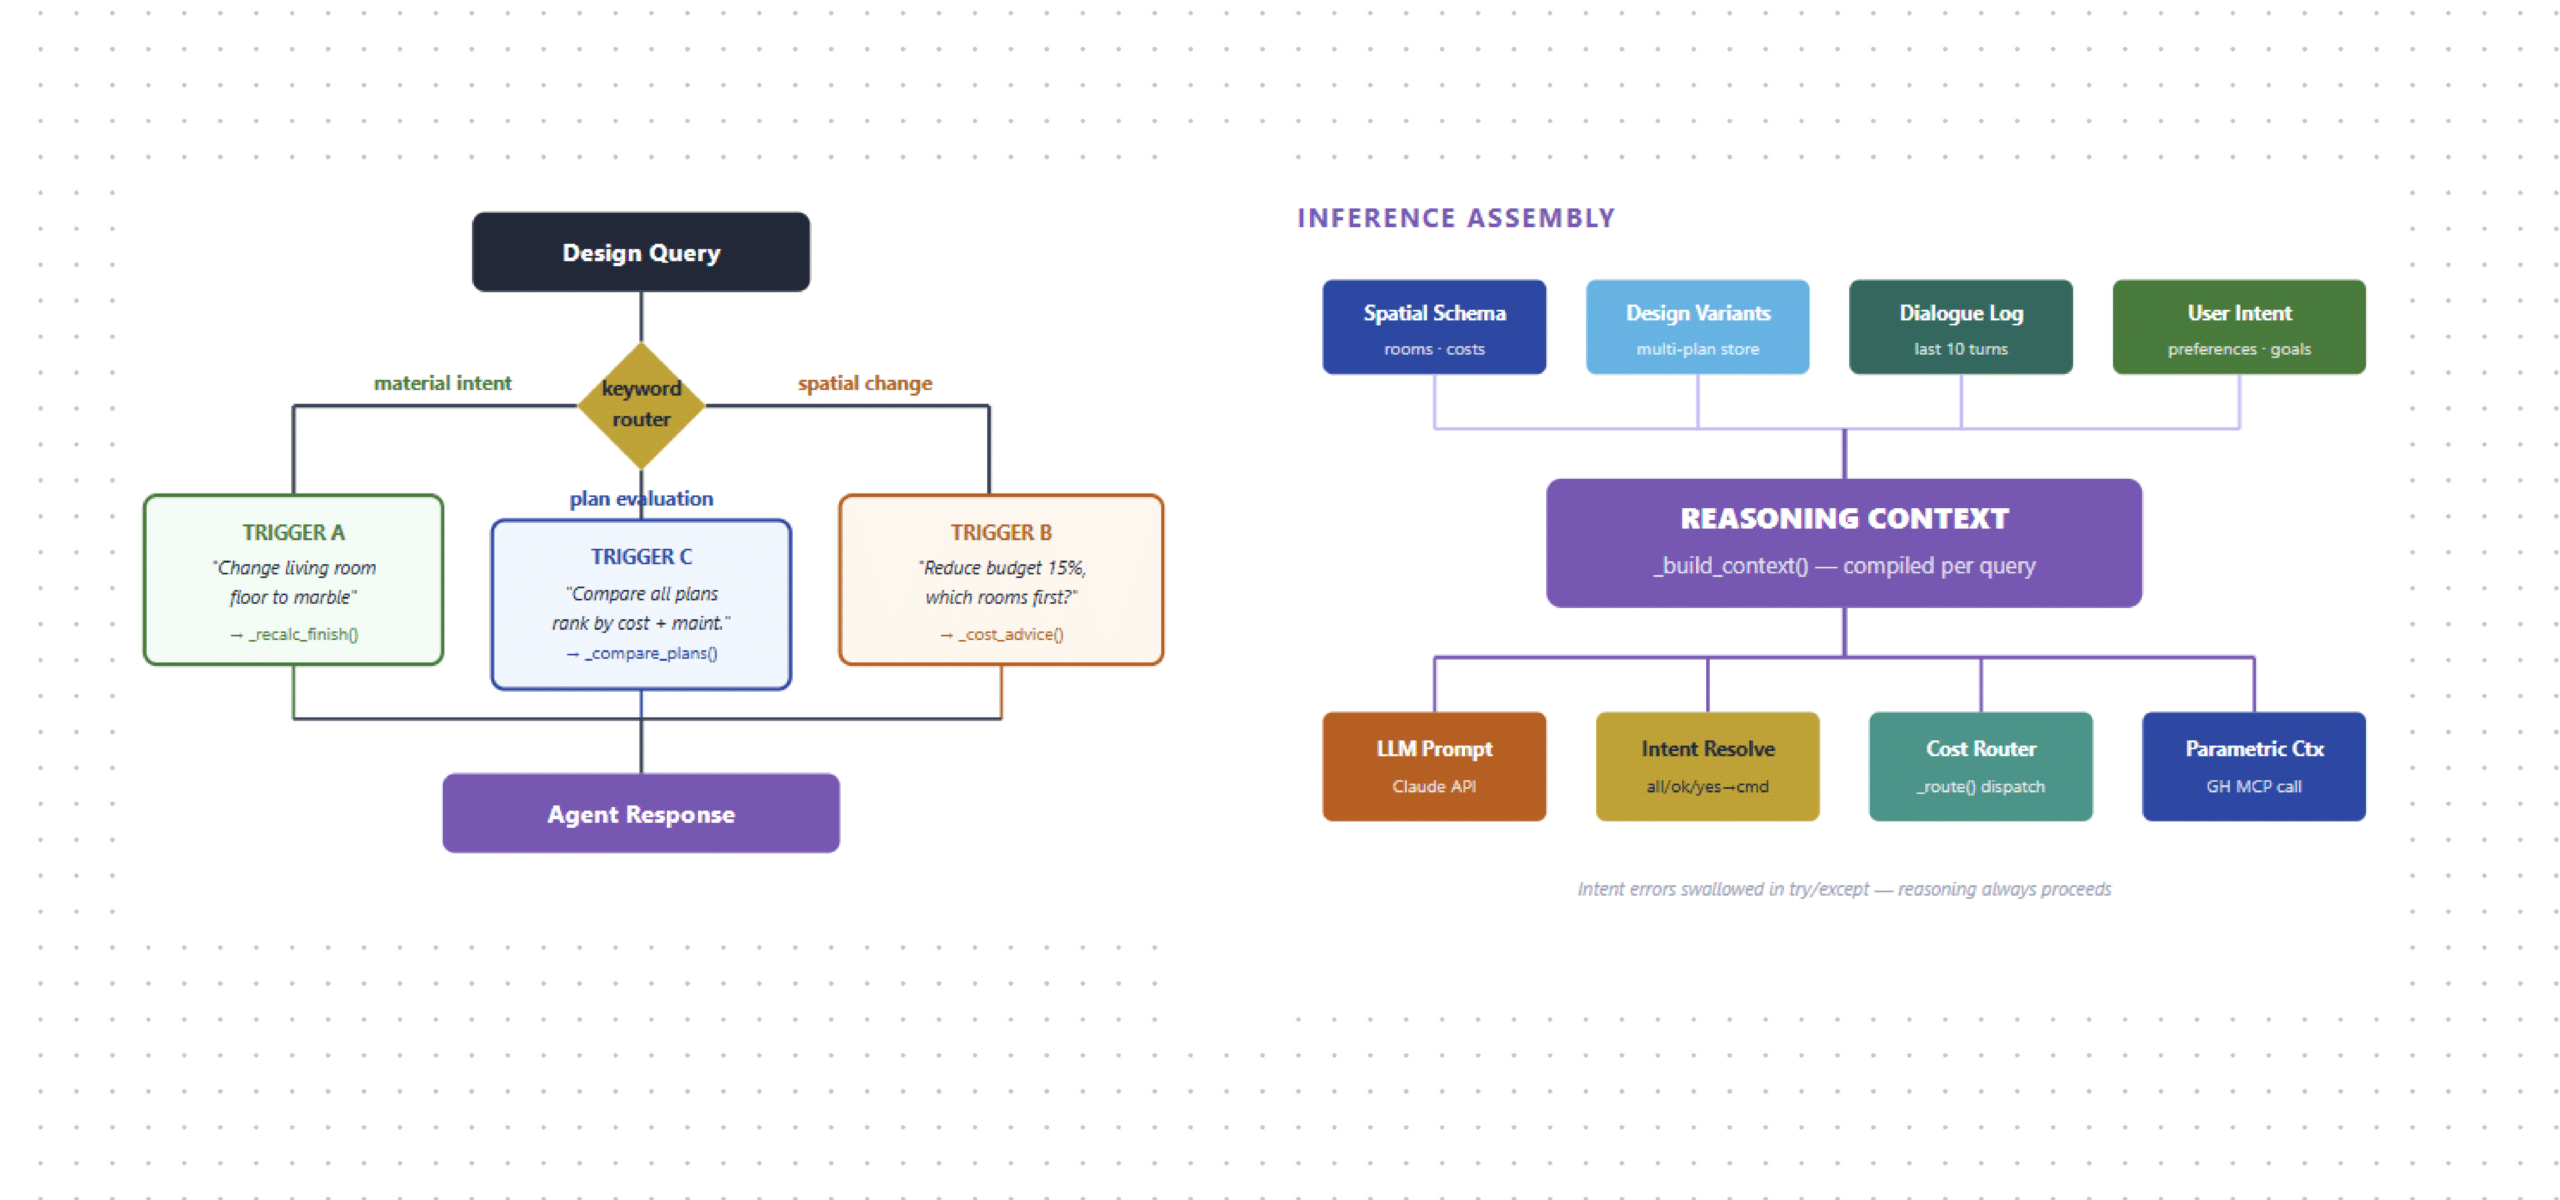
Design Query & Inference Assembly
The copilot starts by classifying every user message through a keyword router — material intent, spatial change, or plan evaluation — then assembles a reasoning context from the spatial schema, dialogue history, and design variants before passing it to the LLM.
LangGraph Agent Functional Architecture
The agent orchestrates four subsystems: a router decides the path, a copilot handles cost reasoning, a mutation engine applies layout changes, and a Grasshopper push syncs results back to Rhino live — all coordinated through a single LangGraph state machine.
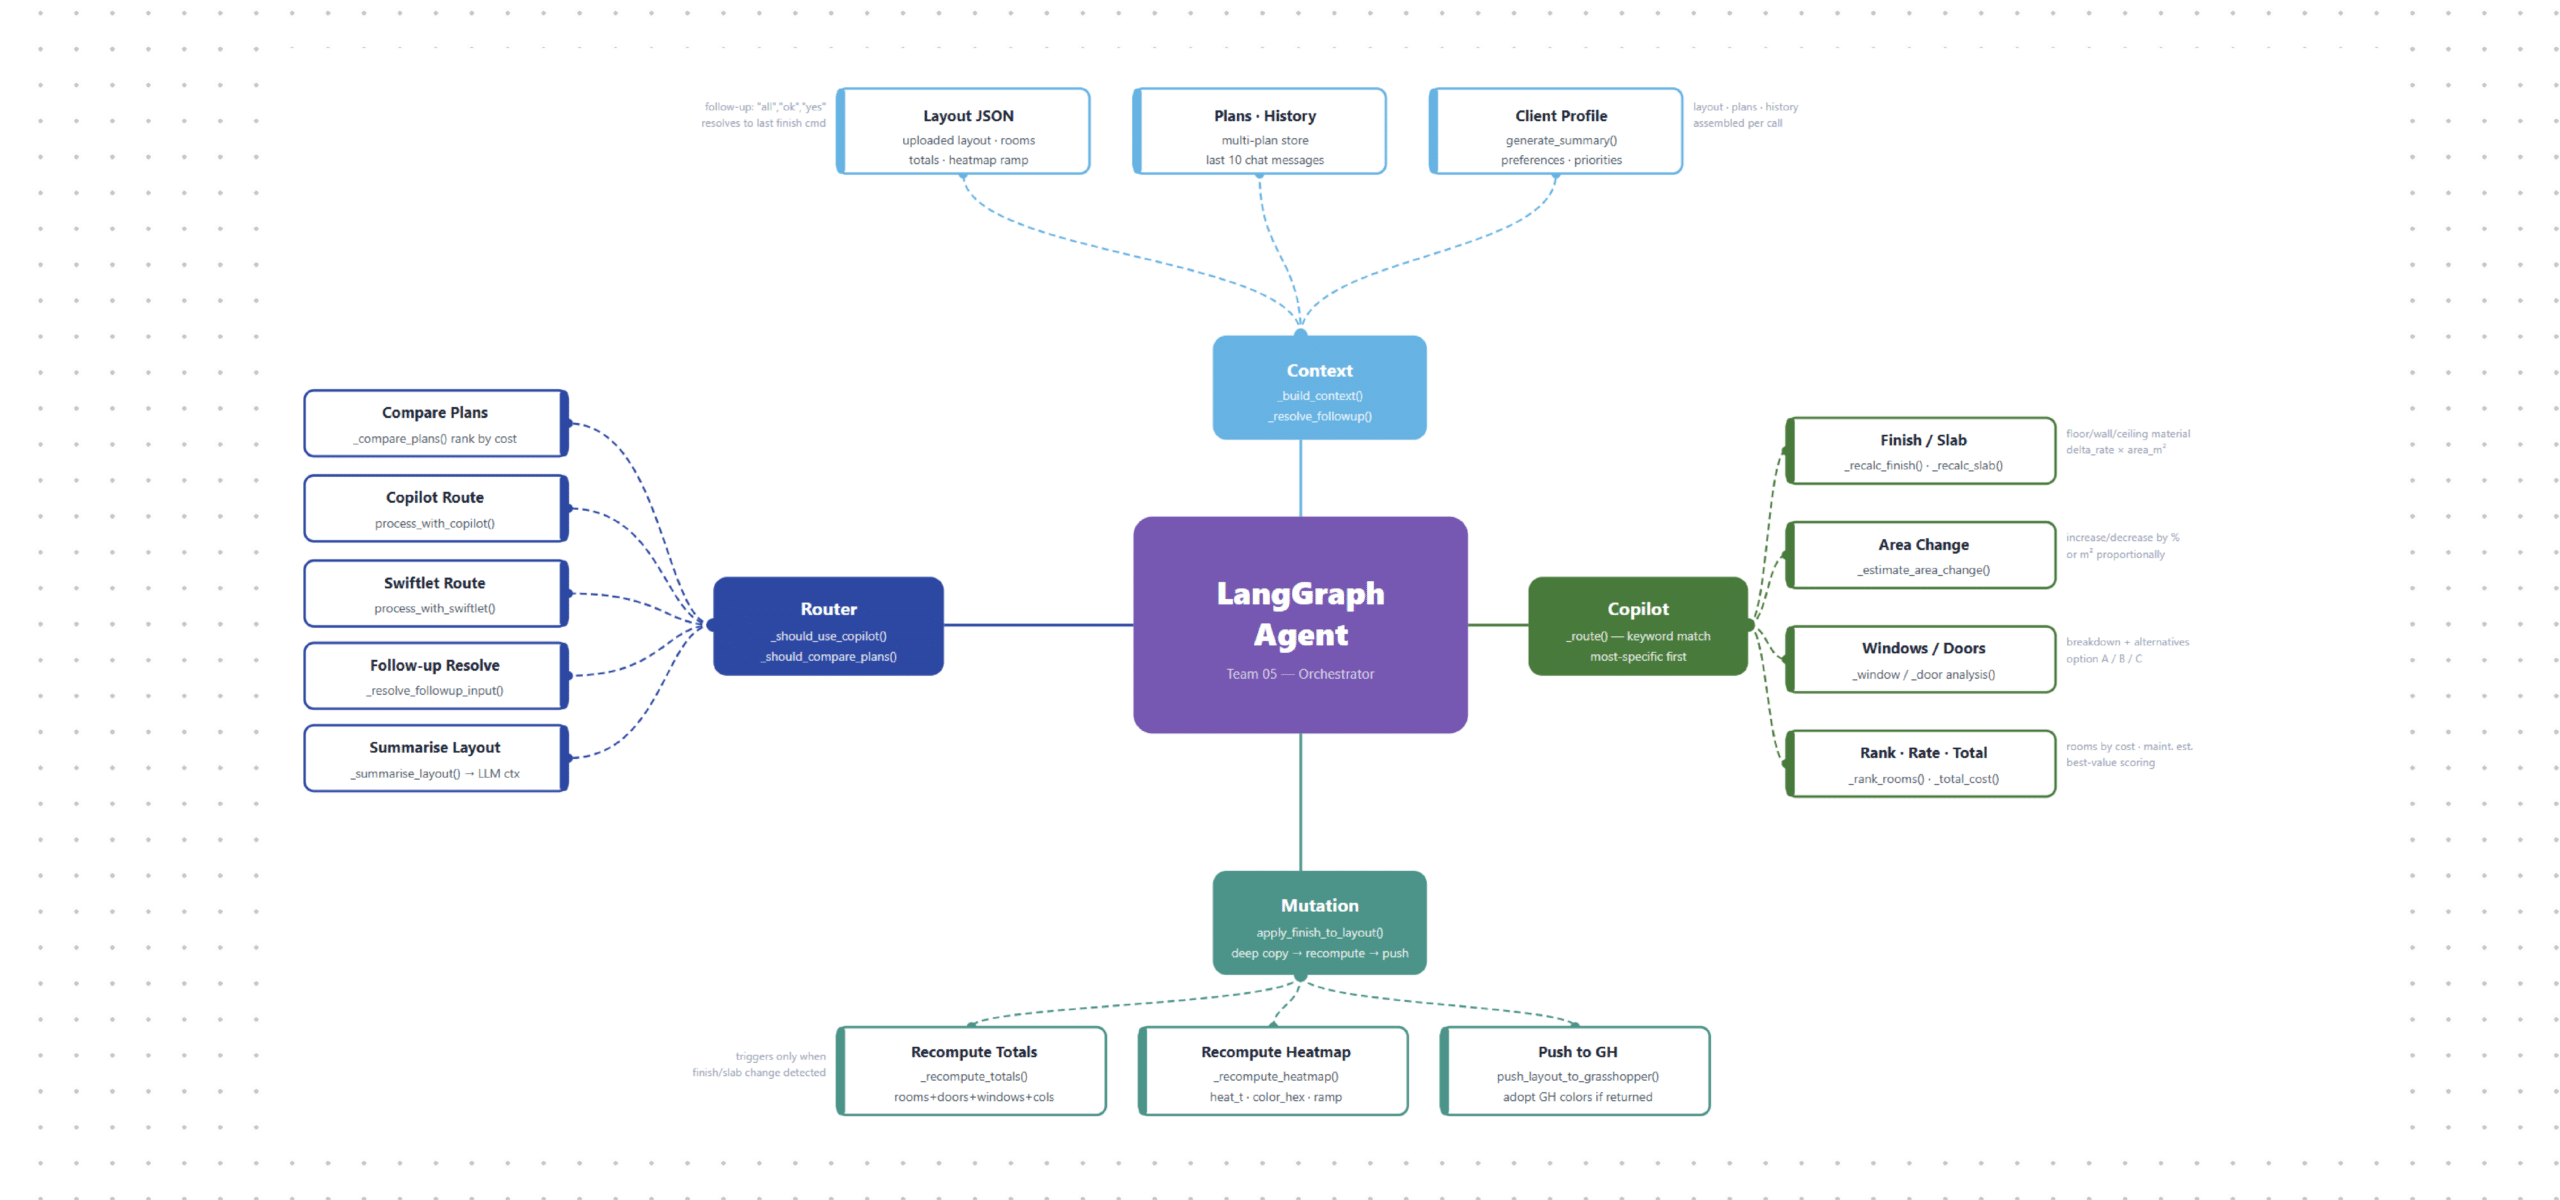
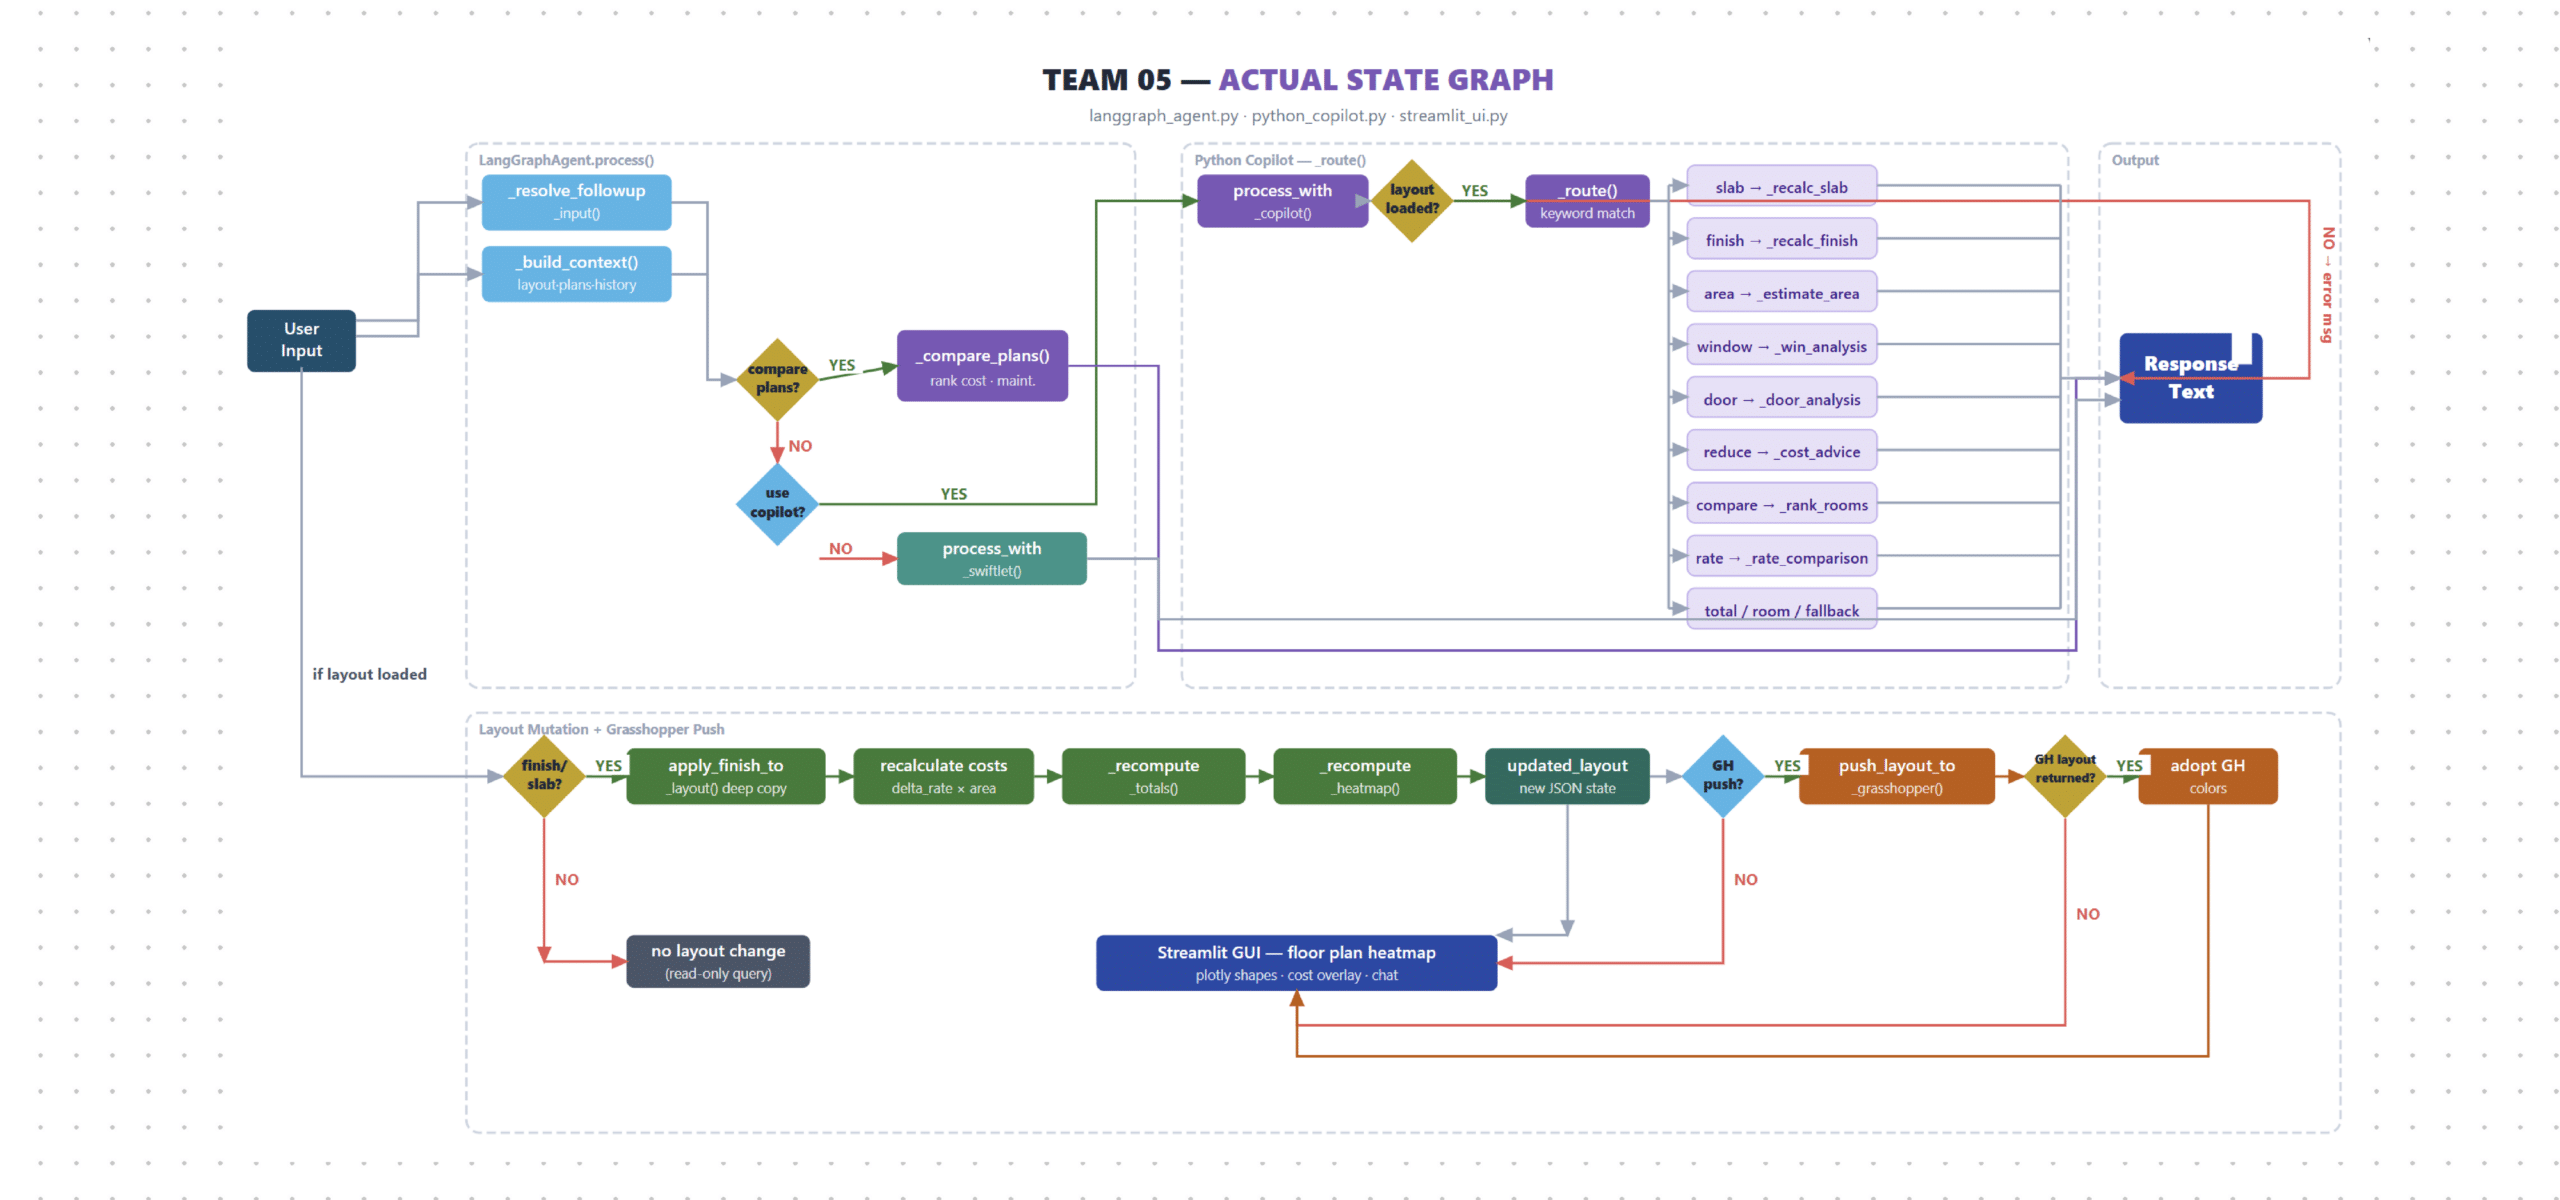
Actual State Graph
The real execution flow — user input resolves followup, checks compare/copilot/swiftlet routing, then either reads cost data or triggers a full layout mutation: recalculate totals, recompute heatmap, push to Grasshopper, and render the updated floor plan in Streamlit.
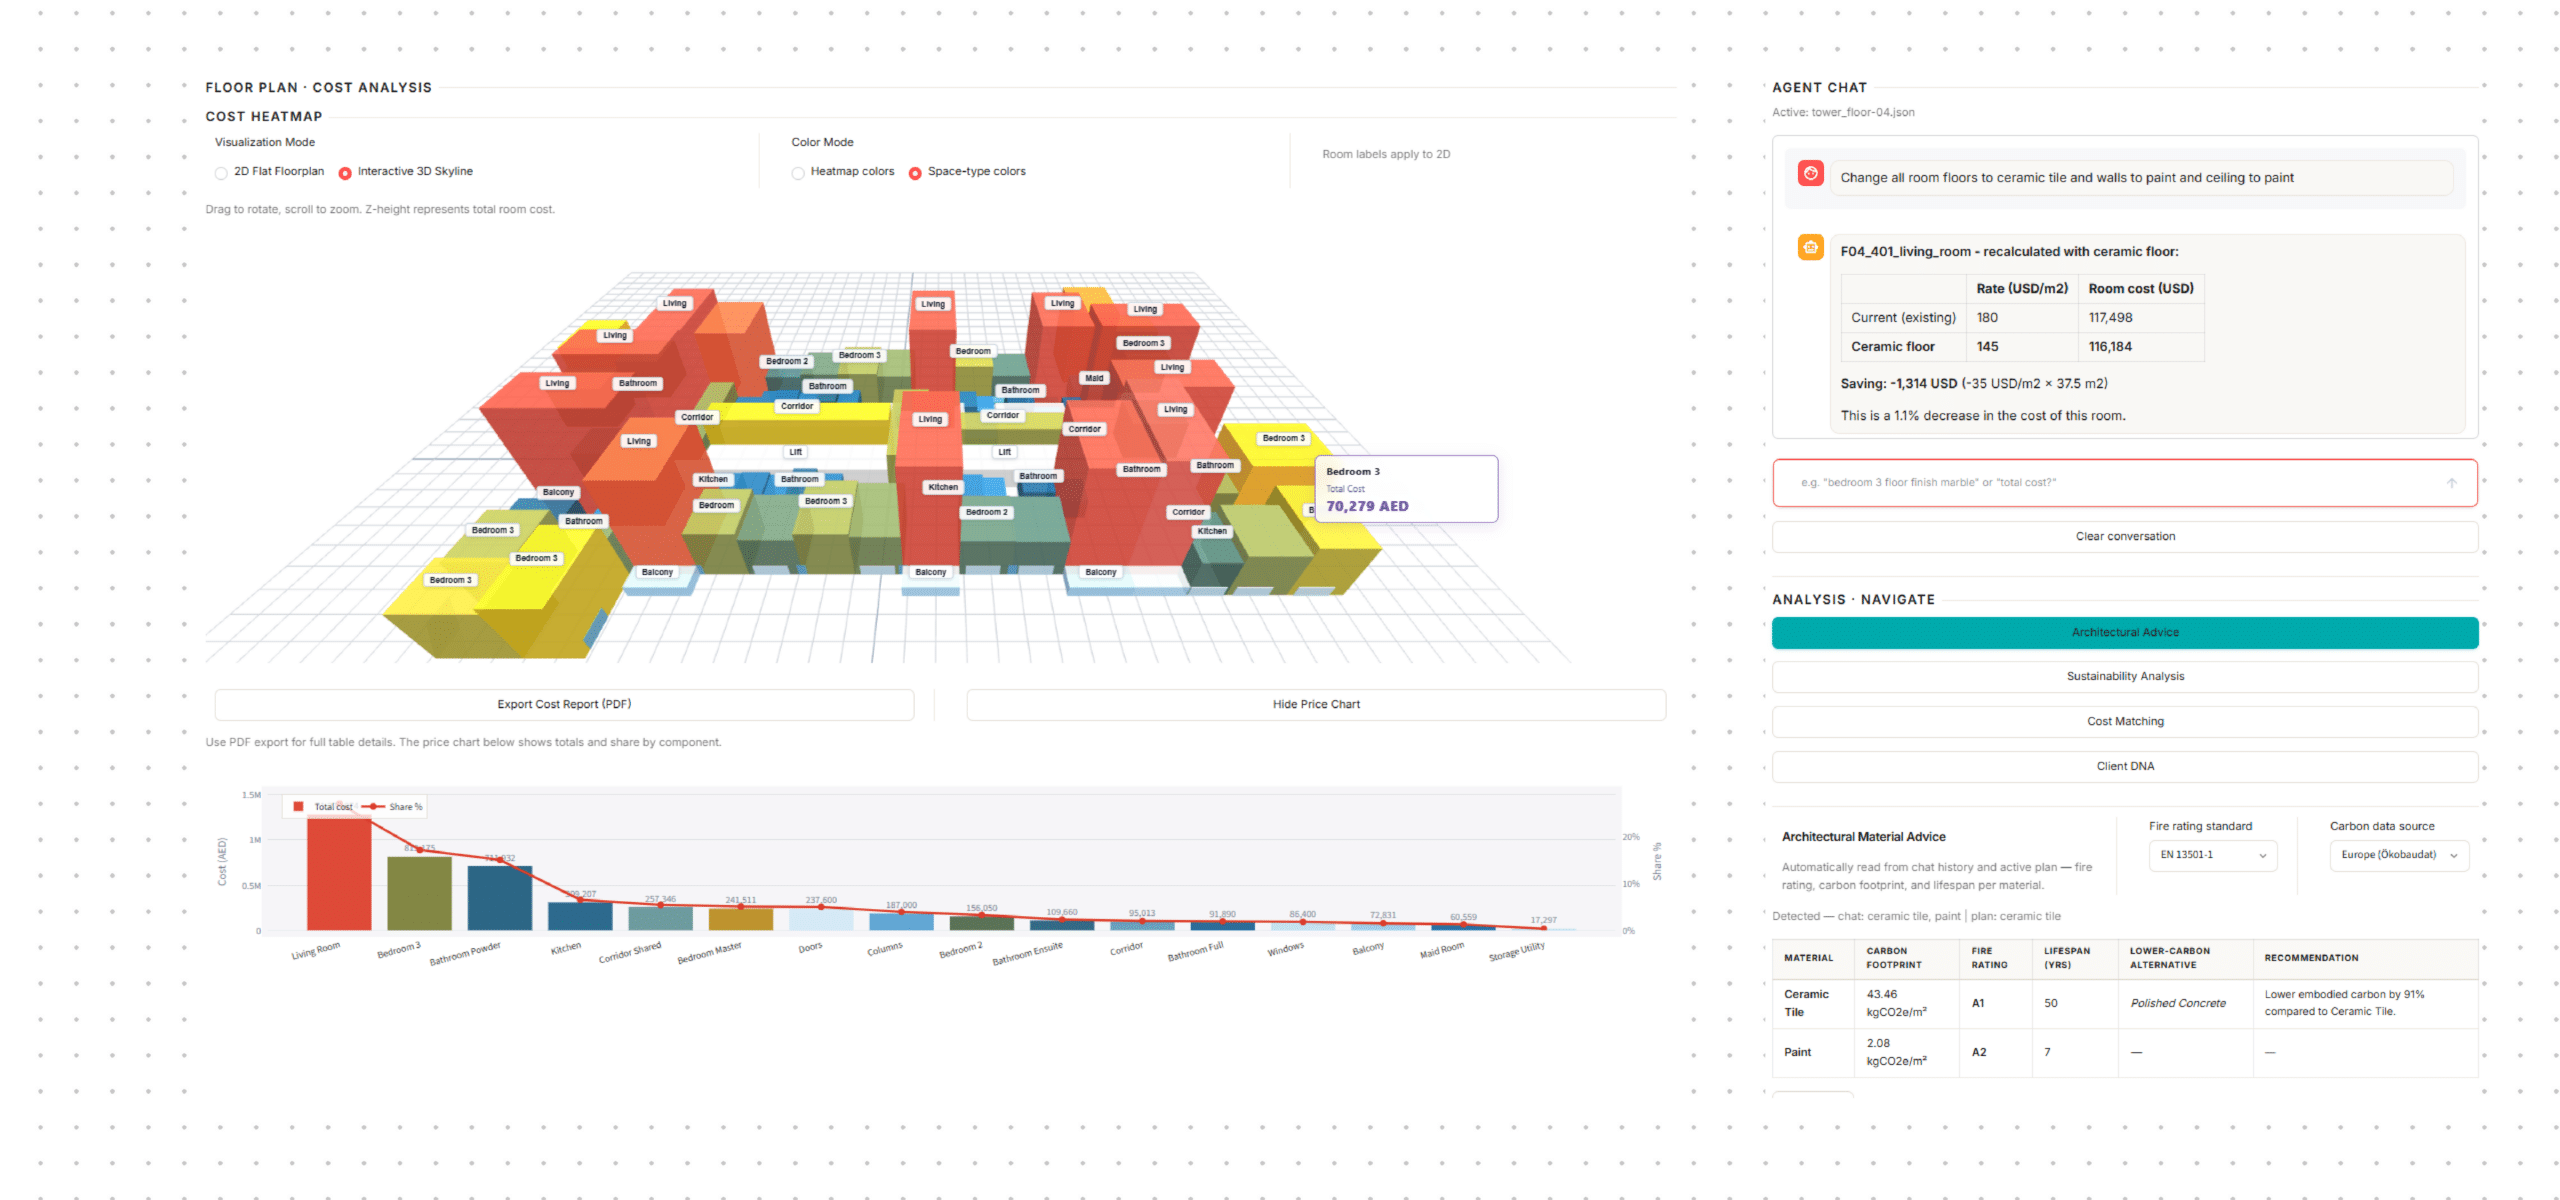
Agent Chat
Your AI cost advisor understands natural language — ask about room costs, request material upgrades, or compare floor plans without touching a single setting. The agent is connected live to your layout, so when you say “change all corridor floors to epoxy”, every affected room updates instantly. It remembers the full conversation context, so follow-up questions work just like talking to a cost consultant sitting beside you.
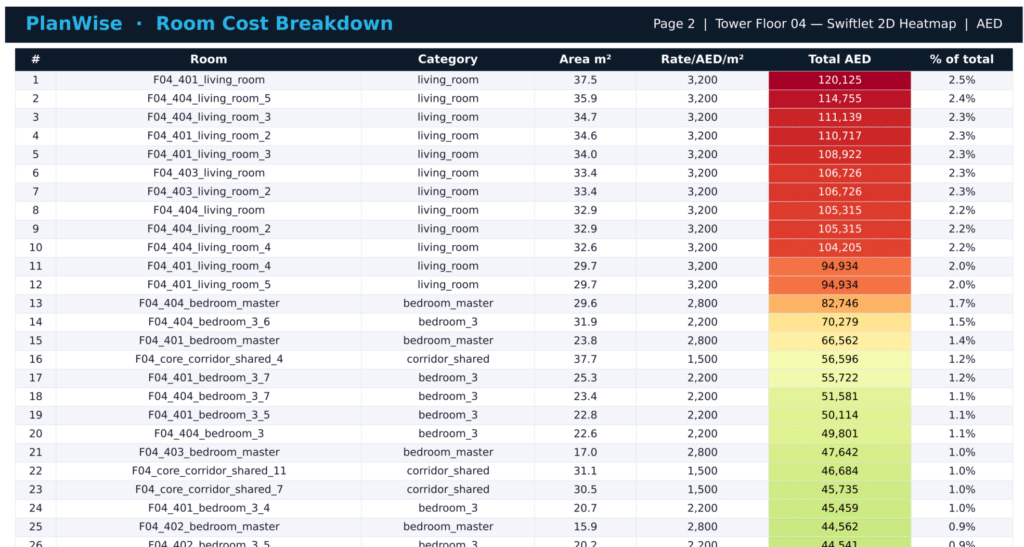
- 2D Radar Heatmap: Rooms are color-coded based on cost intensity. A glance tells you instantly if the dining room is consuming 30% of your budget.
- Interactive 3D Skyline: By toggling to 3D, the Z-height of each room extrudes based on its total cost. It creates a “financial skyline” of the building, making it incredibly intuitive to spot budget outliers.
prompt examples :
Change all balcony and terrace floors to natural stone and walls to glass cladding
Change all corridor, maid room, and staircase floors to marble and walls to stone cladding
Change all mep and shaft room floors to epoxy and walls to ceramic and ceiling to acoustic tile
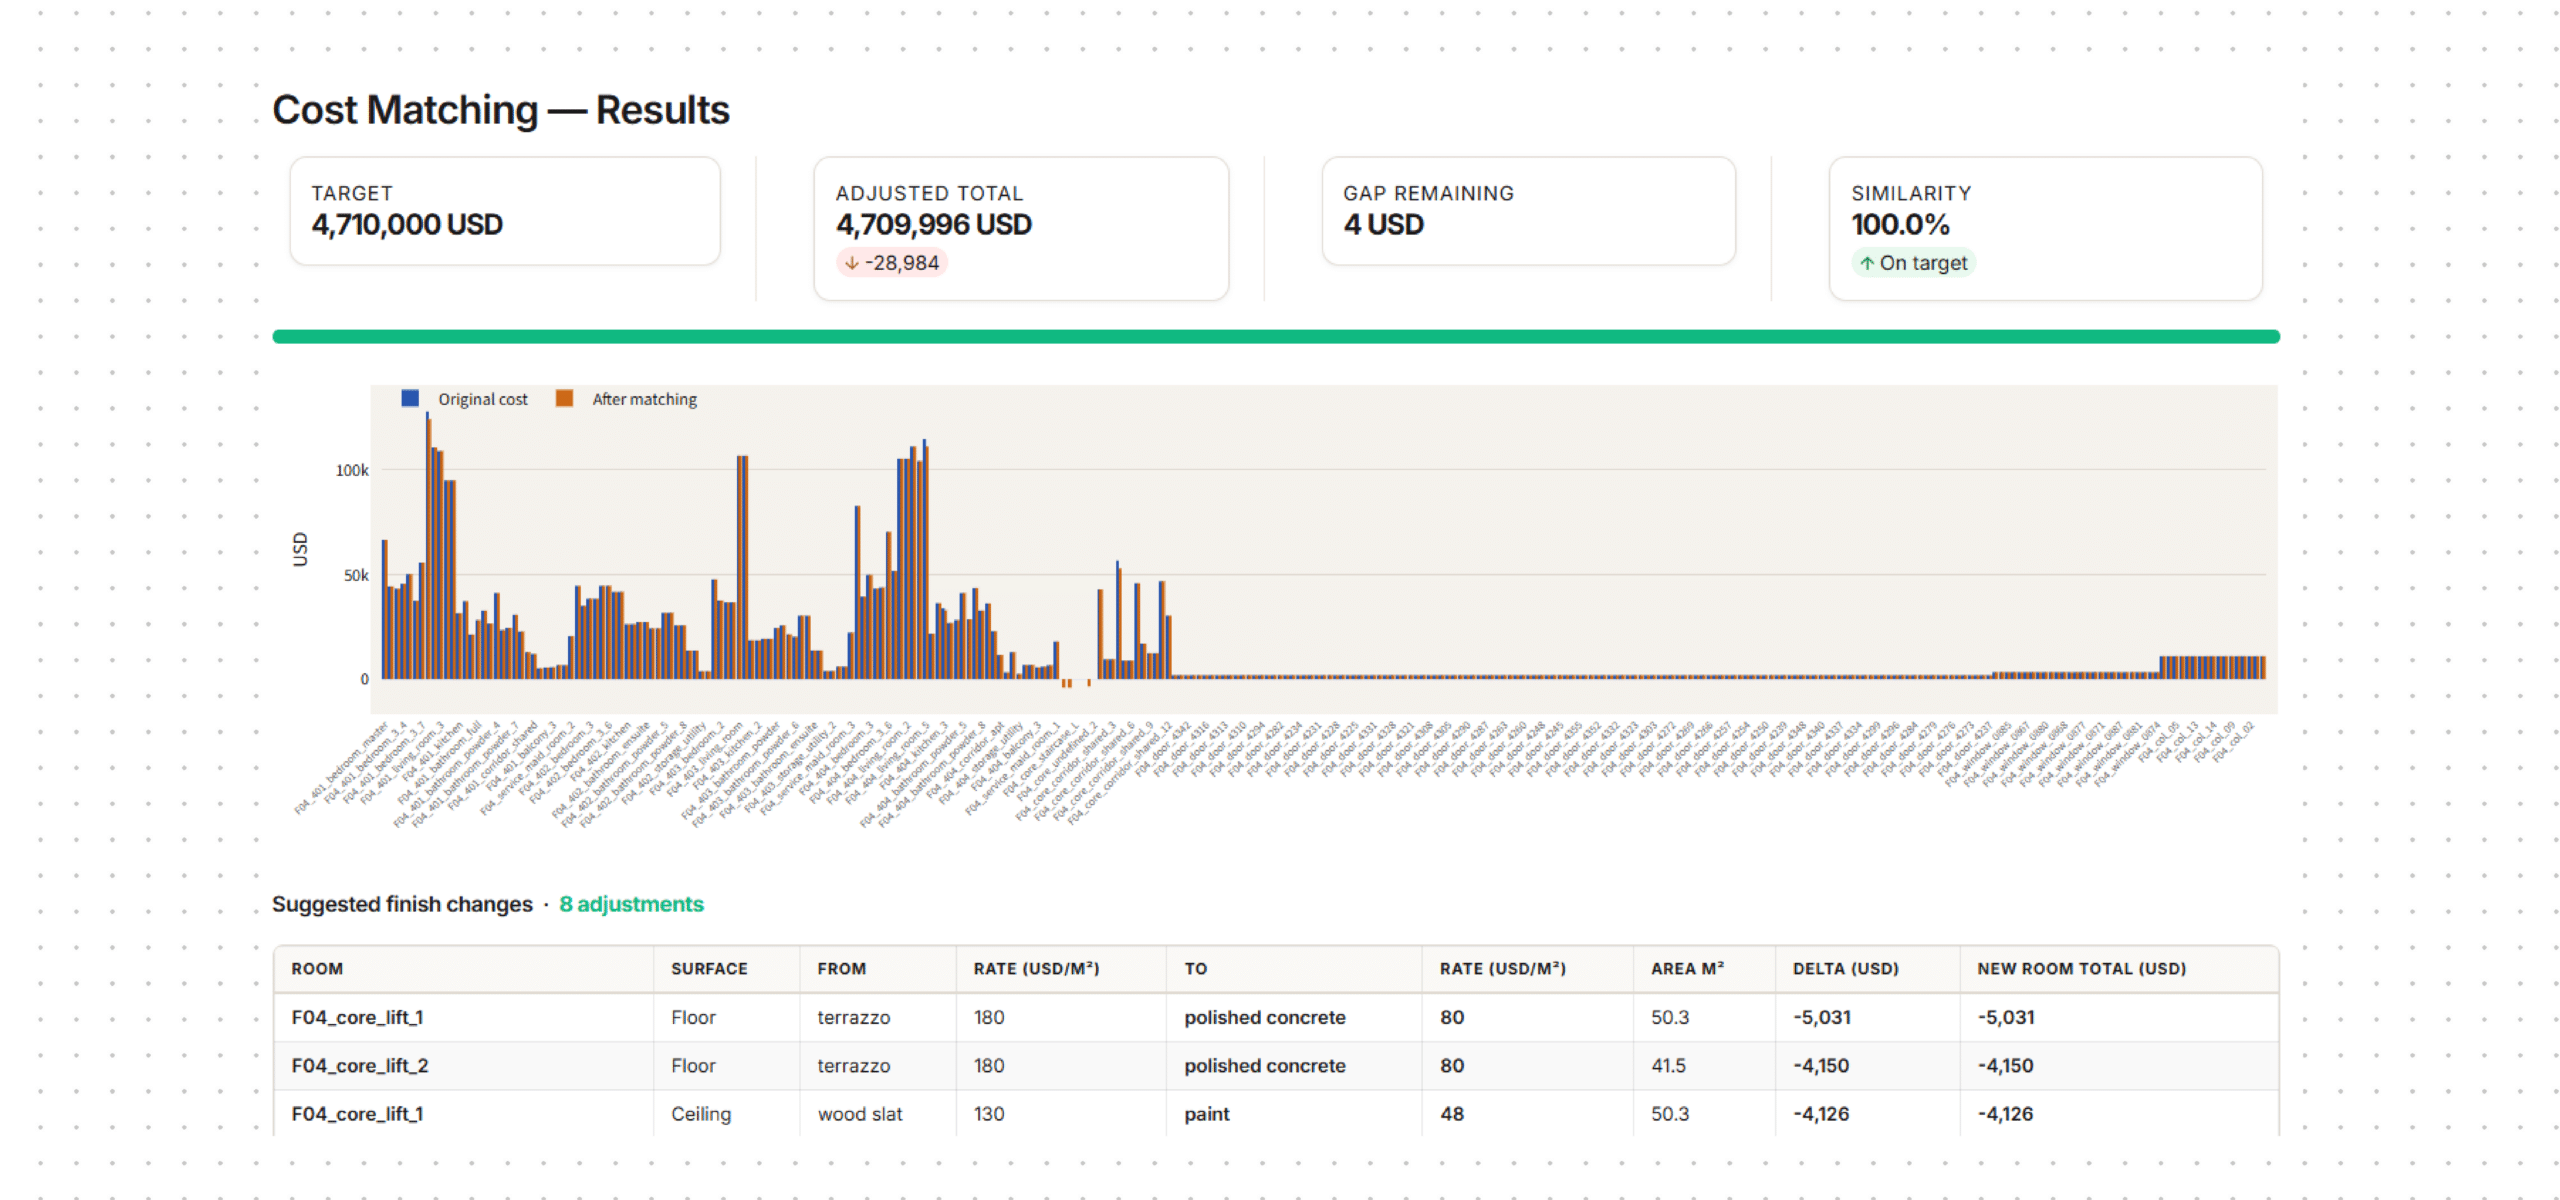
Cost matching
Cost Matching lets you enter a target budget and the AI automatically finds the cheapest material substitutions across every room — swapping expensive finishes like marble and granite for ceramic, vinyl, or paint — until the total hits your number. It returns an adjusted grand total, a gap remaining, a similarity score, and a room-by-room suggestion table showing exactly what to change and how much each swap saves. No geometry changes, no manual iteration — budget compliance in seconds.
cost comparison
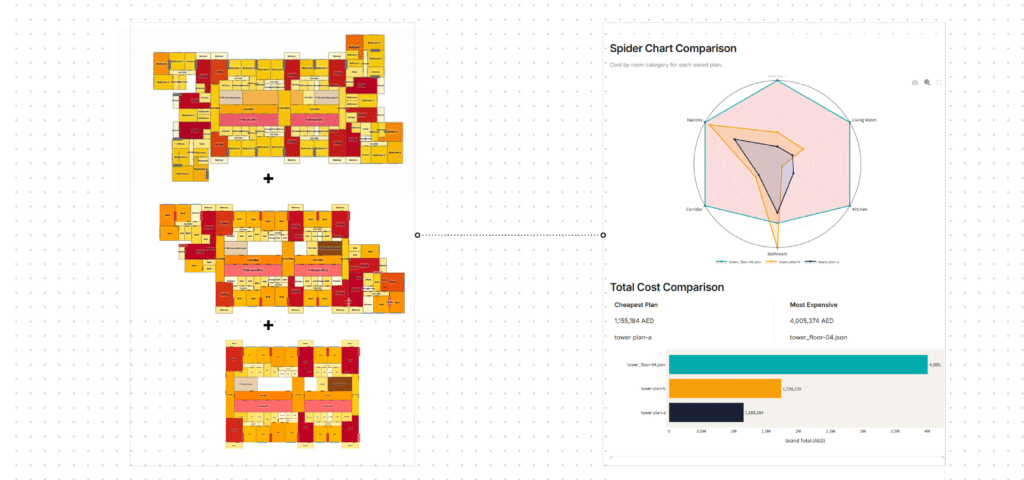
The Analysis Suite: Premium Intelligence
The right side of the dashboard is where the LLM engine truly shines, broken down into four distinct tools.
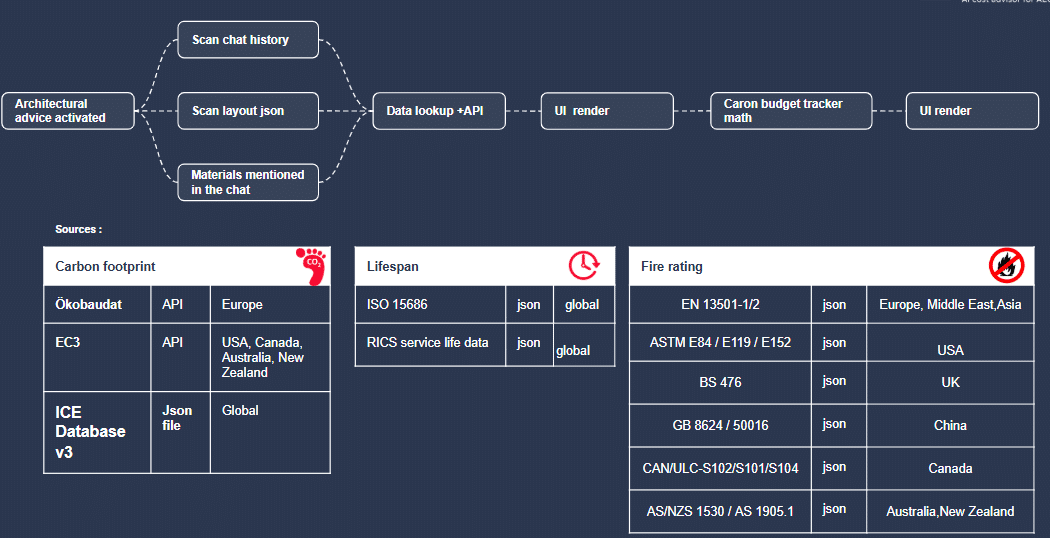
Architectural Advice & Sustainability
We recognize that cost isn’t just measured in dollars—it’s measured in carbon and lifespan of materials. PlanWise cross-references the materials in your layout against global databases:
- Carbon Footprint: Integrating with the Ökobaudat API, EC3, and ICE databases to calculate Global Warming Potential (GWP in kgCO2e/m²).
- Fire Rating: Checking materials against EN 13501-1, BS 476, and ASTM E84 standards.
- Lifespan: Pulling service life data from ISO 15686 and RICS.
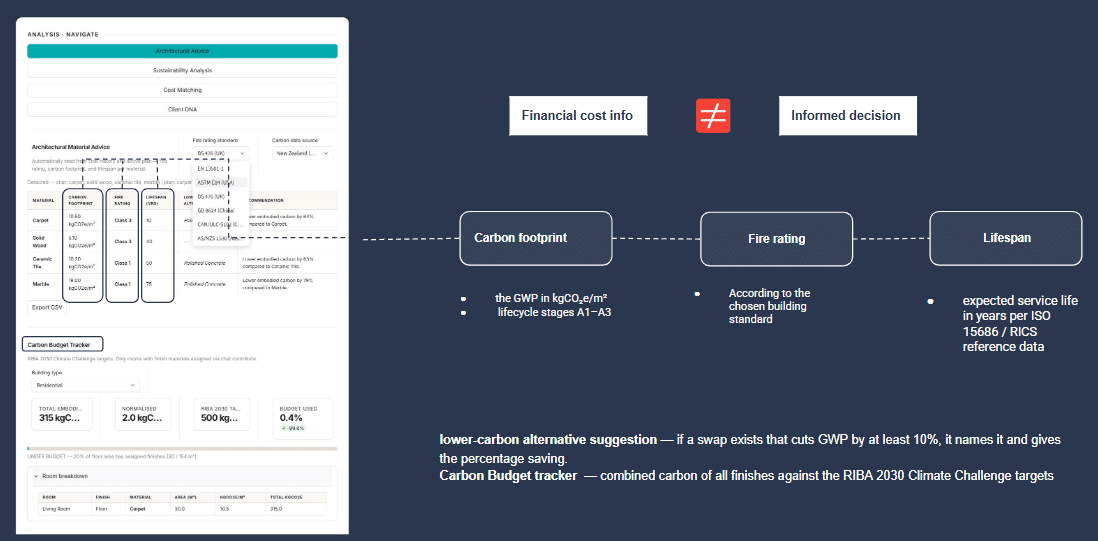
The system features a Carbon Budget Tracker aligned with the RIBA 2030 Climate Challenge targets. Furthermore, the AI actively scans your materials and suggests lower-carbon alternatives (e.g., swapping Ceramic Tile for Polished Concrete to achieve a 63% reduction in embodied carbon).
Cost Matching (Automated Value Engineering)
Traditional Value Engineering (VE) is a painful process of blindly slashing quality to hit a number. PlanWise automates this surgically.
If your current design is sitting at $514,125 but the client’s hard limit is $50,000, you simply type that target into the Cost Matching tab. The algorithm scans the highest-cost materials across all rooms and calculates the least disruptive substitutions required to hit the target. It generates a clear table showing: Which room to touch, the new suggested material, the new rate, and the exact dollar amount saved.
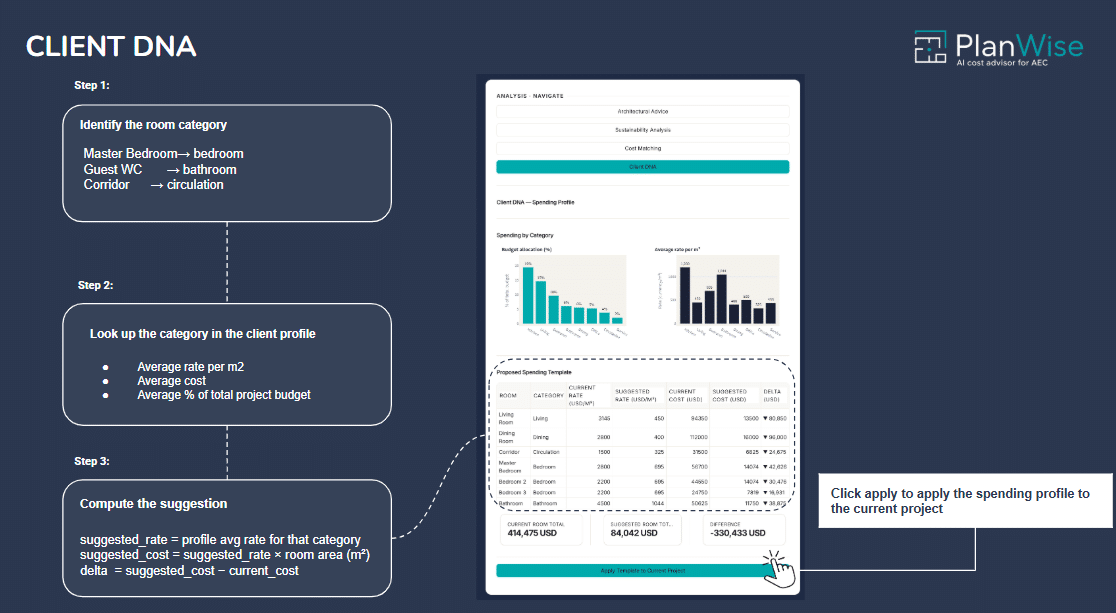
Client DNA
Every client spends money differently. A luxury hotel developer will allocate a massive percentage of their budget to bathrooms, while a commercial office developer focuses on communal lobbies.
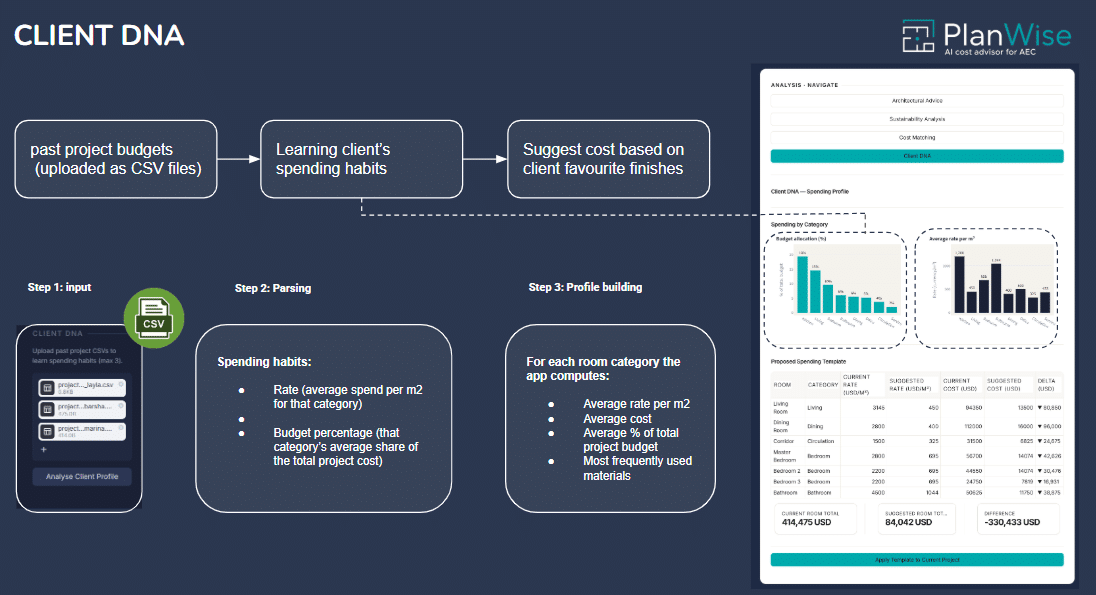
With Client DNA, users can upload CSVs of past projects. The system reads the historical data, calculates the average rate per m², and extracts the “Spending Habits” (budget allocation percentages) of that specific client. PlanWise then uses this profile to automatically apply suggested rates and templates to your current project, ensuring your new design aligns perfectly with their historical expectations.
The Copilot: Natural Language Overrides
At the heart of the center console is the Agent Chat. Powered by an LLM, it allows architects to query the spatial data and execute overrides using simple English, bypassing the need to navigate complex drop-down menus.
Examples of PlanWise in Action:
User: In my layout how much would the external wall cost me if I build it from brick instead of concrete?
PlanWise: Based on your floor plan I’ve measured the external wall perimeter at 38 linear metres, giving a total net area of 96 m². Concrete block (current): €16,320. Facing brick (proposed): €22,080. Brick adds €5,760 to your wall cost. That’s +35% on this element.
User: What would I save if I replaced the wet room with a standard bathroom?
PlanWise: Current wet room: €12,140. Standard bathroom: €4,760. Estimated saving: €7,380 (−60%).
Overall
PlanWise is not just a calculator; it is an active participant in the design process. By linking spatial geometry directly to financial databases, environmental metrics, and large language models, we are moving away from reactive cost estimation and toward proactive, data-driven design.
With PlanWise, architects can protect their design intent, clients gain absolute transparency, and the AEC industry takes a massive step toward financially and environmentally sustainable building practices.
