
Intro
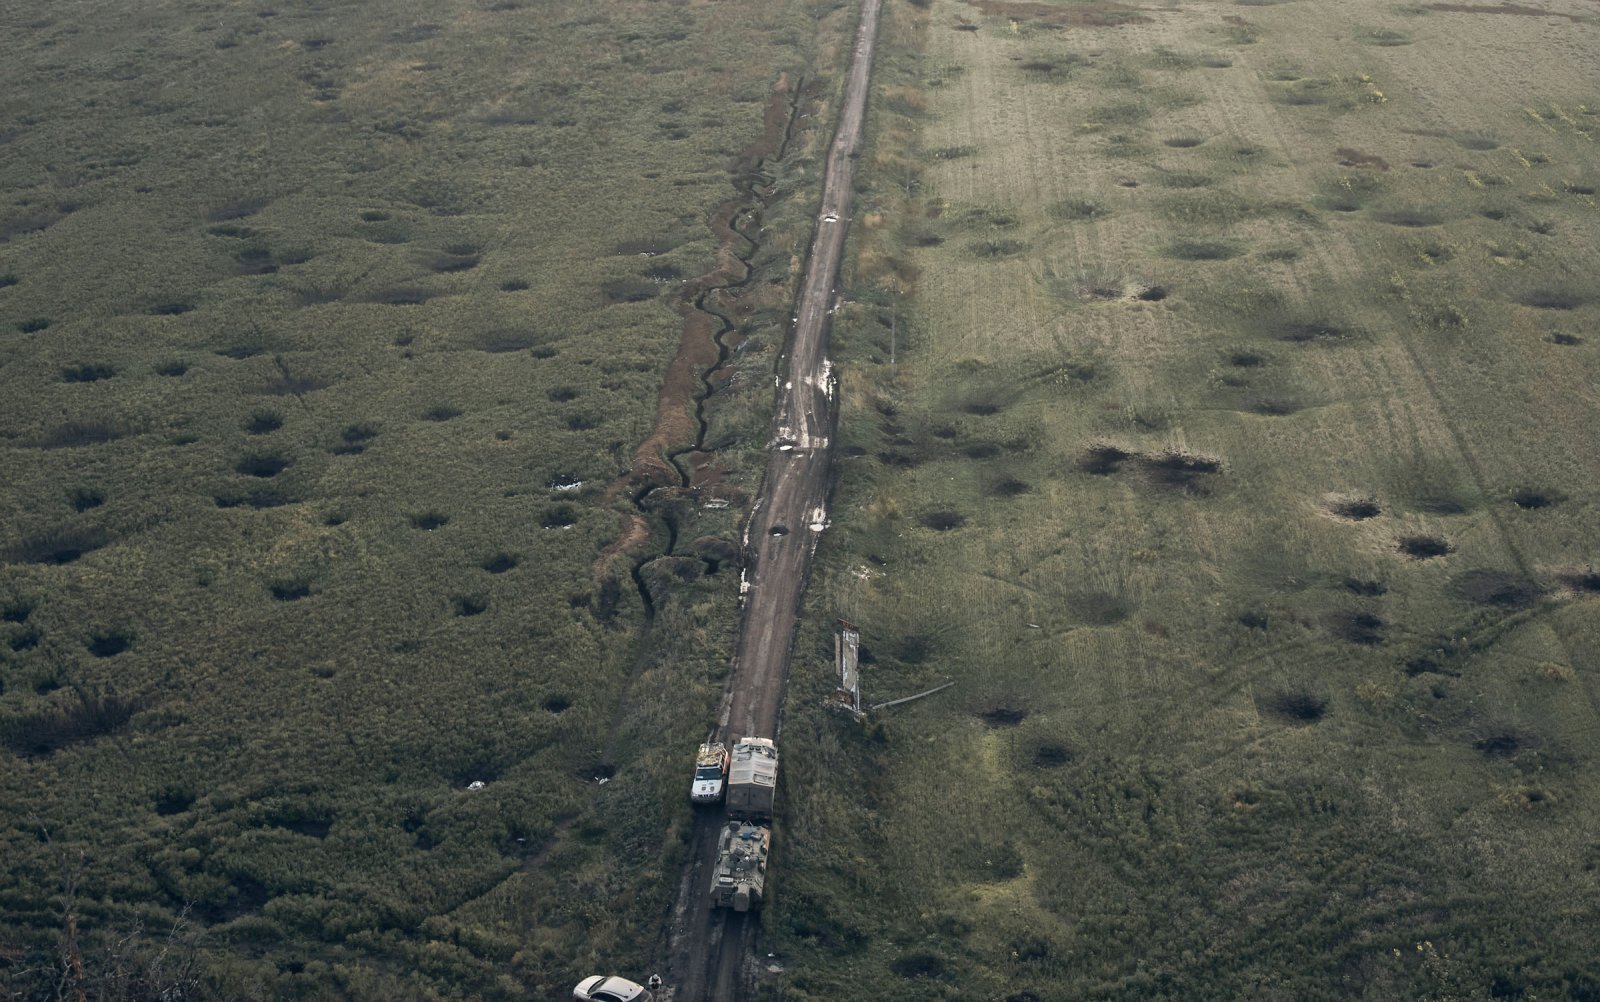
Russian full-scale invasion of Ukraine, which started on 24.02.2022, is the biggest war in Europe since WWII. It took the lives of dozens of thousands of Ukrainians and brought massive destruction [1] and ecological catastrophes. Some cities are completely erased. A massive piece of land is still occupied. This war and its consequences are not comparable to any other war or conflict zone that happened before. The reconstruction process which will start in full scale after the complete deoccupation, will be one of the biggest and longest-lasting developments in Europe. In today’s world, there is a big awareness of the clever use of materials, implementing such approaches as reuse, recycling, and upcycling. A lot of buildings in Ukraine currently represent a huge amount of either waste or potential material for reconstruction and reuse. The very first step towards the circularity in construction and reuse is gathering the data, it is important to estimate the volume of material that has to be processed. In the general experience, there is a common method of assessing the damages of catastrophes such as climate crises or wars. Usually, it is done through satellite imagery, which helps to map damaged, destroyed, or undamaged buildings. Yet this information lacks precision on the type of building, materiality, volume, and level of damage. Because of the development of technologies and access to the internet, this war is highly documented. The question this paper is dealing with is – can we use ground imagery to estimate the loss of material and needs for the reconstruction process while using open-source data and images taken by the witnesses of the war? Many of them are still on the occupied territory.
Purpose of research
The objective of this research paper is to study the workflow of performing the remote damage assessment of war-related damages in Ukraine. This assessment should provide an estimation of building material material loss, caused by war actions in Ukrainian cities. It is planned to use gathered data in a future reconstruction process when implementing circular economy principles. This research should show how to take the first steps toward the circular reconstruction process. As well as to get a more precise understanding of the ecological damage caused to Ukraine. For methodology, it was chosen to ground images for a more precise understanding of damage, compared to satellite assessment. For image processing, it is chosen to use image classification models. The model will classify the level of damage as well as the type of the building so that a certain level of damage can be assigned to real building dimensions and materials. As an assistance in calculating the volume, building footprints will be retrieved from Open Street Maps. Having the data of the volume of affected material, it will be multiplied by CO2 values related to those materials, to calculate the overall CO2 footprint left for a certain city by damaging or destroying the buildings.
Datasets

The first step was to find a dataset with images, which can later be trained for damage and building type detection. After a while of research, a surprising source of information was found. It was a Google My Maps, a custom map created in Google Maps by the user. On 11.04.22 he started to collect and geolocate images of war crimes, graves, battles, and damages in Mariupol, currently, the map has around 2000 geolocated images. A single pin on the map has usually several photos, videos, and detailed descriptions of the people in the Mariupol. We decided to take this as a base, as there was a waste amount of images, and more importantly, they were geolocated, meaning there is a possibility to connect detected damages with the true dimensions of the building, to estimate the loss of materials, they must be recovered.
The first issue that we encountered was how to download automatically images from Google My Map. We exported the KML file from this custom map and imported it in ArcGIS, where we could visualize it on the map as well as in a table. Each row consisted of IDs, addresses, and links to the image, which is stored on Google servers. We exported this table, cleared it, leaving only the rows from the links column, and exported it as CSV. Following by using Python libraries like BeautifulSoup and PIL we cleaned the links and downloaded images to the local computer. In the downloading process, it was important to keep the logic data structure, so that the images can be associated back to their coordinates in the table from the KML file. So every image was named «image_row number_image number». For example, image_5_7 stands for the 7th image from the 5th unique location. After 2 hours of downloading we obtained a total of 6201 images for 2473 unique locations in Mariupol.

Damage detection modell
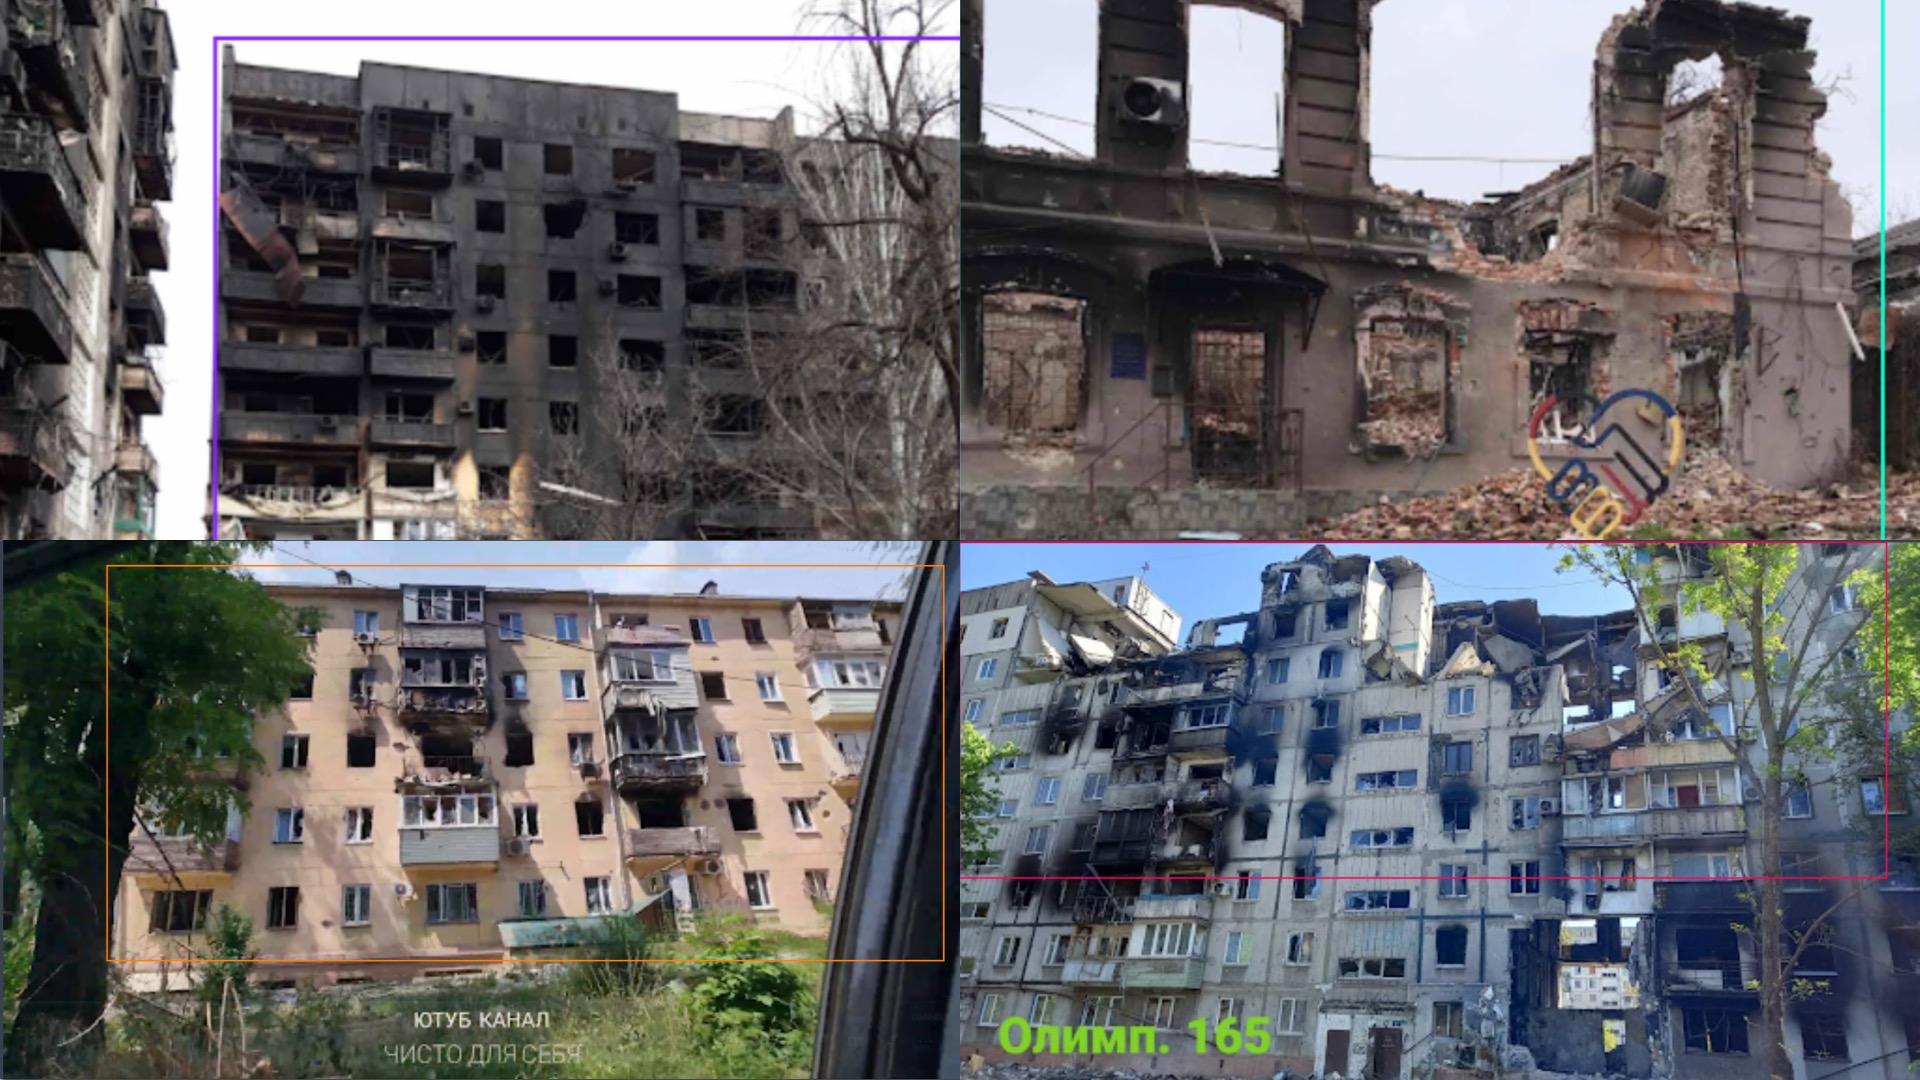
We started with the damage detection model. Our choice was to work with YOLOV8. As an image labelling and managing platform we chose Roboflow. We picked 1335 images to upload and annotate. As a basis for creating damage classes, we took Building damage classification based on EMS 98 [11], which consists of 5 classes, starting with slight nonstructural damages and up to the full collapse. We adopted those to suit better the reality in Ukraine based on the images we saw. We distinguished 4 classes for labeling. It is also important to keep in mind the cause of building damages, most common during this war are artillery shells, missiles, tank shelling, or aerial bombs. Class 1- slight damages to the facade or small local fires on several flats. Class 2 – severe damages to the facade, but still no visible structural damages. Class 3 – partial structural damages, collapse of several floors but not more the 30-40 % of the overall building. Class 4 – Structural damage or collapse of 50% or more of the building. From the experience of the last 1.5 years of the war in Ukraine, buildings damaged by more than 50% are usually demolished, because of the lack of structural integrity of the prefab buildings from the USSR, which doesn’t have a lot of potential for renovation. So class 4 buildings will be considered as loss of materiality by 100%. After annotating and balancing the dataset we got to class 1 with 372 images, class 2 with 339 images, class 3 with 319 images, and class 4 with 306. Also important to mention that all images were taken by the residents, or cut out from documentary footage from Ukrainian forces or russian occupants.
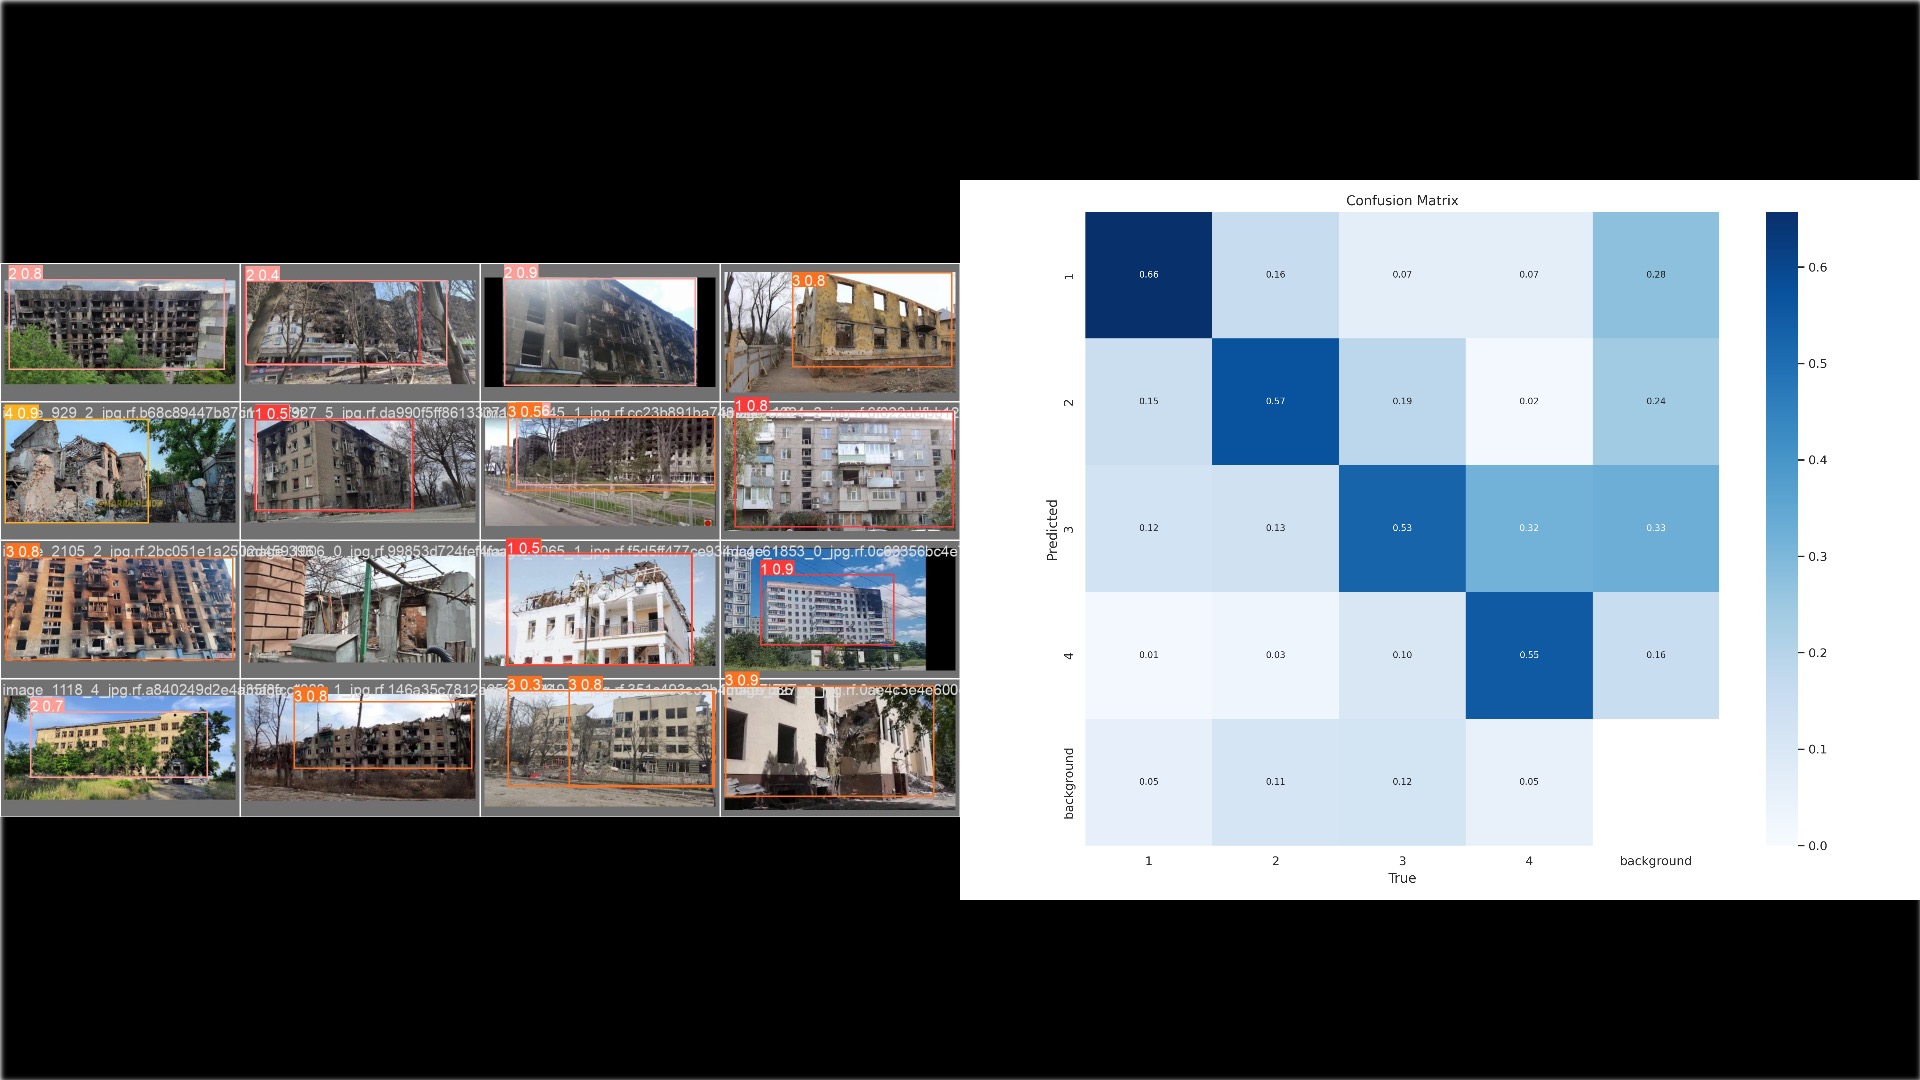
They all had very different quality, resolution, and distance to the object itself. Some of the images were represented as aerial drone footage, which can also allow to use of a trained model on drone footage for damage assessment. The average image resolution was 480×437 pixels. We also applied data augmentation on a data set, which increased it to 3173 images. Through different iterations, the best results were achieved by applying data augmentation on the bounding box only. We used «bounding box: Flip: Horizontal», and «bounding box: Blur: Up to 2.5px.» ‚ «Bounding Box: Noise: Up to 5% of pixels». The data split was as follows: Train set 2775 images, Valid set 265 images, and Test set 133 images. The model was trained with 50 epochs and showed good results on the confusion matrix, and took only 0.324 hours. Model results: mAp 58.4%, Precision 64.1%, Recall 52.5%. A test inference was also performed through the interface of the Roboflow website, new images were recognized correctly with a good confidence and correct bounding box.
Building Type Detection
The next step was to create a model for building type detection. The city of Mariupol was founded in the 16th century, so it has very varied architecture. We concentrated more on classifying housing buildings, their height, and materiality. The workflow was to start with a similar dataset of images as for the damage detection model, and then balance the dataset by adding new images from the internet of the same building types.
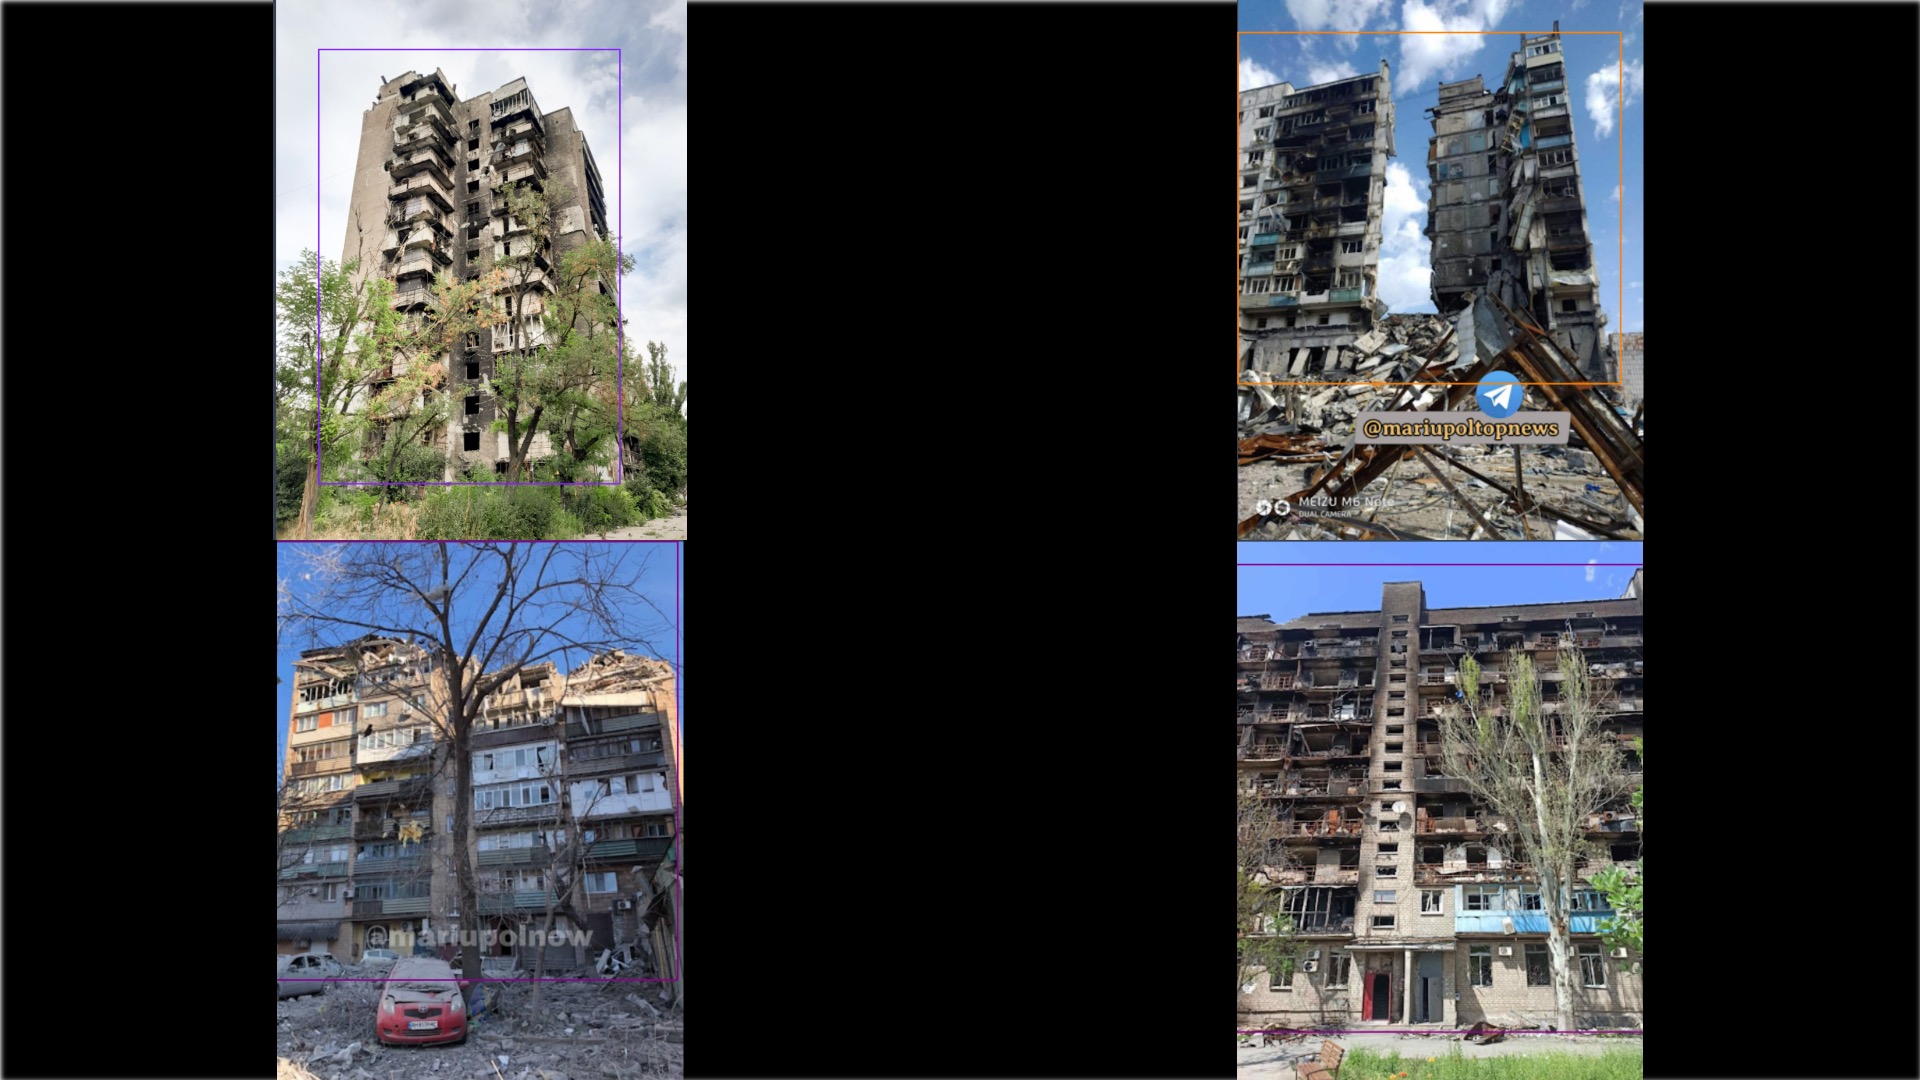
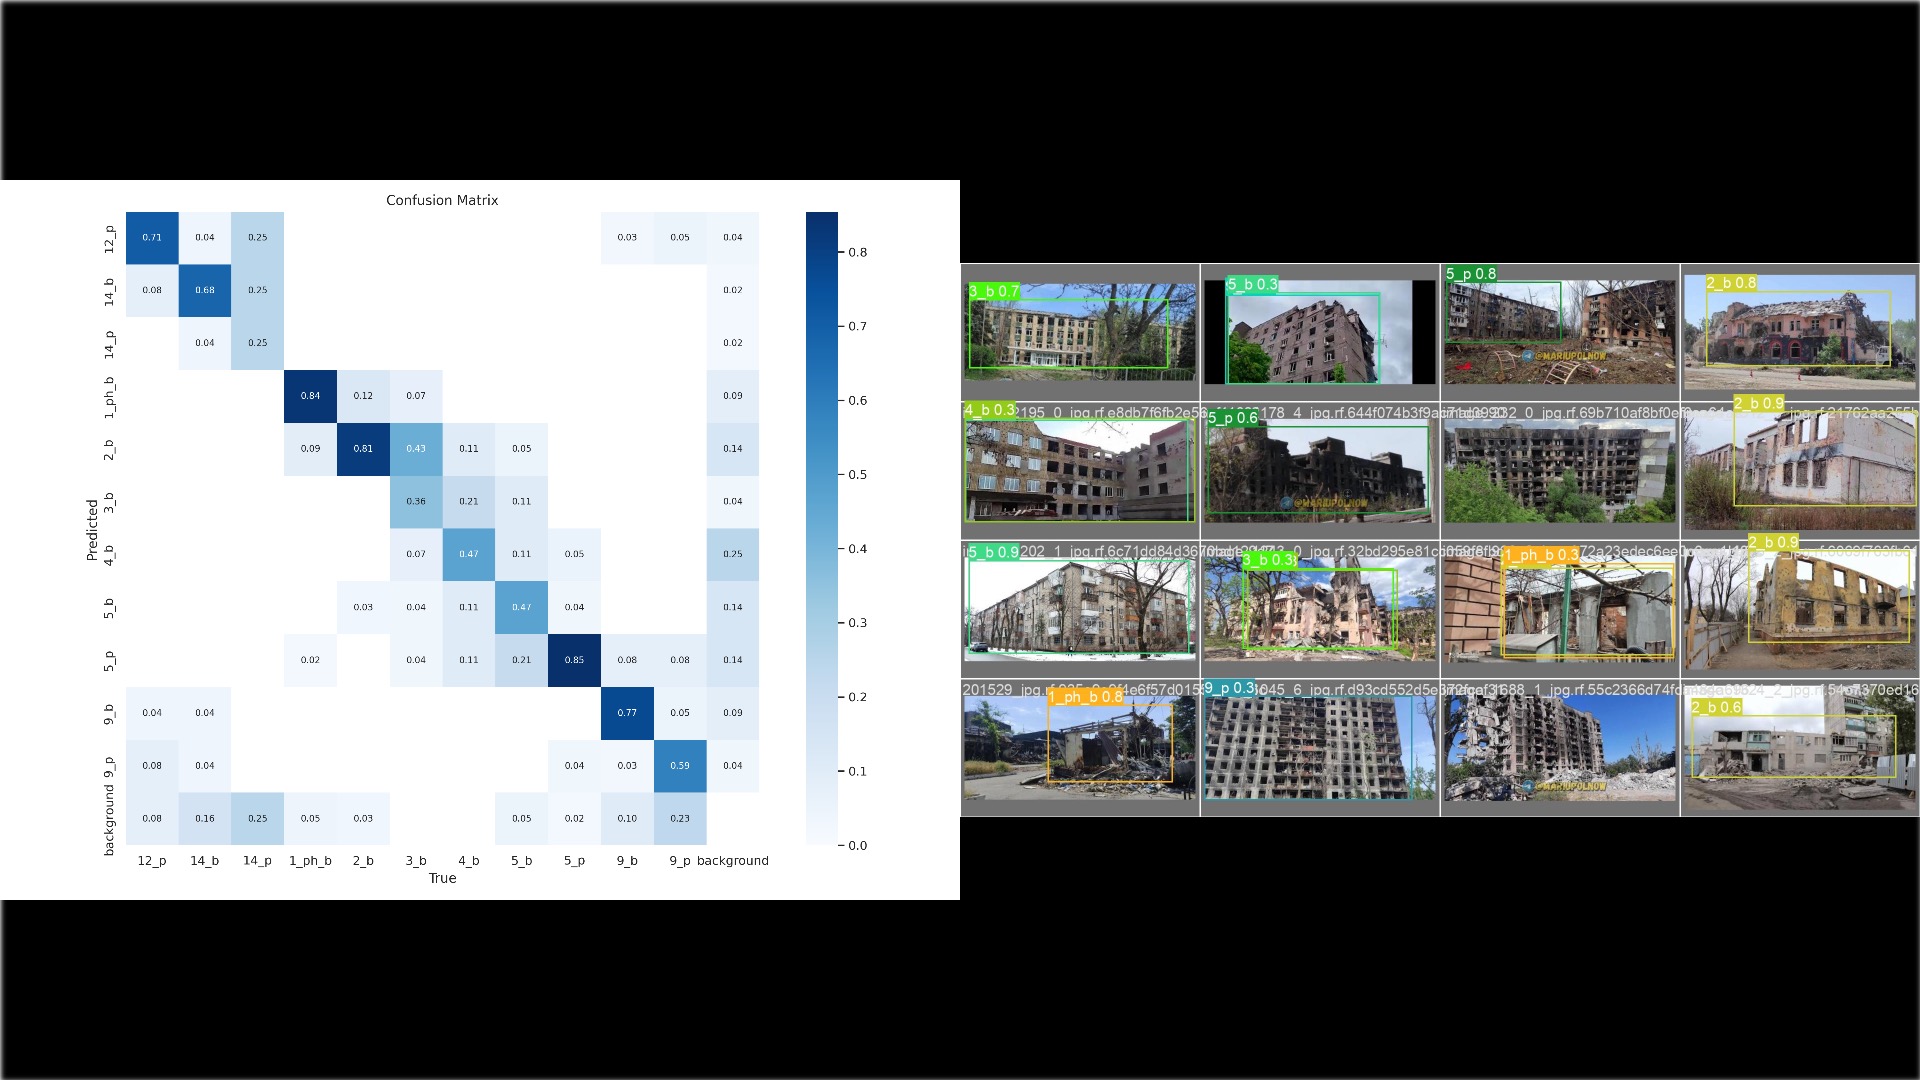
Through the labeling process buildings were split into the 11 most common classes that were found across the dataset. The Classe were 1_ph_b, 2_b, 3_b, 4_b, 5_b, 5_p, 9_b, 9_p, 12_p, 14_b, 14_p. The first number represents several floors, and the letter represents materiality. For example «2_b» represents a 2-story brick building, while «9_p» stands for 9 9-store typical prefab panel building from the USSR period. It was important to train the model on the images of damaged or destroyed buildings for type prediction so that the model can predict a building type when parts of it are missing. The overall image count in the labeled dataset was 1670 images. The underrepresented classes were enriched with images of those types of buildings from Internet sources . Because the same building series were used across different countries that were part of the USSR, we had no problem finding enough buildings of specific types. The images themselves had similar characteristics as in the «damage» dataset, they had different resolutions, angles, and distances to the objects, and they varied from amateur photos to professional photos without distortion.
The average image size was 512×512 pixels. The dataset was later augmented to the count of 3652 images. For data augmentation, we used similar techniques as for the «damage» dataset. Bounding Box: Crop: 0% Minimum Zoom, 20% Maximum Zoom. Bounding Box: Shear: ±15° Horizontal, ±15° Vertical. Bounding Box: Noise: Up to 5% of pixels. The dataset was split into 3652 training images, 375 validation images, and 182 test images. The model was trained with 50 epochs and took 0.477. The model showed good results on a confusion matrix (Fig. 12) with some minor confusion in the class that had similar floor numbers like 4_b and 3_b, but this won’t affect our research strongly as we take a big grade of abstraction in this study. The model’s MAp was 68.0%, the recall was 61.9%, and precision was 63.6%.
The following step in the research process was to perform inference of both models on our original collection of images, downloaded from Google MyMaps. As both of the trained models are stored at the Roboflow website, with could pick a specific piece of code, to run inference on the image dataset in a Python environment in Google Colab [13]. The results of the detection were to be stored in a CSV with image names, detection class, and confidence. As some images in the collection weren’t the builds, but some screenshots with messages from Telegram, the rule was set to leave blank rows in case nothing is detected. The inference of both models took around 1 hour. The CSV table had several rows corresponding to the number of images in our collection, but we needed only one detection per unique location. So we sorted the table to leave the detection with the highest confidence only. Then we merged two tables into one, to have image names, both prediction of damage and type, and corresponding confidence.
Building plans and footprints
To calculate the CO2 footprint of the lost materials from the buildings, we first have to receive a volume of the materials. For this research, it was considered to practice the process only on two materials – bricks and reinforced concrete in prefab panels. The decision to detect building classes was made because of the possibility of obtaining detailed plans of those typical buildings, for further calculation. We started by downloading plans of the buildings from a website called «my-realty», which stores descriptions and building plans for the Soviet-era housing project. The description also included the thickness of walls and slabs, as well as materiality. After collecting PNG images of the plans we started to digitalise them in the CAD software ArchiCAD. By redrawing plans we calculated the area of floor and walls volume, subtracting windows. The wall volume was calculated by multiplying the wall area with the stated floor height, and then the window opening was subtracted. We used typical windows openings in such projects of 138x142cm as an average size for all building types. Typical building projects in the USSR had the same buildings parts, enclosed by a staircase, replicated next to each other. So one building could consist of 1,2,3 or more sections of a certain type. So we decided to calculate a ratio of floor area to walls volume for each building type so that we can use this factor on the footprint areas that we received earlier. Following we took floor area, multiplied by slab thickness and number of floors. Combining those calculations we received a volume of walls and slabs of certain materiality for each location, only knowing the detected building type and footprint area. We will provide here a calculation for one building type as an example. Let’s look at the building type detected as «9_p» (Fig 13). This class is associated with a series 1-464A-51 from project 1-464. This is a 9-store prefab panels housing, built between 1967 and till end of 80th. It has 0,35m thick outer walls and 0,1m thick slabs constructed from reinforced concrete panels. Ceiling height 2,50m. The project usually consisted of 4 sections. Analyzing one section has 275 sim area, and the volume of walls is 116,25 cubic meters. Which gives us a floor area to walls volume ratio of 0,42. Such calculations were performed for all plans of building projects, associated with certain classes.

The table of our detection is now enriched by 3 columns: walls brick, walls panel, slab panel. The formula for walls is – footprint area x 0,42 x number of floors. The formula for slabs is – footprint area x slab thickness x number of floors. For example, a building detected under the image with the name image_12_1 is class 9_p and a damage class 1. The footprint found is 1305 sqm, the walls volume is 4935 cubic meters, slab volume is 1175 cubic meters. The next step is to apply the material loss factor which is our damage classification. We assume that for class 1 we lose 5% of the material, class 2 – 15%, class 3 – 30%, and class 4 – 100% (very high probability that the building will be demolished). The next step is to convert a volume of material into kilograms and multiply it with a kgCO2 per kg of material value. According to the paper «CO2 emissions from building life- cycles» by DTU [17], which analyzed CO2 emissions from materials including a full life cycle with production, transport, building, application, demolition, and removal, brick has a value of 0.23 kg CO2/kg, and the reinforced concrete 0.9 kg CO2/kg. These values were used for the final calculations


Results
Having maxed and analyzed 2142 buildings in Mariupol, Ukraine, we calculated that there is 396809m3 of brick material lost, 414926m3 of walls from reinforced concrete, and 309869m3 slabs from reinforced concrete. This results in 171421589 kg of CO2 for brick, and 1391608165 kg of CO2 for reinforced concrete. The total CO2 emissions amount, calculated from 2142 buildings in Mariupol, taking into account only raw walls and slabs, is 1563029
t of CO2.

Mapping
We also visualise the detected buildings on a map of Mariupol.
Map 1 shows the plot of buildings on a map according to the damage class. Map 2 shows buildings types, and map 3 shows buildings based on their predominant material.

