
The LegoLizer Vision
The core idea behind LegoLizer is to train a machine learning model that can predict and evaluate the use of specific modules to achieve a certain geometry.
In this exercise, we use LEGO modules to train and predict on our features.
This project leverages the power of computational design and machine learning to not only simplify the design process but also to provide detailed evaluations of the construction, including the number of blocks needed, the cost, and the form deviation from the desired structure by leveraging a trained model to predict these features without actually running a legloziation simulation.
The Process
Our project involves several key steps:
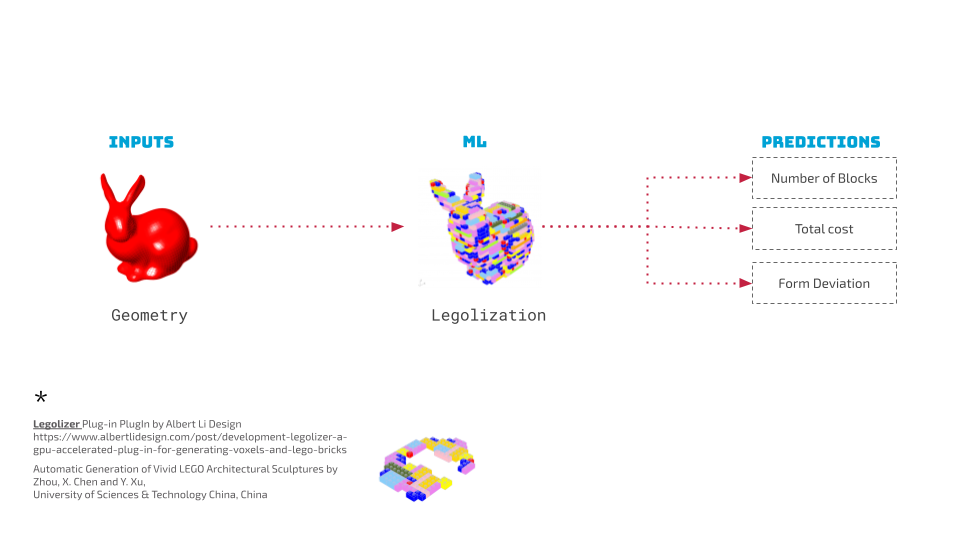
- Mesh Geometry Input: We start by providing a mesh geometry as the input. This geometry is then processed through a series of steps to convert into a Lego-compatible structure.
- Legolization Plugin: The actual conversion of the mesh into Lego blocks is done using a plugin called Legolizer developed by Albert Li, based on a research paper by Zhou X., Chen, and Y. Xu from the University of Science and Technology of China. This plugin helps in voxelizing the mesh and determining the optimal Lego block distribution.
- Feature Extraction: Several features are extracted from the voxelized mesh which are crucial for training our model to understand the complexity and characteristics of the target geometry.
- Training the Model: Using the extracted features, we train our model to predict the total number of Lego blocks, the cost, and the form deviation.
Our Approach
We explored two main approaches during our project:
Approach A: Open World Mesh Conversion
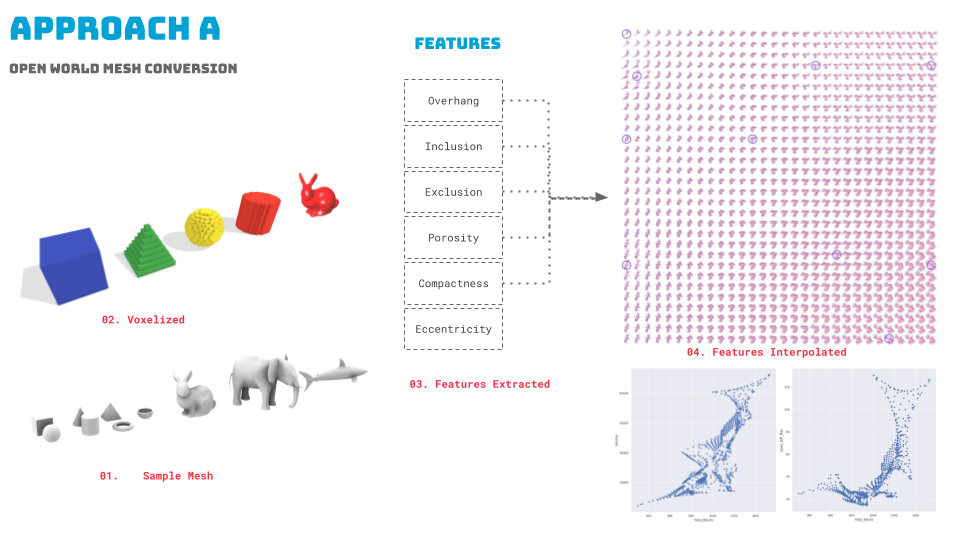
- We started by creating and voxelizing ten mesh samples of varying complexity.
- Features were extracted and interpolated using Self-Organizing Mapping.
- Since we had interpolated features which we were trying to train the model, the plots and correlations resulted in overfitting, so we tweaked our approach.
Approach B: Sample Parametric Surface
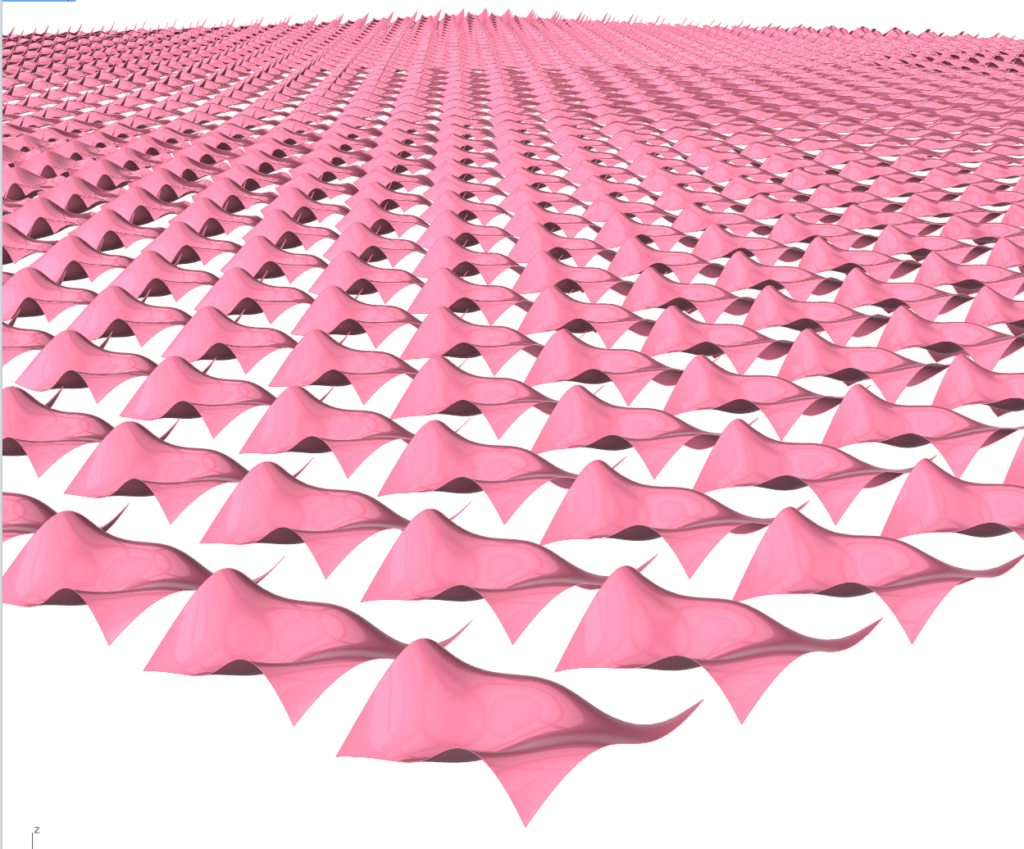
We set out to train our model based on a controlled parametric surface which can be thought of as a unit surface coming off any such mesh geometry. This parametric surface is created using the controlled translation of sample points in z-axis. We then interpolated the parameters of this surface to get a range of complexity and variance of this unit surface.
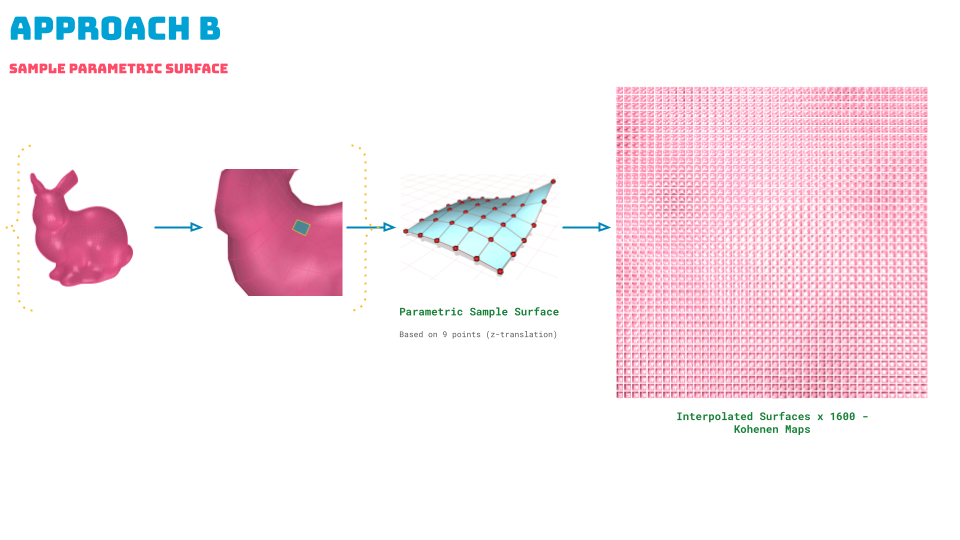
A controlled parametric surface was created to serve as a unit surface, with z-axis translations generating 1600 variations. Features such as surface area, perpendicularity, average curve angle, and volume under the plane were analyzed. This approach provided a robust dataset for training our model.
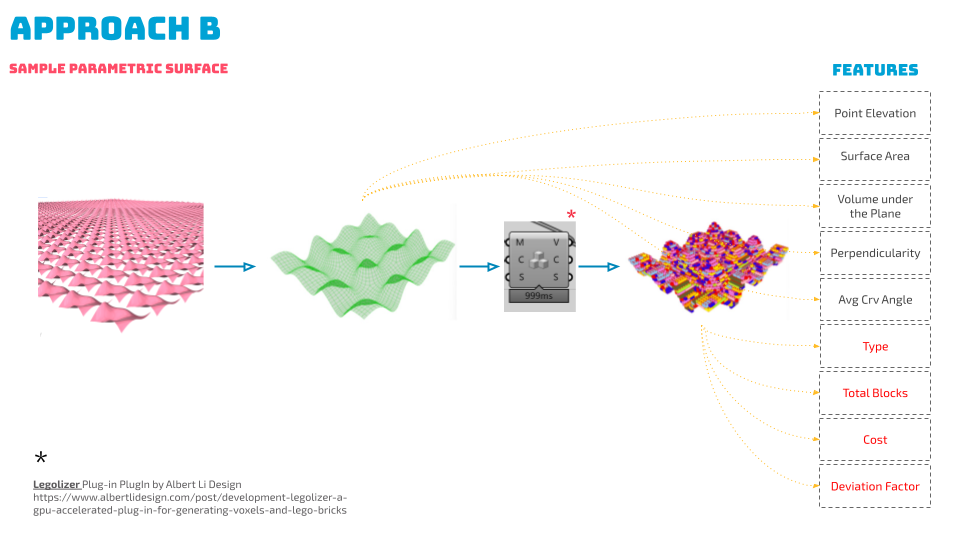
The figure above shows how certain features are extracted from the surface analysis and the rest are then calculated post-Legolization when the surface has been translated using the Legolizer plugin into 11 different types of LEGOs. These types include:
Feature Determination
Key Features:
- Surface Area: The area of the generated surface.
- Volume under the Plane: The volume between the surface and the xy plane at a -2 z elevation.
- Perpendicularity: The sum of areas with certain inclinations divided by the total surface area.
- Average Curve Angle: Average inclination angles from the curvature analysis of subdivided surfaces.
- Deviation Factor: Sum of distances from voxel center points to the closest points on the original surface.
- Total Blocks and Cost: Total number of Lego blocks and their cost.
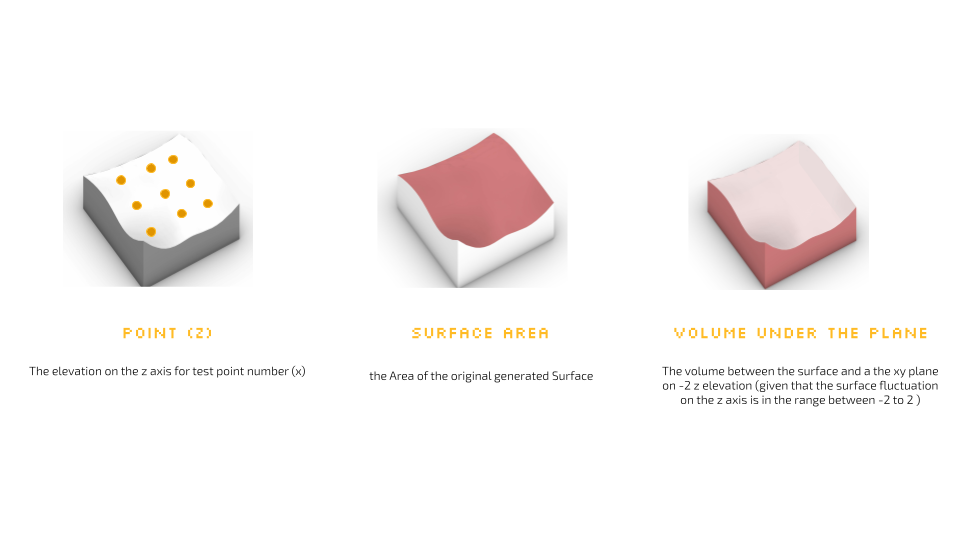
These three deatures can be regarded as the preliminary study of the surface which include projecting 9 sample points on the surface and read their vertical values(z-axis translations), Surface Area of the surface, and the Volume that it creates uder the surface which varies with the curvature of the surface.
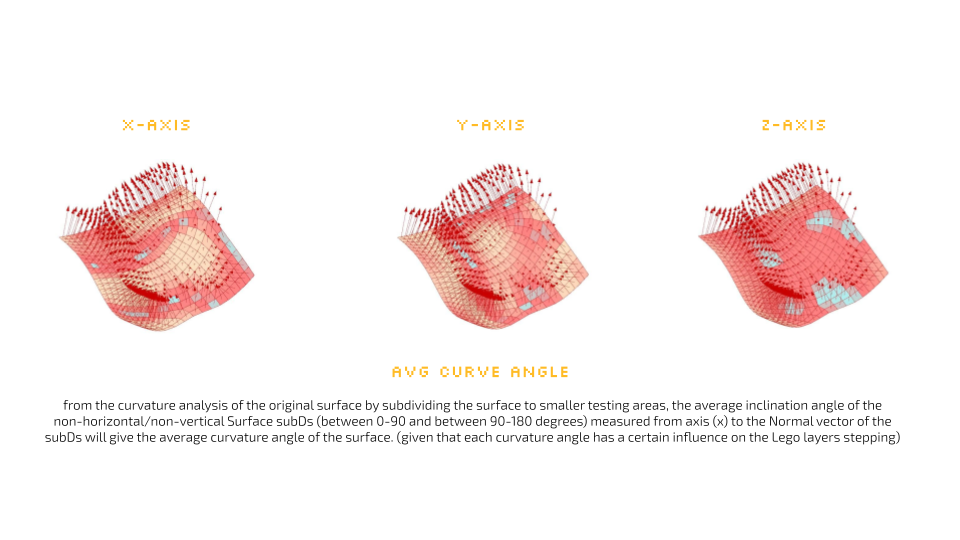
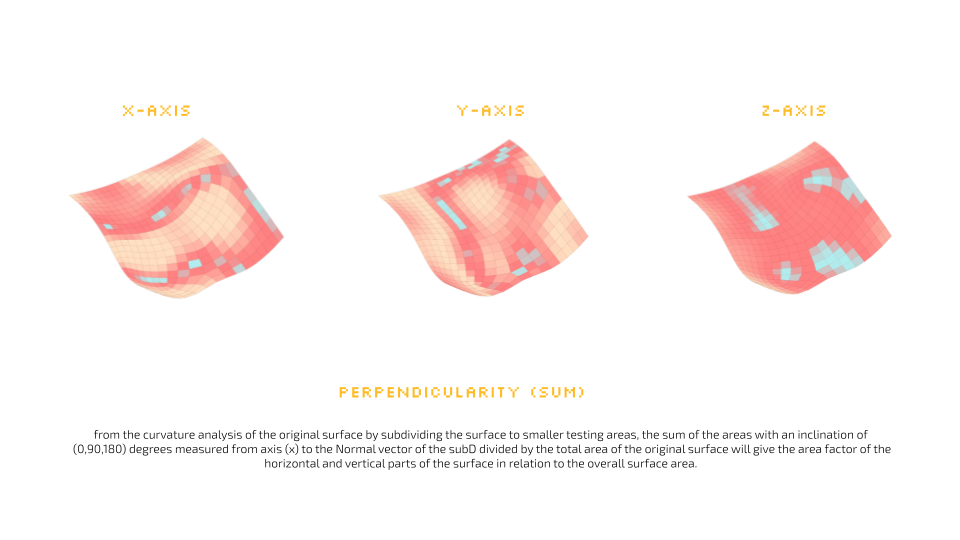
We then decode the surface complexity using two manufactured features; Avg Curve angle which is the average inclination angles of the normals on non-flat faces of the mesh and Perpendicularity which is a sum of the flat faces of the mesh, Both these features are collected on all three axis.
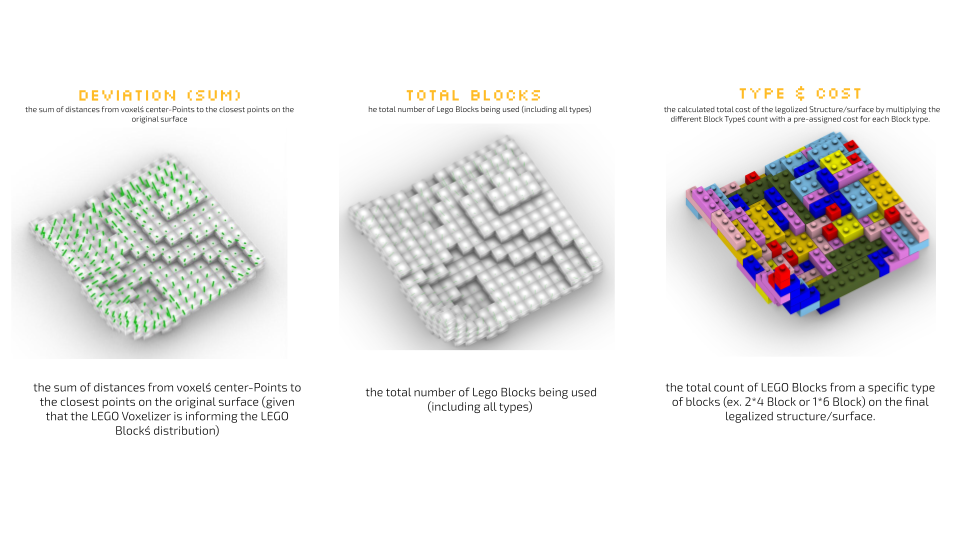
Lastly, post-Legolization, we add three more features which our also our predicted features. These include the Deviation Factor of the Lego voxels from the actual surface, the total number of legos used and the number of each of the 11 types of LEGO blocks used for which we assigned a specific unit cost to each type. Currently, a standard LEGO family is considered (11 brick types), they are 1×1, 1×2, 1×3, 1×4, 1×6, 1×8, 2×2, 2×3, 2×4, 2×6 and 2×8 bricks, all having the same height.
Dataset Creation and Feature Extraction
Once we had the features determined, we then used Kohenen Mappin ( a Self Organizing Mapping technique) to interpolate 1600 variation of the unit surface to create dataset for training.
This is what our dataset for training looks like:
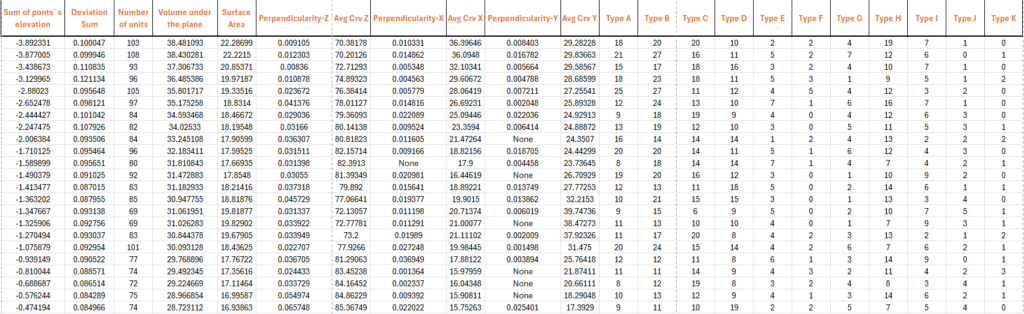
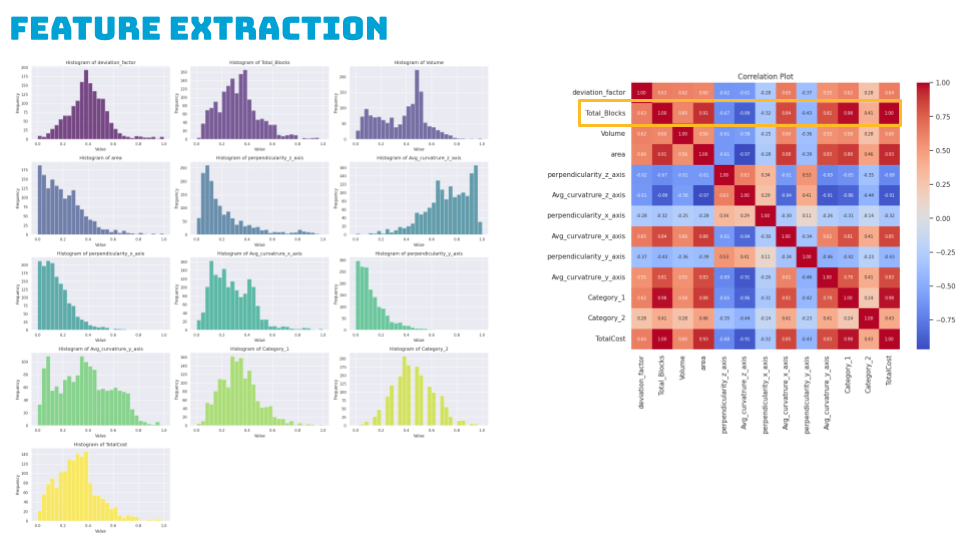
We then plotted all our features against a deterministic feature like the Total number of Blocks to check the data spread and its correlations. Histograms of scaled data revealed non-cohesive distributions and potential outliers thus indicating non-linearity in the heatmap analysis, with positive correlations observed between average curvature, volume, and prediction features.
We then conducted a Principal Component Analysis on 7 features to streamline the most important features impacting our predictions. The biplot shows 5 features diverging, indicating their importance. Features aligned with perpendicuarity_z, area, and Avg_curvature_x were excluded for redundancy.
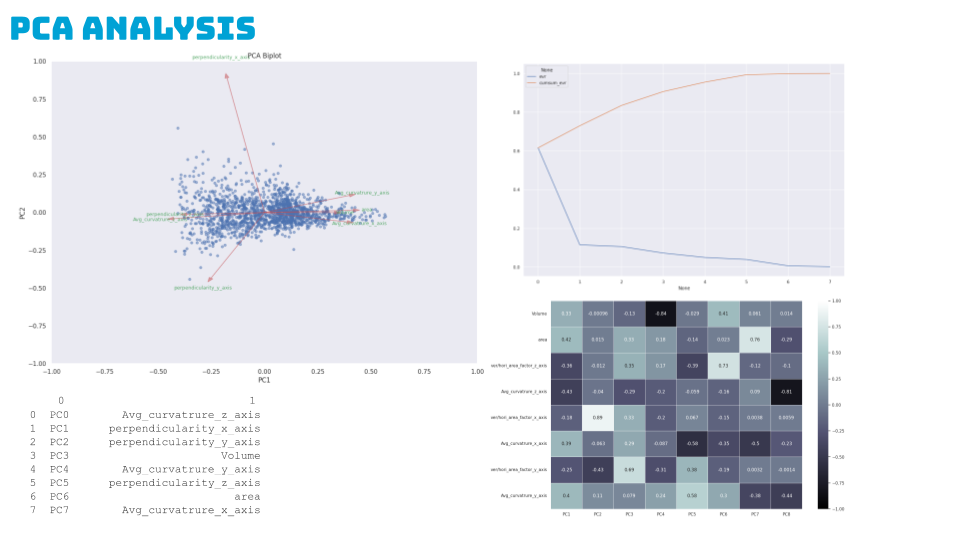
PC1 combines size and curvature features broadly, while PC2 emphasizes horizontal area along the x-axis.
Models and Predictions
We experimented with three different regression models to evaluate our predictions:
1. Simple Regression Model:
- Initial Model: Used three PCA features for prediction.
- Performance: Achieved an MSE of 96952. Expanding to five features based on heatmap analysis resulted in a low model performance (MSE: 164294.97).
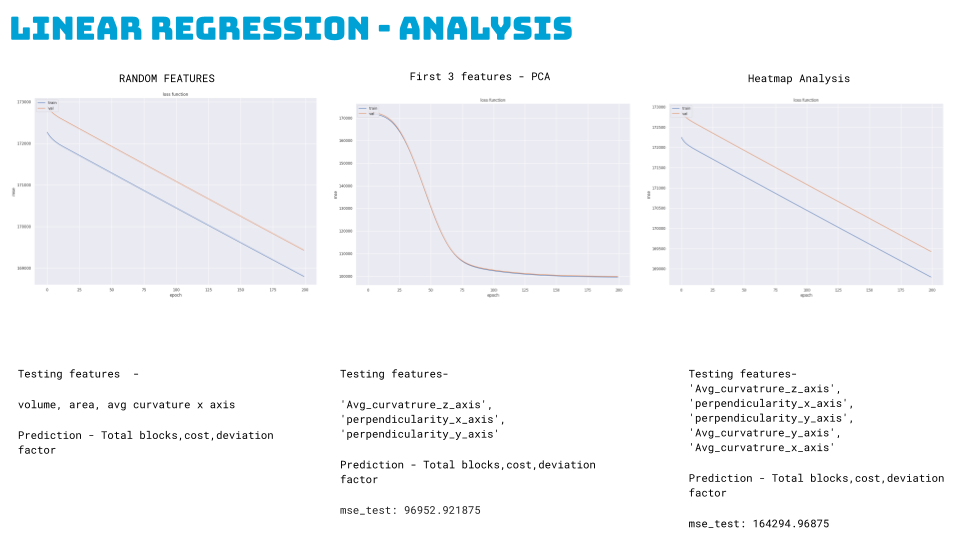
Here the types of blocks were categorized into two categories based on the geometry of the lego type as part of our feature engineering to predict a number of 2 categories of blocks rather than 11 types. These two represent bigger and smaller block types.
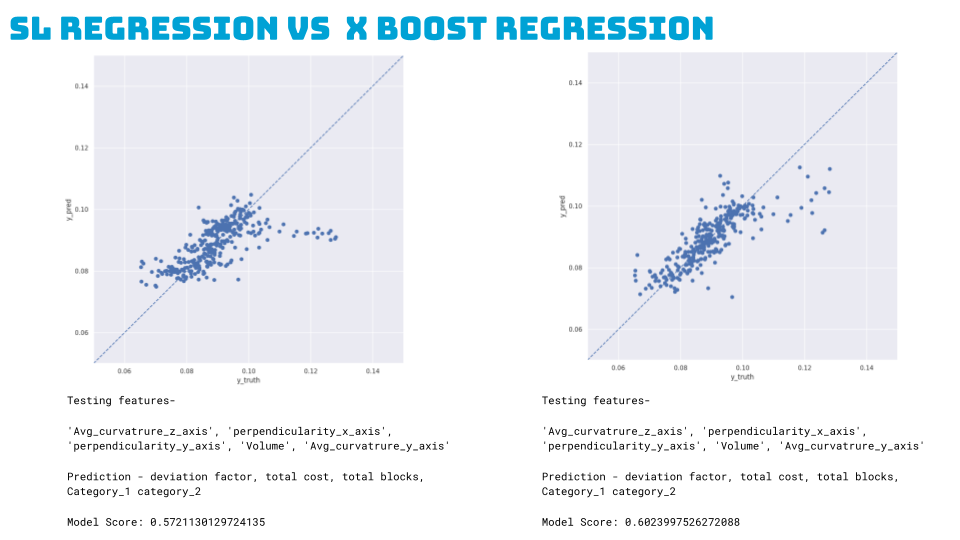
2. SL Regression Model:
- Compared with X Boost Regression, achieving a 60% model score.
- Features Used: Avg_curvature_z_axis, perpendicularity_x_axis, perpendicularity_y_axis, Volume, Avg_curvature_y_axis.
- Predictions: Deviation factor, total cost, total blocks, and block categories.
3. ANN Regression Model:
Three Features: Achieved an MSE of 0.024 with Avg_curvature_z_axis, perpendicularity_x_axis, and perpendicularity_y_axis.
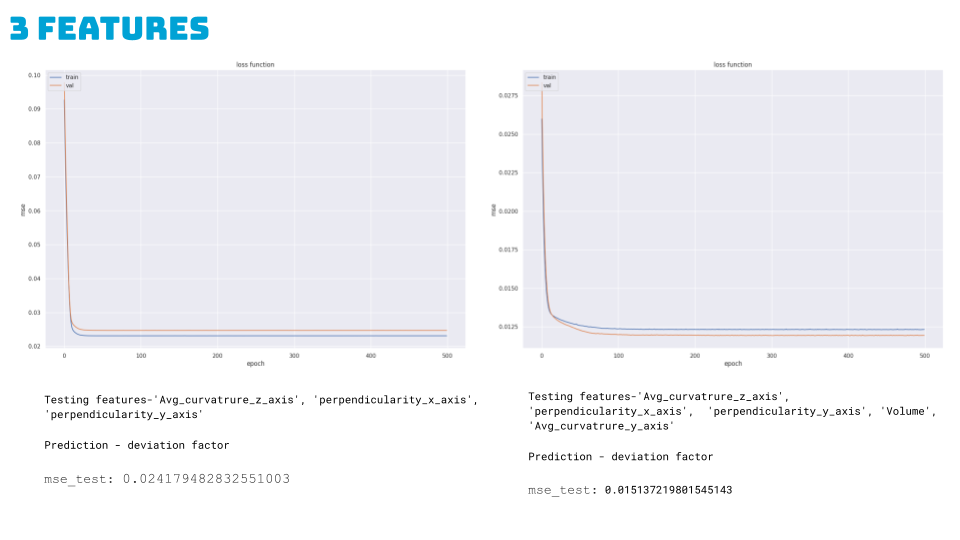
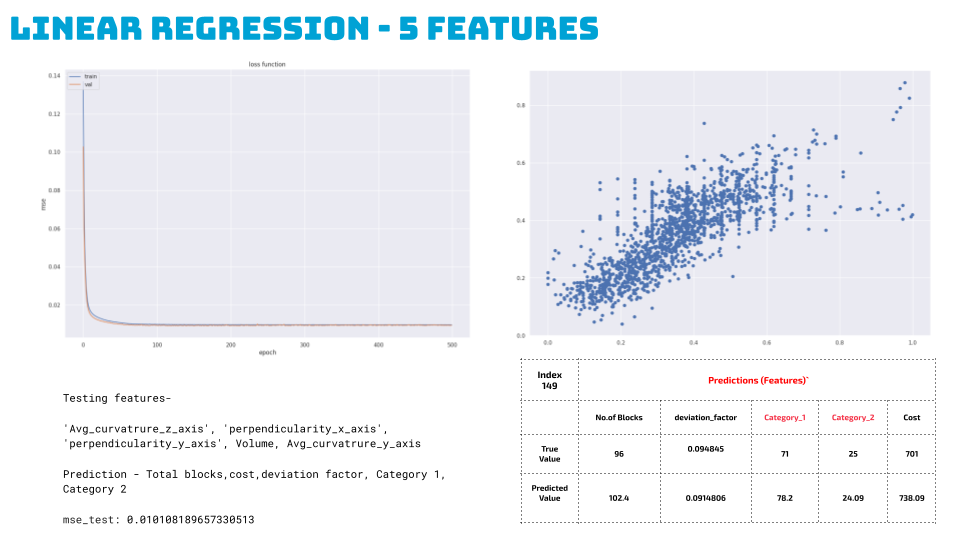
Five Features:
Finally, we ran it for 5 features, predicting total blocks, cost, deviation factor and both the categories for 500 epochs, Here we see a good performing model better than the linear regression model with mse at 0.007. And very few outliers based on the scatter plot.
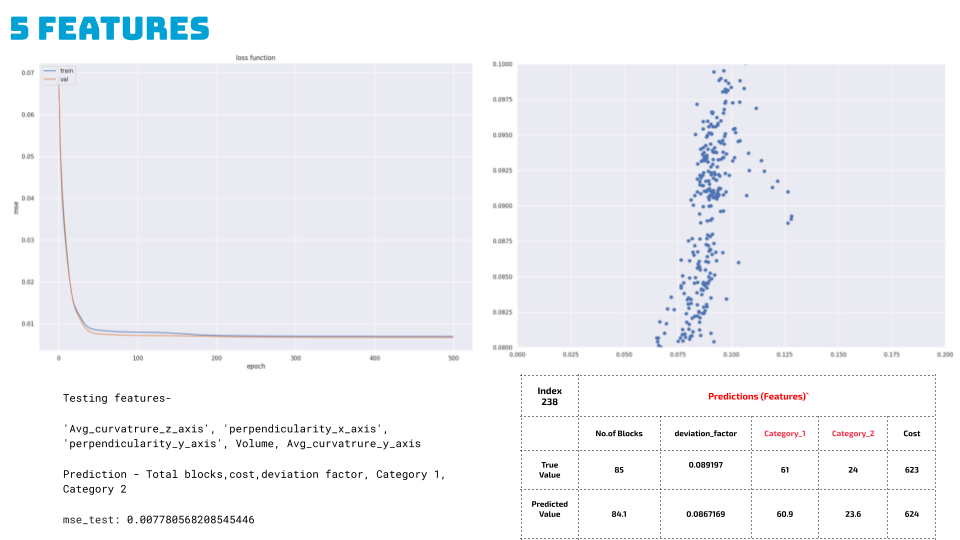
We ran a code to predict for a random index, and we see a difference of only 1 block, with all other feature predictions also close to the true value. Hence we further took the ann regression model for visualization into our grasshopper script.
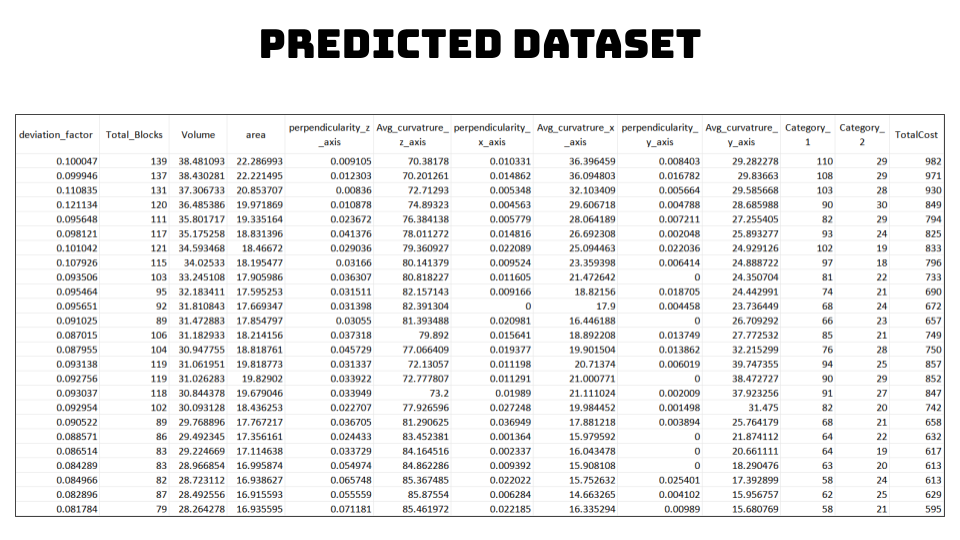
This is how our resultant predicted dataset looks like:
Result Visualization
Once our model was trained, it demonstrated impressive accuracy in predicting the number of blocks, cost, and form deviation. The ANN Regression model, in particular, showed great promise with an MSE of 0.007, indicating a well-performing model with minimal outliers.
The predicted data was visualized using Grasshopper, showcasing total blocks, surface deviation, and type count. This visualization helped us understand the accuracy and reliability of our model.
Surface Deviation
Application of the resultant deviation as an average to the surface to see the mean deviation predicted of the legolized (modularized) outcome against the original surface.
Voxelized Geometry
Total Blocks were visualized using unit voxels for visual verification, as we do not have the exact number of each of the 11 types of blocks.
Type Count
The two categorical types (big and small) predicted have been visualized against true values.
Conclusion
The LegoLizer project has opened new avenues in the field of computational design and modular construction. By leveraging machine learning, we have created a tool that can assist designers and architects in evaluating construction complexity and form deviation at early design stages. The potential applications of LegoLizer are vast, from educational purposes to professional architectural design.
We believe that the LegoLizer can be a valuable design tool, providing insights and evaluations that can enhance the creativity and efficiency of architectural projects. Stay tuned as we continue to refine and expand the capabilities of LegoLizer, pushing the boundaries of what is possible with Lego bricks and computational design.
