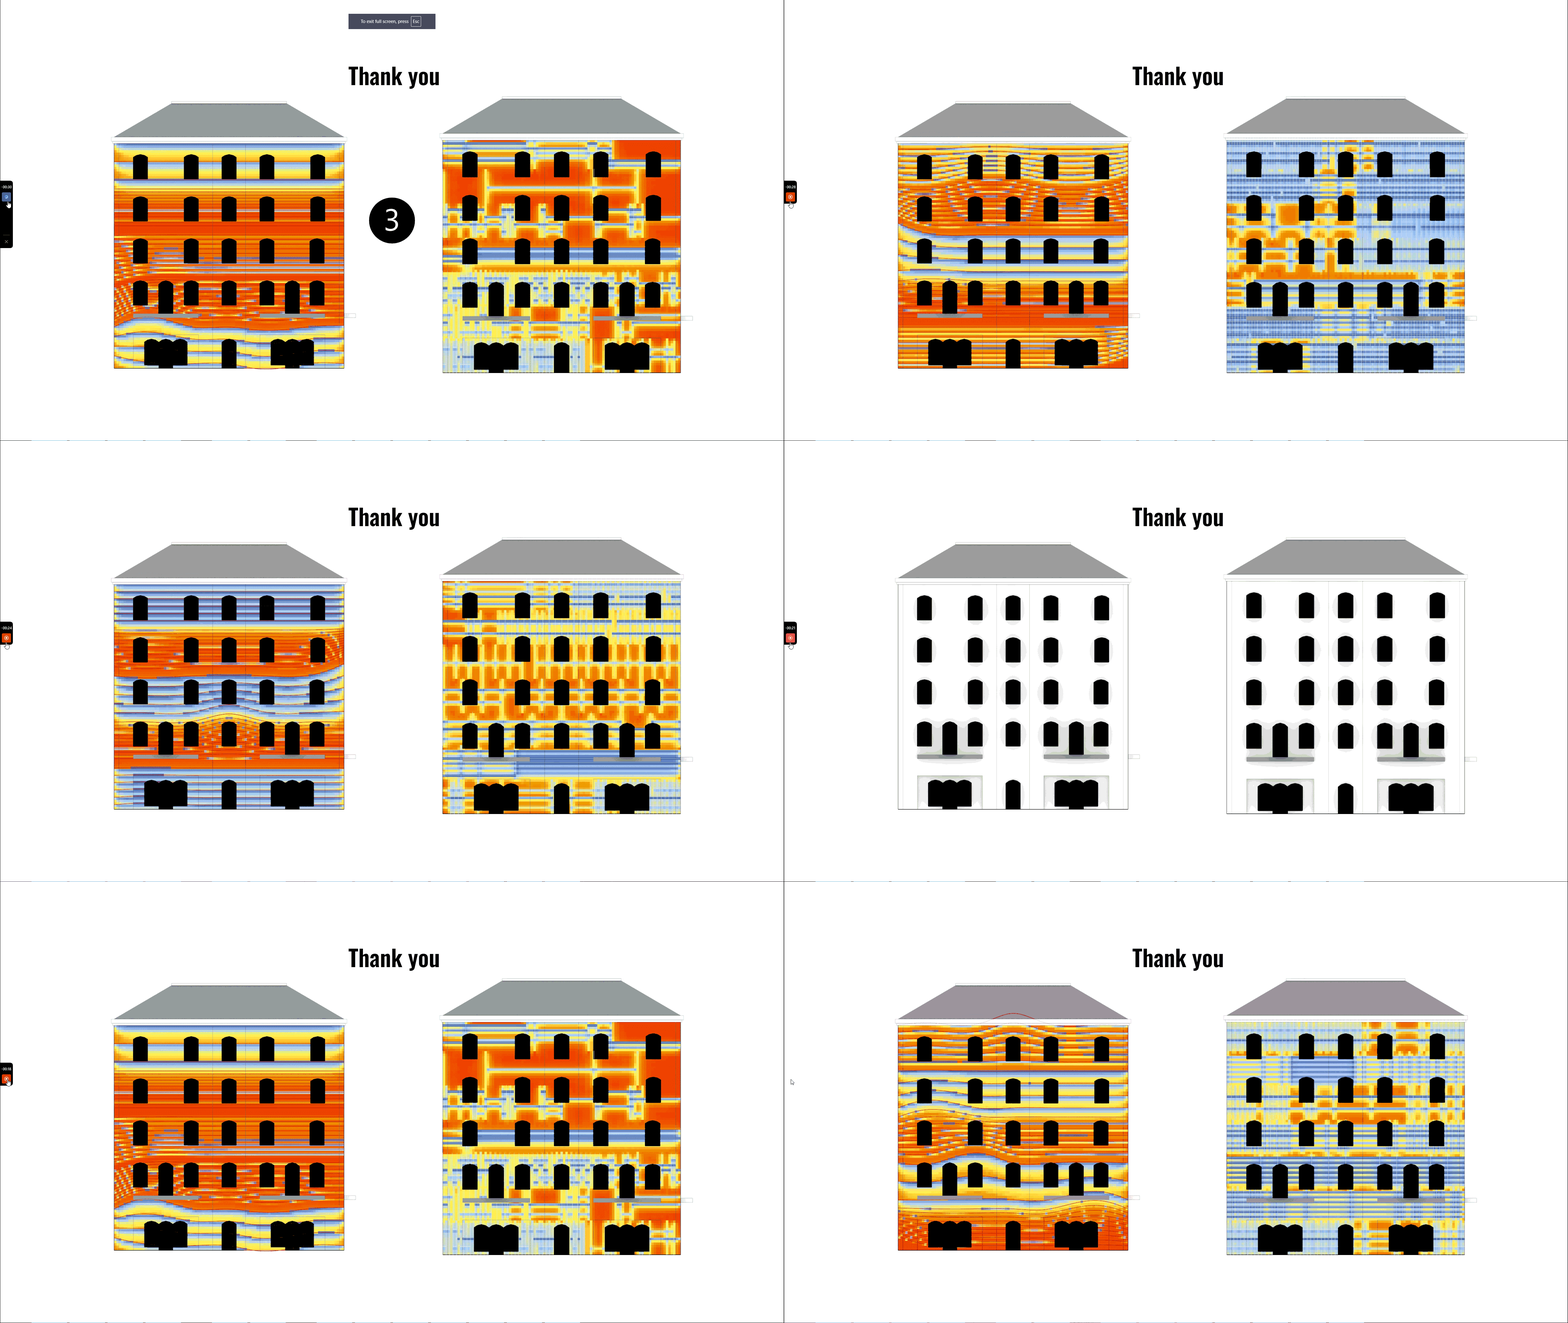
Project Aim
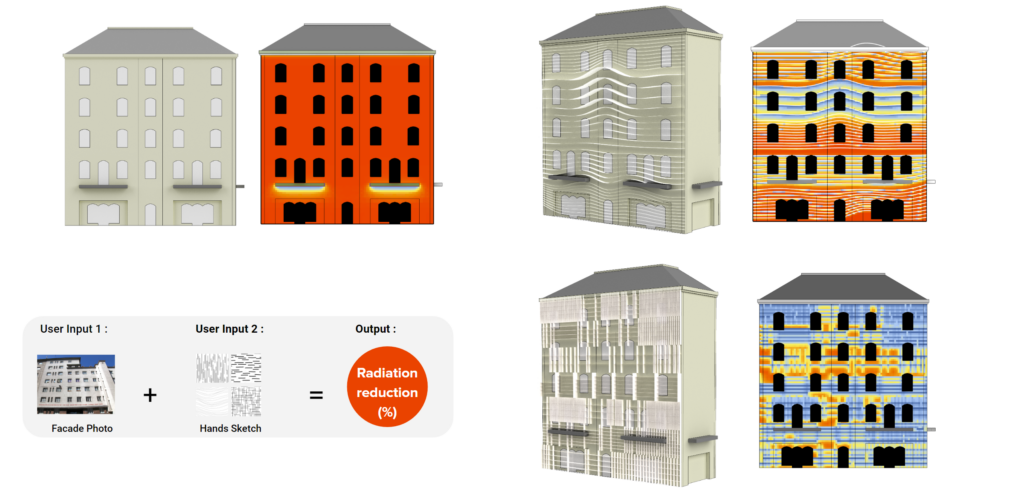
The idea behind the tool is straightforward, that is to hand-sketch louver lines over a facade image to demonstrate the potential reduction in solar radiation on the facade which is linked to a domino effect on the chain of sustainability, as reduction in radiation on the facade will lead to reduction of energy usage in the building. The workflow of this is represented below in Figure 1.

why ?
for whom?
for which?
The target users for this tool as seen in (0.1 – Figure 2) are people who aren’t radiation simulation tools savvy, but would use this tool as an intuitional way to bring sustainable orientation and interactive design in their buildings of interest. The tool currently focuses on energy reduction, which can be extrapolated to reduction in energy cost, budget balancing, and material calculations as a future potential. The buildings being tackled by this tool as seen in (0.2 – Figure 2) are in Vienna, as In the 1930s, Vienna initiated a modern social housing movement, which is called the “Red Vienna” era. After WWII, the city rapidly reconstructed, building 9,000 housing units per year. However, these buildings no longer meet current physical and social standards and these are our target buildings and not the ones which have a lot of architectural ornamentation and windows have deep shading devices .Looking into these buildings we found that not only Vienna but Central European area facing this issues and are focusing on finding a sustainable solution of renovation or regeneration post war II modern buildings (0.3 – Figure 2).

Project Workflow
1.1 Heatmap from original facade image
Pix2pix training was used to get heatmaps, for this we attempted 4 different paired datasets to achieve this as well as the results which can be seen in the Figure 3 which are :
Generated Facade – Grasshopper Heatmap 
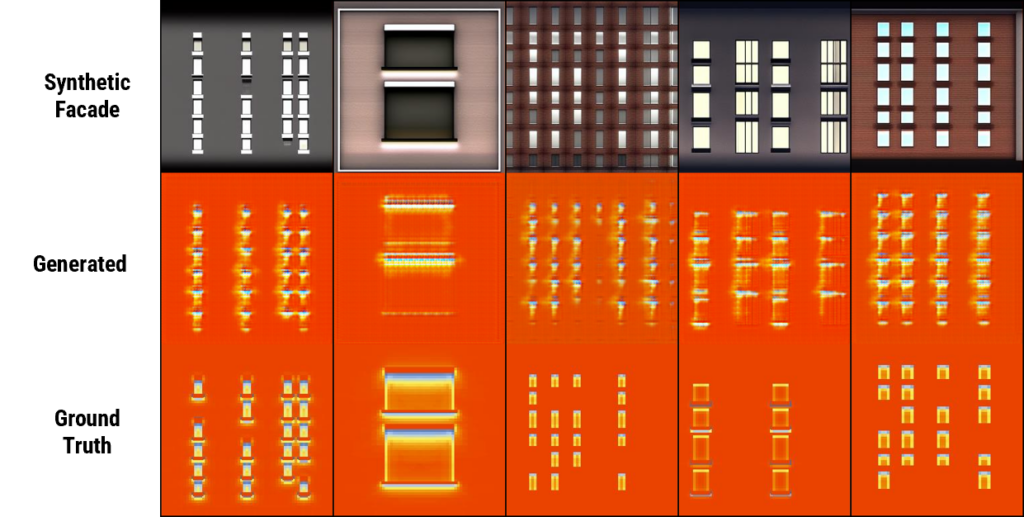
If one is wondering why Synthetic facade and not actual facade image, though the input of the user is a realistic facade photograph, skip to Section ???
As these results weren’t good enough as can be seen in Figure 02, and that is when a depth map was added in between the workflow, so the pix2pix paired dataset from Depthmap to Heatmap, which was attempted in these paired dataset
- Grasshopper DepthMap – Grasshopper Heatmap

- Generated DepthMap – Grasshopper Heatmap

- Grasshopper DepthMap – Grasshopper Heatmap along with Generated DepthMap – Grasshopper Heatmap


The third paired dataset was selected , though the first results were better but as finally the final workflow from facade image to depth map which is also a pix2pix model gives a generated depth map, hence it is only better to include them in the training. This dataset has 3 sets of images
- Grasshopper DepthMap generated using Color masking in grasshopper from a synthetic 3D facade dataset.
- Grasshopper Heat map generated using Ladybug from synthetic 3D facade dataset
- Generated Depth Maps for Realistic photographs ( explained in Section??)
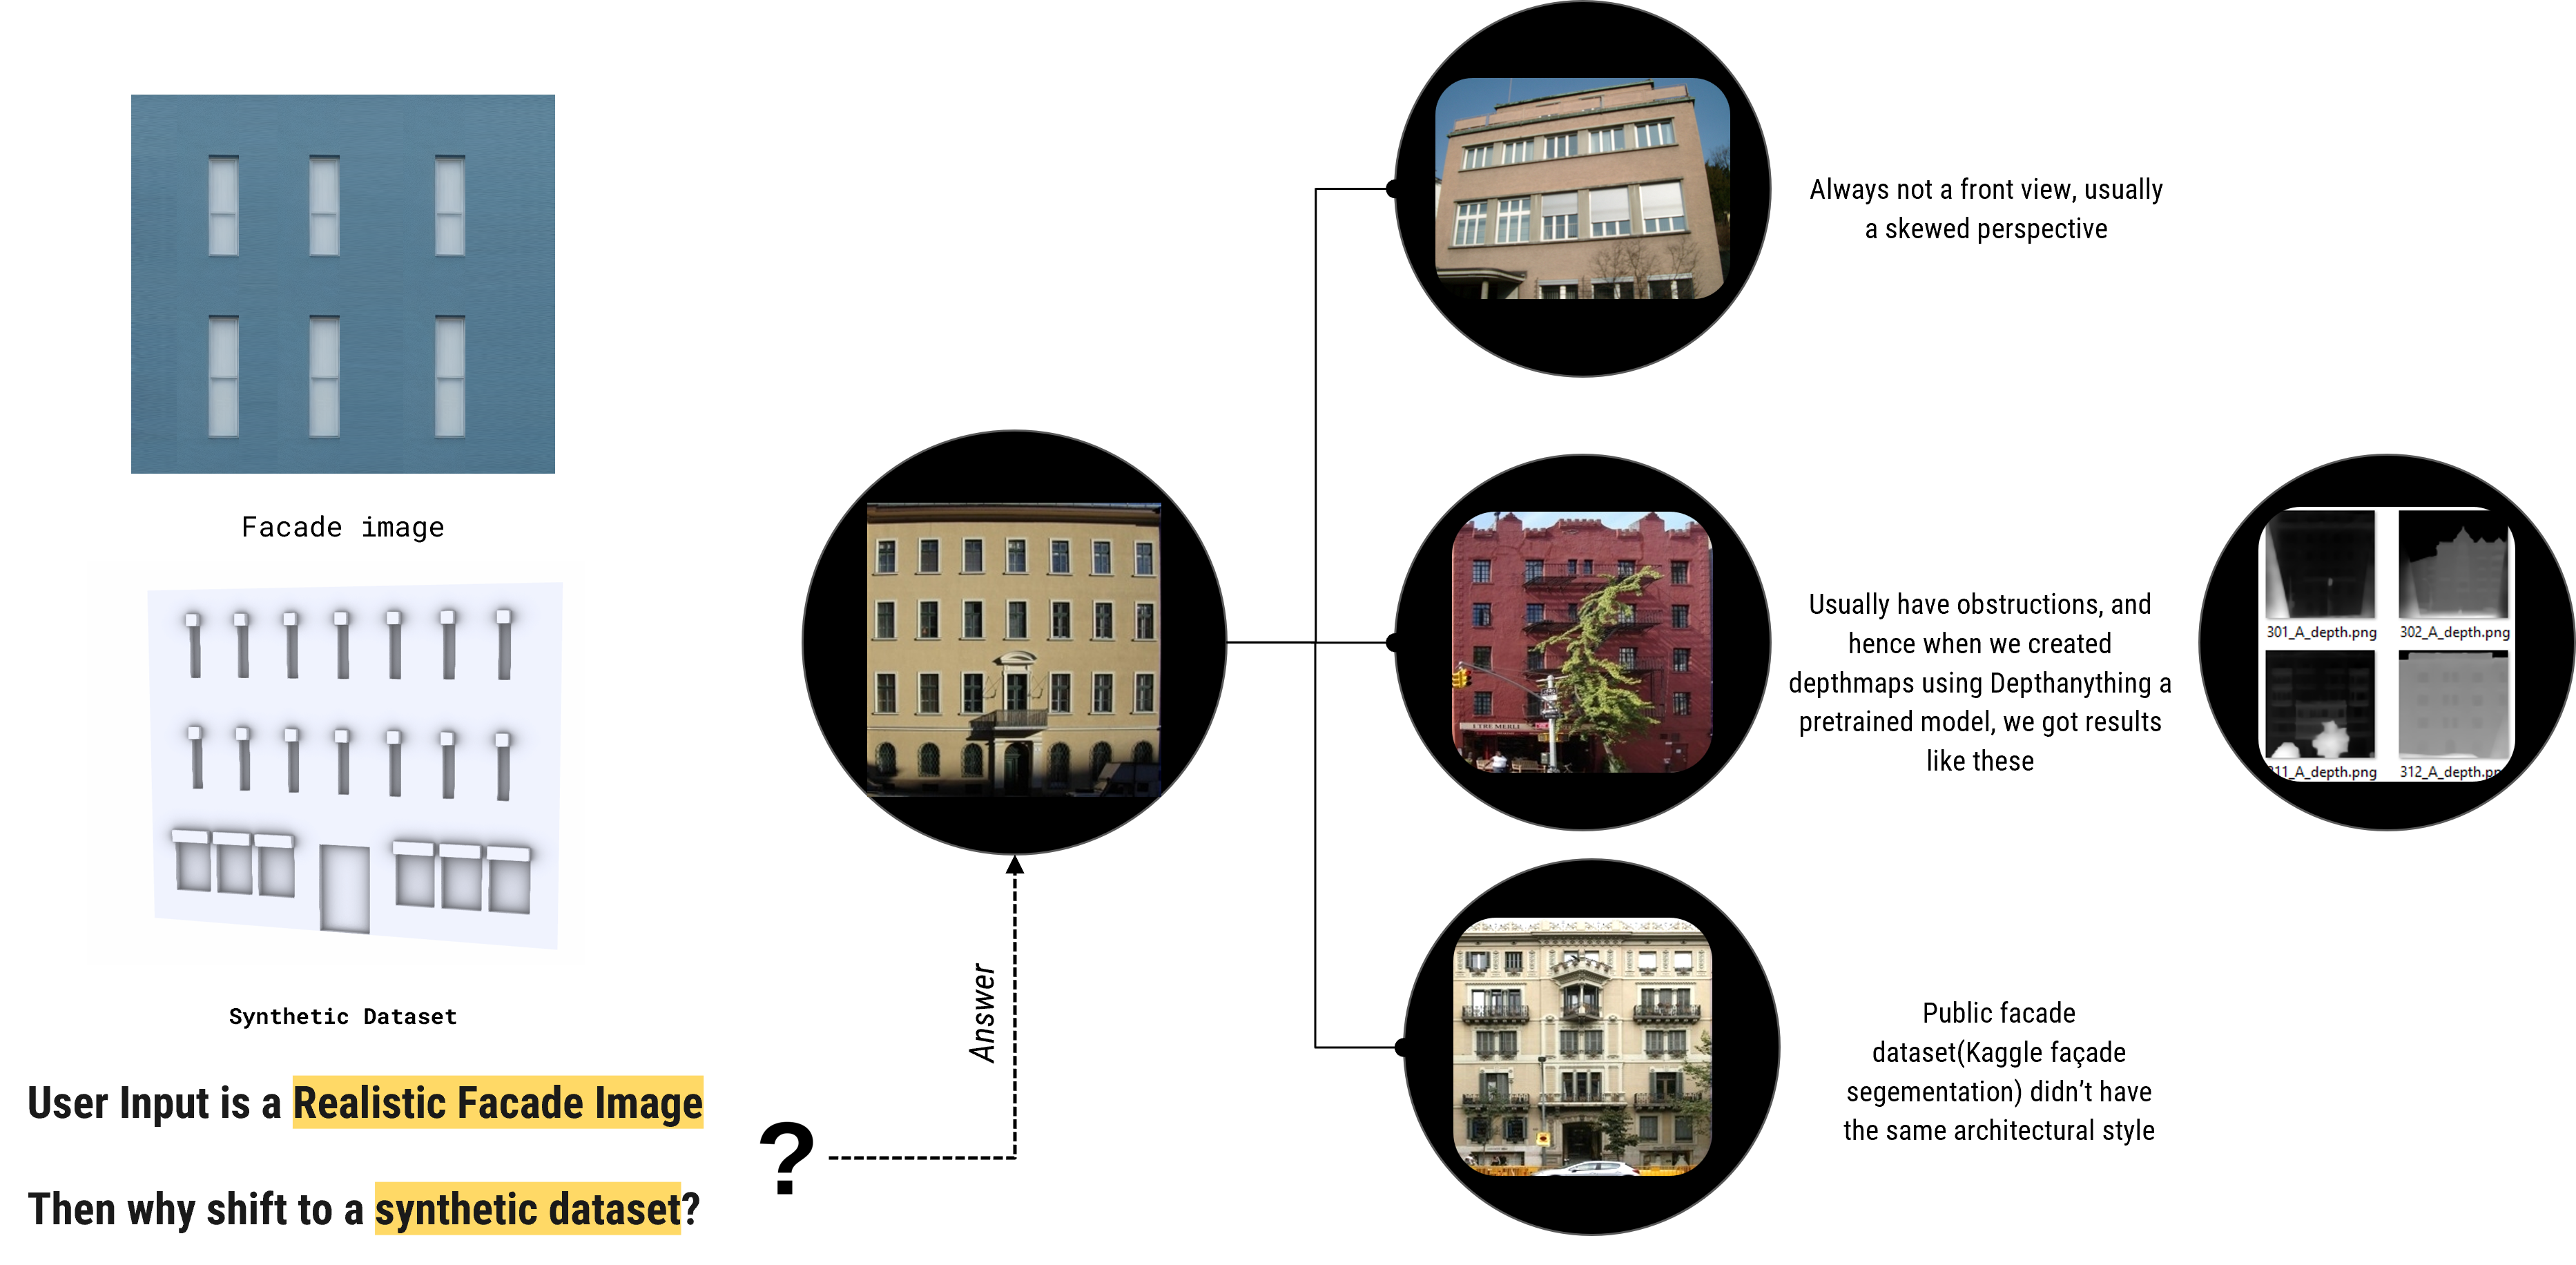
1.09 why the shift to synthetic dataset?
The diagram below explains this conundrum of shifting to a synthetic facade
1.09 how to get depthmap from realistic facade photograph
In order for the input Facade image to be converted to depth map, a reverse approach was taken where we the generated depth map was used in order to produce Synthetic Realistic facade renders. These were then used for training the pix2pix model in order for the input Facade to get correctly converted to depth map.
To solve the lack of realistic facade images and the need to relate input facade to our Synthetic facade dataset by using LoRA.The workflow of this training is represented in Figure ??? and for an in depth explanation visit our GENAI blog,

The workflow primarily involves these five steps : creating dataset, training and testing in order to get to our goal of generating depth map from the real Facade input by users. At the start lookx website is used to produce realistic renders ( time consuming hence was used for 100 dataset couldn’t be used for 400 ) these were then used to give an idea of the architectural style and train the Lora. These generated stable diffusion images were then trained using facade to depth pix2 pix to generate depth map. In our testing phase, we were able to input a real facade image and produce depth map that could then be taken for our heat map and further process.
2.0 Louver
We provide vertical, horizontal, random crossed and curves line to represent and further generate the louvers.
We encoding these four different type of line drawing. With depth information we can simulate the radiation value. Hoever it can only represet a flat facade input.
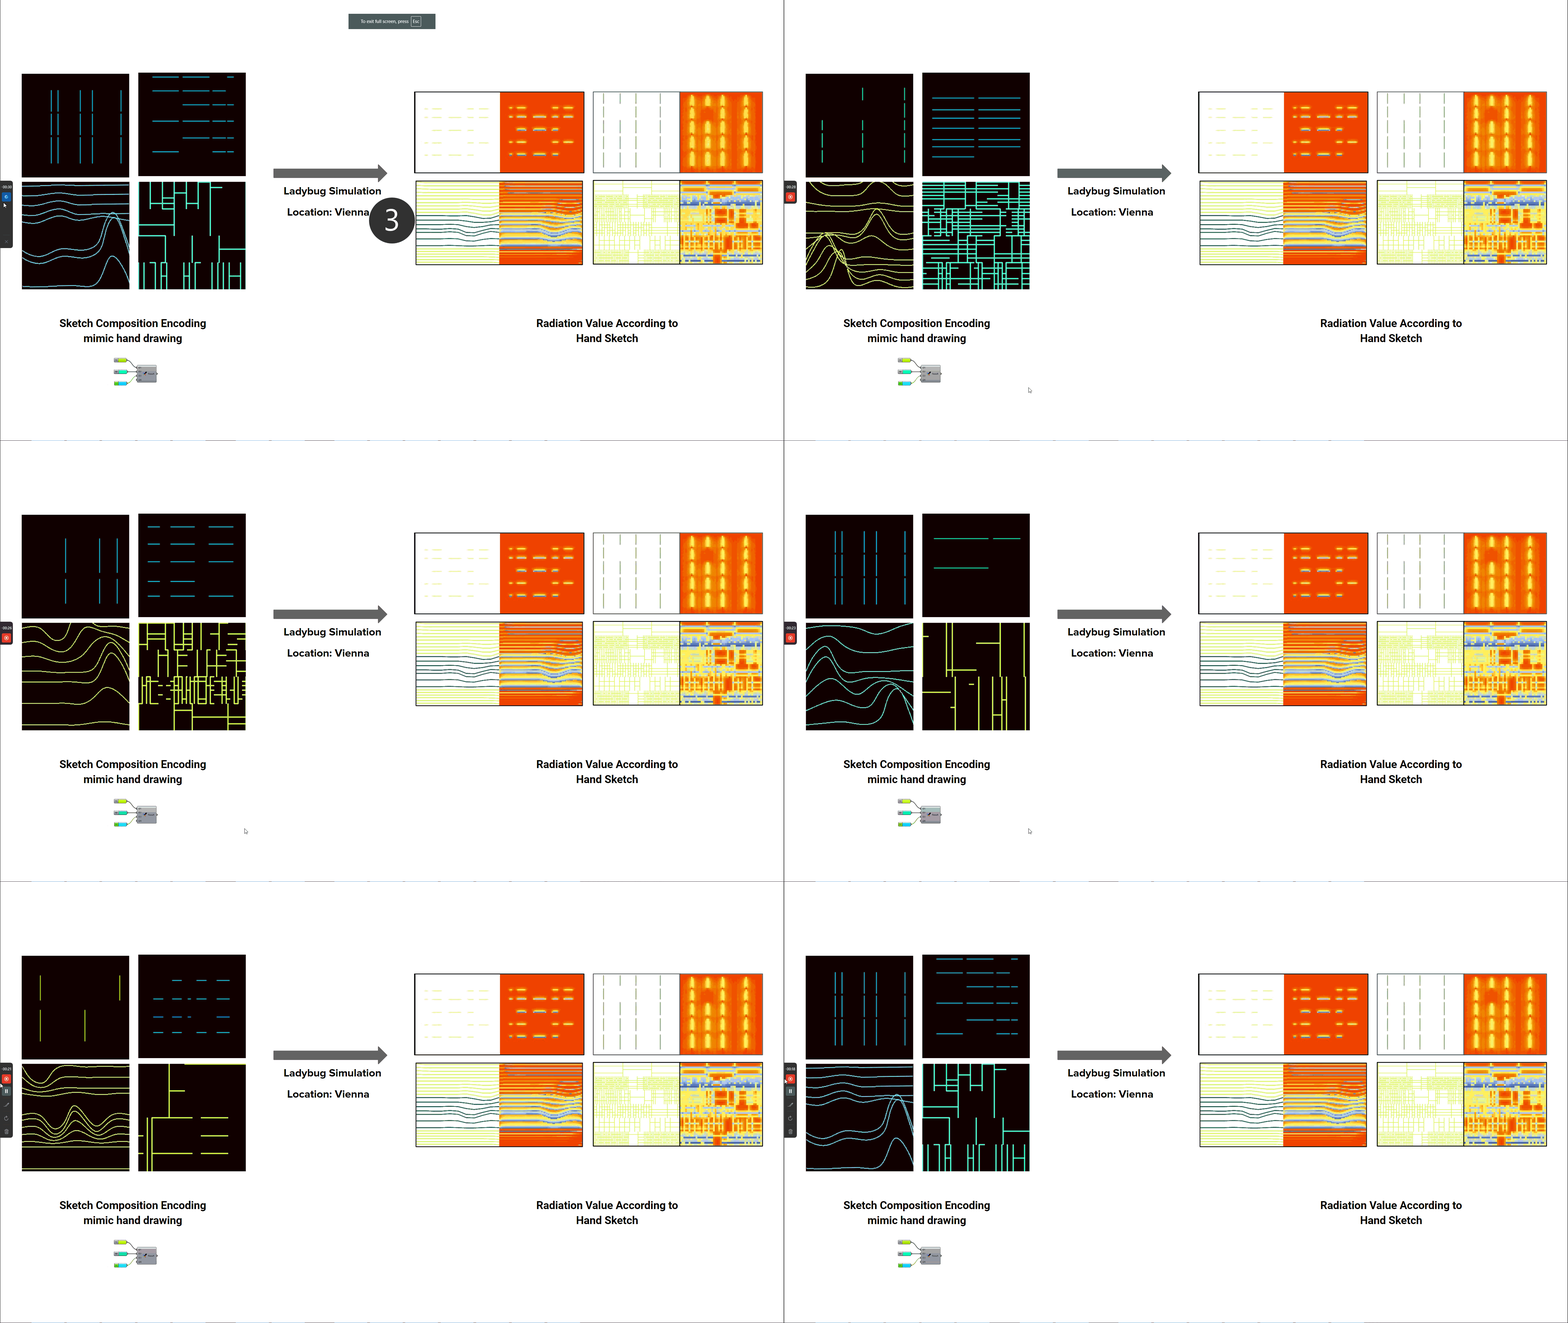
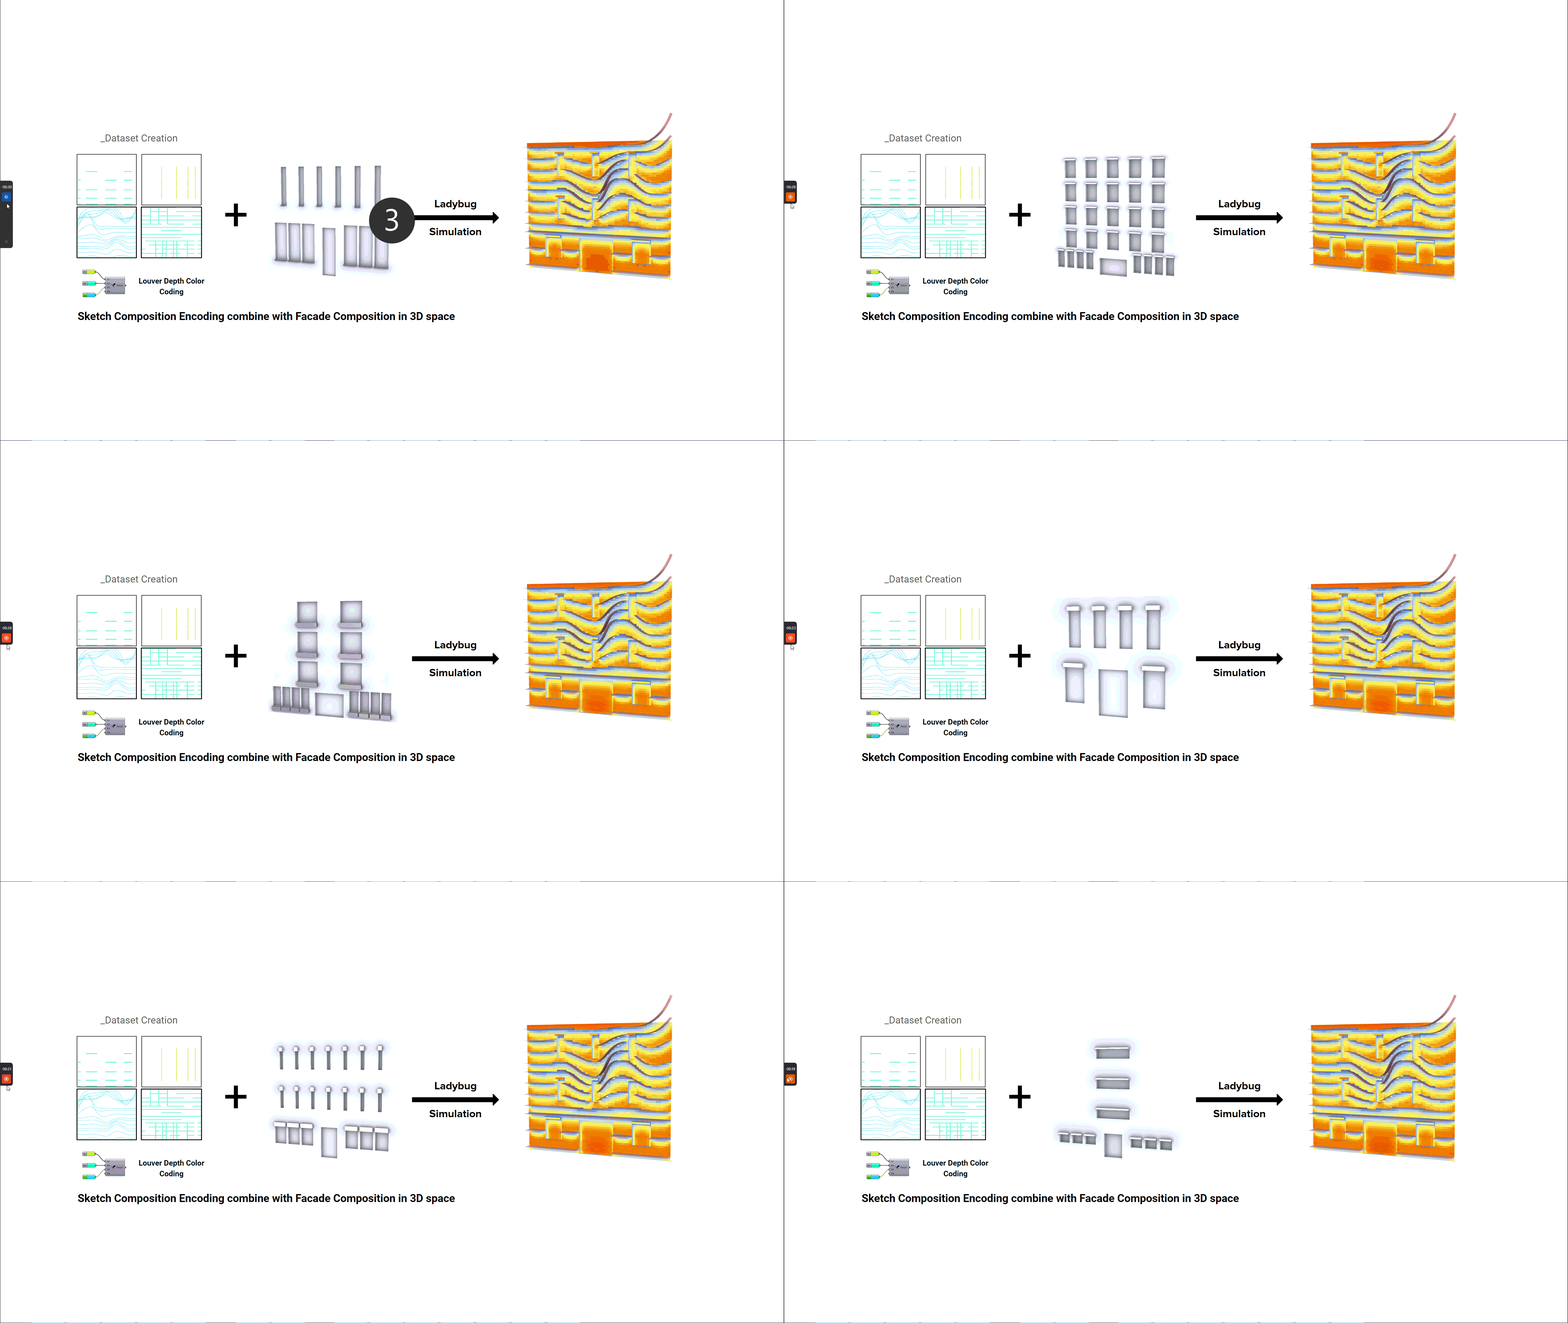
For louver workflow, the user could provide provide vertical, horizontal, random crossed and curves line to represent the proposed louver design. These were the 4 types used to create a dataset using 4 different colors to represent 4 different depths on the flat façade. These were then over lapped on the synthetic facade for adaption of the radiation value on a facade with windows, overhang and concave set windows as seen in Figure 7.
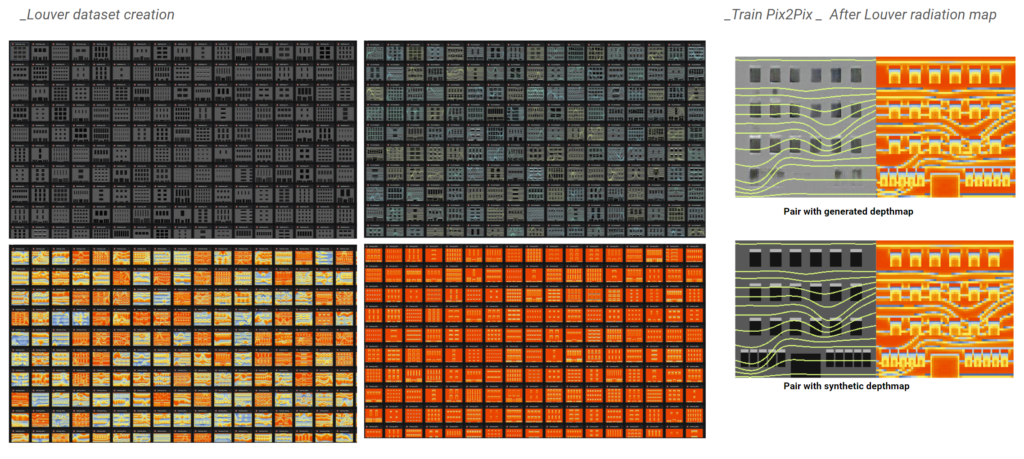
After dataset creation of the louver heatmap, the depth map overlayed by these lines is trained using the final pix2pix training which also uses the mix pair strategy to improve the quality as mentioned earlier as seen in Figure 8.
3.0 Revisiting the training pipeline

4.0 Radiation reduction Calculation
Workflow

Cross-checking of Values
When the final values of the radiation reduction were compared the values from this method and the actual values from the ladybug radiation were the same as can be seen in Figure 11.

4.0 Tool Demo and Scope
The video shows how the tool works as of now, in the current stage of development it is used via Rhino and the Google colab file, the future scope of development is to make this workflow entirely as a webapp.
