
Introduction
Professor Ivan Sutherland at the University of Utah supervised several doctoral students in the 1970’s and 1980’s who later created many of the biggest leaps in computer graphics. These include Ed Catmull who founded Pixar and developed Catmull-Clark Subdivision, Alan Kay who worked on the first graphical user interfaces and the first laptop, Jim Clark who founder Silicon Graphics, Frank Crow who developed Anti-Aliasing, Henri Gouraud who did Gouraud shading, and John Warnock who created the software company Adobe. Two of the earliest 3D models ever drawn are a model of Professor Sutherland’s 1967 Volkswagen Bug created by his students and a model of Ed Catmull’s hand while he was a student.
Another Ph.D. student attracted to the University of Utah to work with Professor Sutherland was Martin Newell. He wrote his thesis on ‘The Utilization of Procedure Models in Digital Image Synthesis’ but is better know for creating the Utah Teapot. Late at night in 1975, Newell was struggling to decide what to draw in 3D in order to showcase his recent advances on Bézier patches. Newell’s wife made him a cup of tea and recommended why not draw our teapot? This teapot has become one of the most famous test models in computer graphics. Test models are primary models used to explore, test, and demonstrate a variety of operations that any software or technology can accomplish. They can be used to compare the speed and effectiveness of new algorithms while processing the same model. A similar concept exists for images known as a ‘Standard Test image.’ The cropped centerfold from the November 1972 edition of Playboy Magazine features Swedish model Lena Forsén and is commonly used to test image-processing and compression algorithms. The image is better known as ‘Lenna’ after some people were mispronouncing Lena Forsén’s name. New test models appear as new technologies push forward. The Cornell Box (1984) was presented at SIGGRAPH’84 by researchers from Cornell University to highlight advances in rendering. The Stanford Bunny (1994) was created to show advances in 3D scanning where researchers from Stanford University scanned a ceramic figurine of a rabbit.
I’m not sure if there is an already well-established test model for environmental design simulations but I think there should be one. This test model could be used to compare the performance of various types of simulations.
Sun
In Week 2, I began studying the impact of architectural form on solar radiation with a parametric model.
I moved towards a subdivided courtyard block with adjustable heights to include a volume of space protected from both the wind and the sun to create contrast against the space on the exterior of the volume. This would become my test model for future weeks.
We should aim to lower total radiation on the building’s form as this would need less air conditioning in the hot season. Shading elements were studied in their impact at achieving this goal remembering that the sun is very high in the sky during Summer and not to the south where it would be in Winter. The best options had the tallest volume on the south side of the site. Many people leave their apartments in the morning to go to work and return in the afternoon. This assumption is based on life before Covid-19 and may need to be reconsidered where everything is different now for life going forward. Lowering solar gain in the morning is best achieved with the tallest volume on the south-east corner while lowering solar gain throughout the evening would be best achieved by the highest volume on the south-west corner. Before Covid-19, lowering total radiation for when people came home from work may have been the priority but that’s not as clear cut anymore.
Thermal Comfort
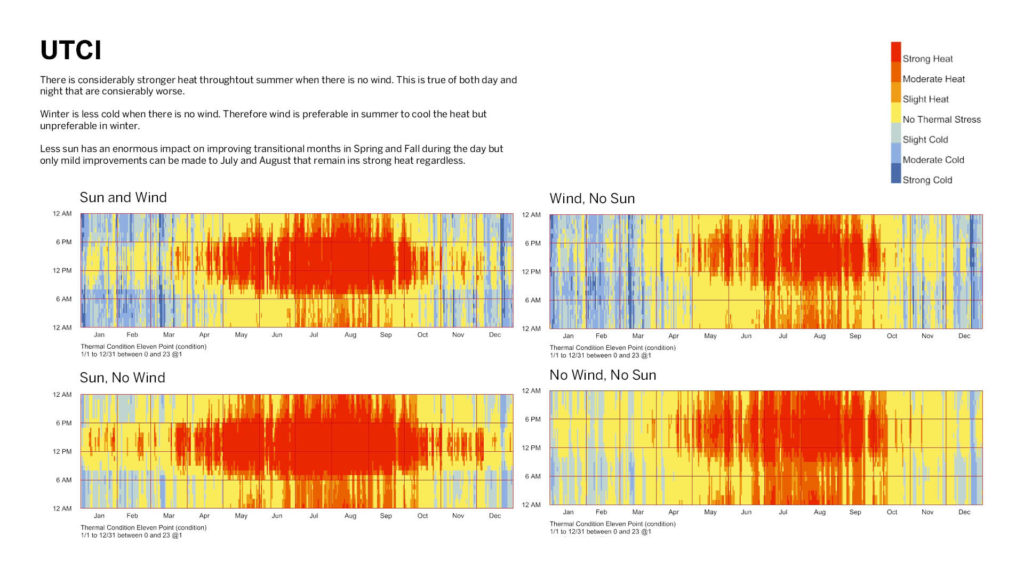
The charts below show UTCI (Universal Thermal Climate Index) at various states with and without the sun and the wind. They show that the summer has the least amount of ‘Strong Heat’ (red) and the most amount of ‘No Thermal Stress’ (yellow) in the ‘Wind, No Sun,’ chart. This suggests that thermal comfort in the summer is best achieved with shaded spaces that have wind. Winter however has the most ‘No Thermal Stress’ (yellow) and least ‘Strong Cold’ (blue) in the ‘Sun, No Wind’ chart. This is the opposite of summer that benefits from direct sun but wants to reduce the wind that carries the cold air with it. This difference between summer and winter may be better achieved with two courtyards, one for winter that is protected from the wind and exposed to the sun and another for summer that is shaded from the sun but exposed to the wind. The proposal for a test model should probably go this route of having at least two courtyards and more if the local climate necessitates it. However, summers in Denton/Dallas, TX are more challenging than winters, therefore I focused more on Texas summers for this project.
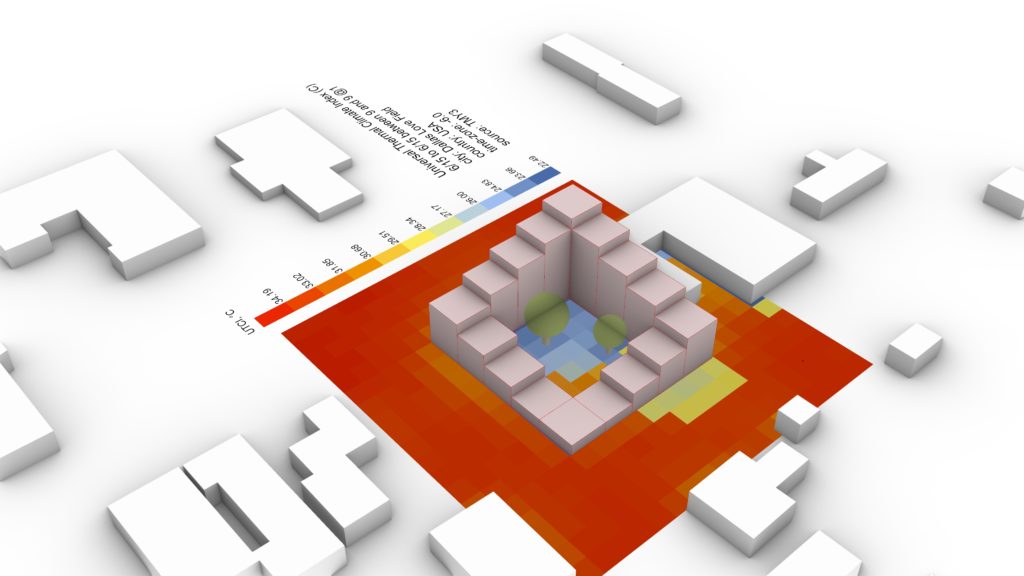
The image below shows thermal comfort at 9am in the hot season highlighting how a courtyard can be used to create thermal comfort. This option below has the tallest volume facing south-east. Thermal comfort is better achieved in the afternoon on the same day with the tallest volume on the south-west corner.
Daylight
Daylight can be increased in the building with larger windows, less shading elements, and avoiding deep plans. More daylight though means more solar radiation, more heat and more need for air-conditioning. A site in Oslo, Norway may seek to prioritize increasing daylight but a site in Dallas, TX wants to prioritize reducing solar radiation over its daylight factor where light is more abundant.
Wind
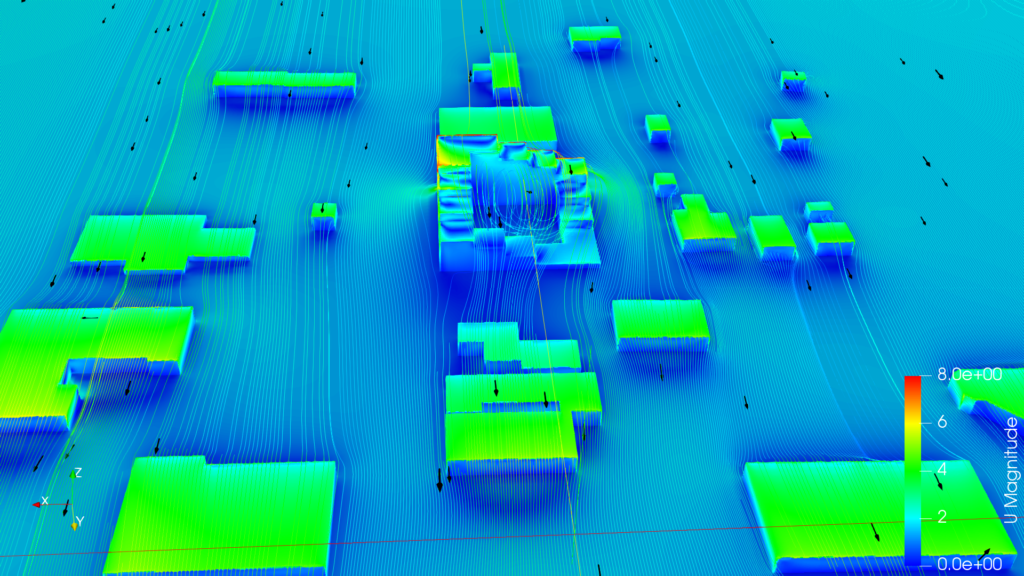
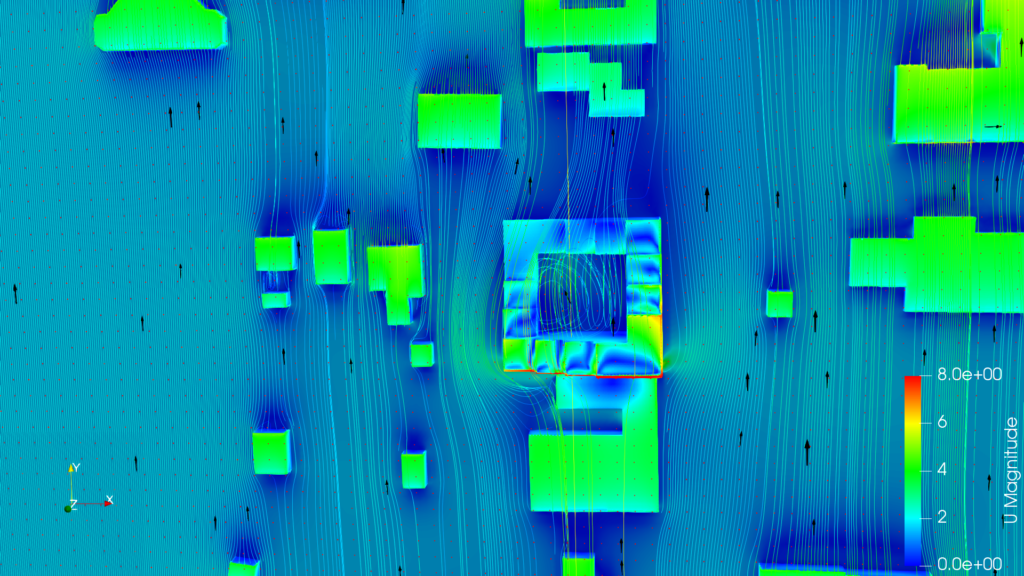
Analysis for wind was done using Butterfly that runs “computational fluid dynamic (CFD) simulations using OpenFOAM.” Each simulation was ran with 12 cores for more than twenty hours. The images below were created in Paraview. While visually interesting and useful, the amount of computational power and time used to create these studies do not allow many iterations to be tested. That is unfortunate as early in the project is when these tools could shape the momentum of where the project should go.
InFraReD
A faster tool to analyze the wind is InFraRed. Simulations were done from within Grasshopper3D in seconds. This faster processing time allowed different design iterations to be tested. One limiting factor was that InFraRed runs in 2.5D which to say that it cannot analyze space under a cantilever or overhang.
Use in Studio Project
These methods were used to analyze our studio project in creating a mesh constraint to contain a stochastic aggregation. Studies were done for total radiation and thermal comfort.
