AIR COMFORT
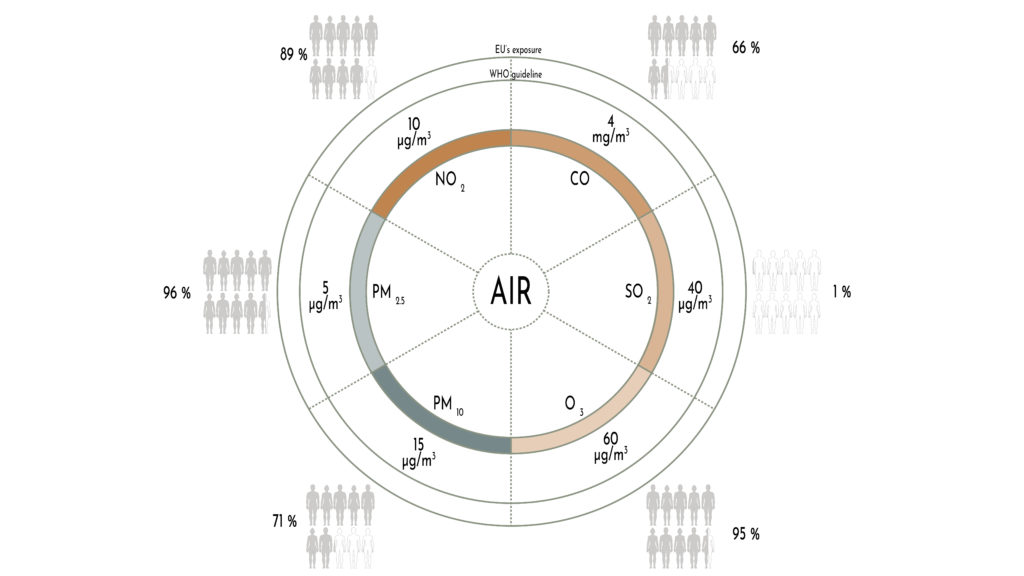
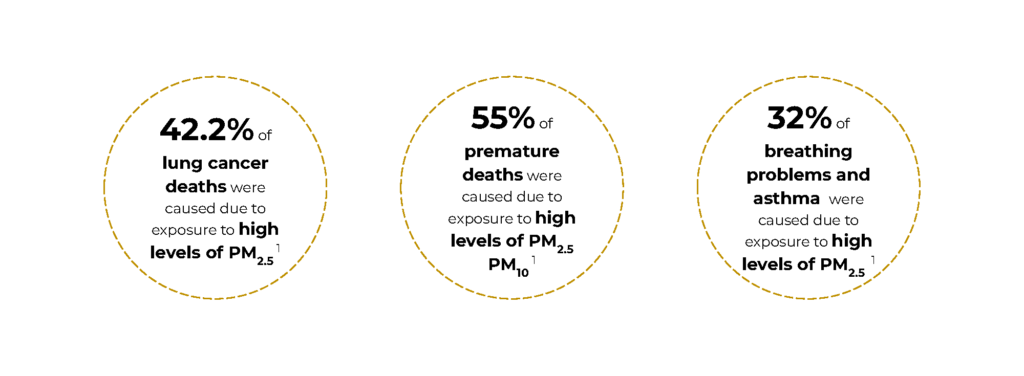
The air comfort depends on the gases and particulate matters in the air. The gases consist of nitrogen dioxide, carbon monoxide, sulphur dioxide and ozone. As well as the gases there are particulate matters in air which are categorised depending on their diameter. The main categories are the PM2.5 and PM10.
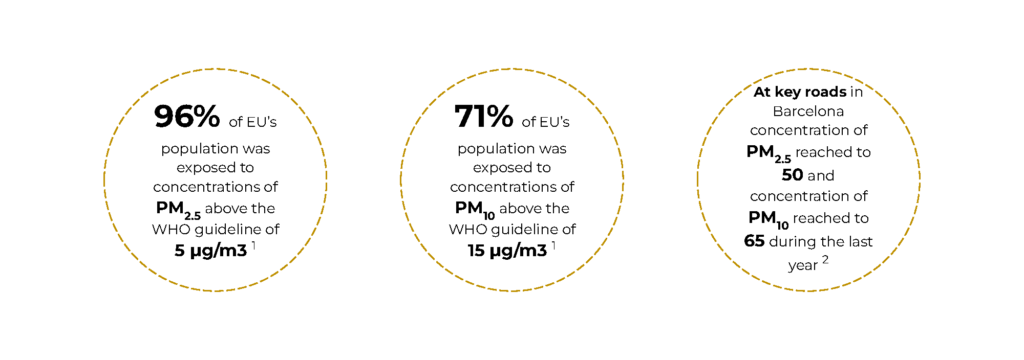
In 2021 WHO published a guideline on what the level of these particulate matters and gases in air should be
The European Environment Agency published EU populations who are being exposed to higher levels of pollutants. 96 % of the people are exposed to a higher level of pm 2.5 and 71% are exposed to pm10.
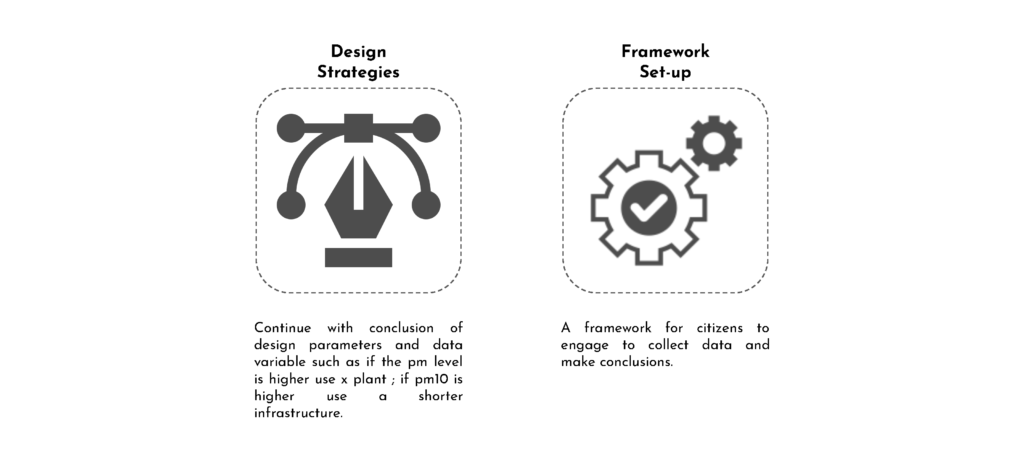
FRAMEWORK
PARTICULATE MATTER COMPOSITION
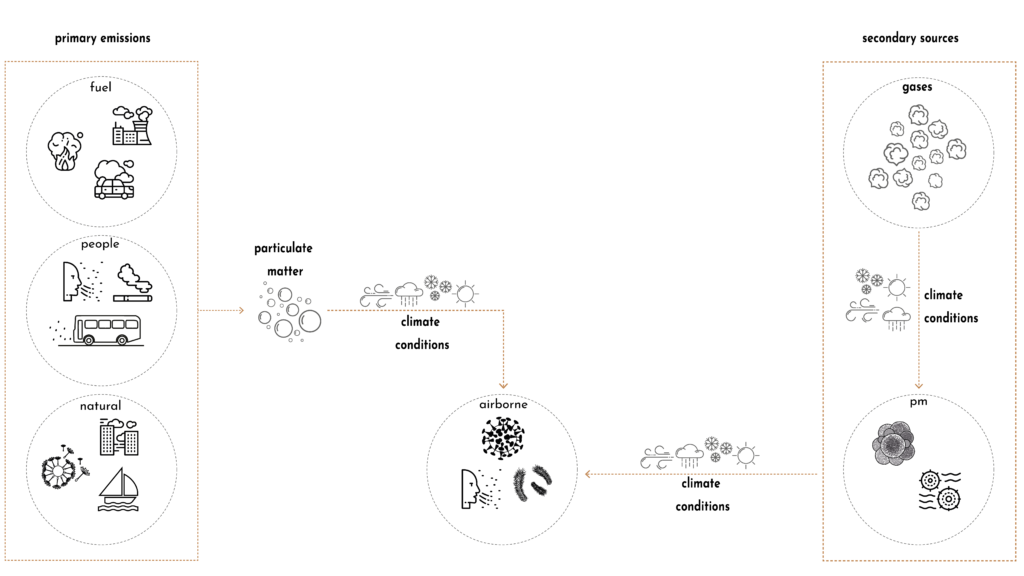
The composition of particulate matters is also an important factor to consider and the physical and chemical characteristics of the PM vary depending on the location and source of emission. The primary emissions can be from both natural and man-made sources. The natural ones include wind-blown dust, sea salt, pollens, soil particles, dust from the mountain. Manmade sources constitute of fossil fuel combustion (especially in vehicles and power plants), industrial processes (producing metals, cement, lime and chemicals), construction work, quarrying and mining activities, cigarette smoking and wood stove burning, and the port.
As well as the particulate matters from these primary sources there are gasses produced which, after climate conditions such as rain, snow or the temperature, via condensation they solidify into particulate matters and airborne micro-organisms.
Air-borne micro-organism are a vital component of particulate matters as they spread in the atmosphere by attaching to a particulate matter and they have a vital role in health impacts, atmospheric chemistry and eco-system interactions.
FRAMEWORK
What is currently being done in Barcelona?
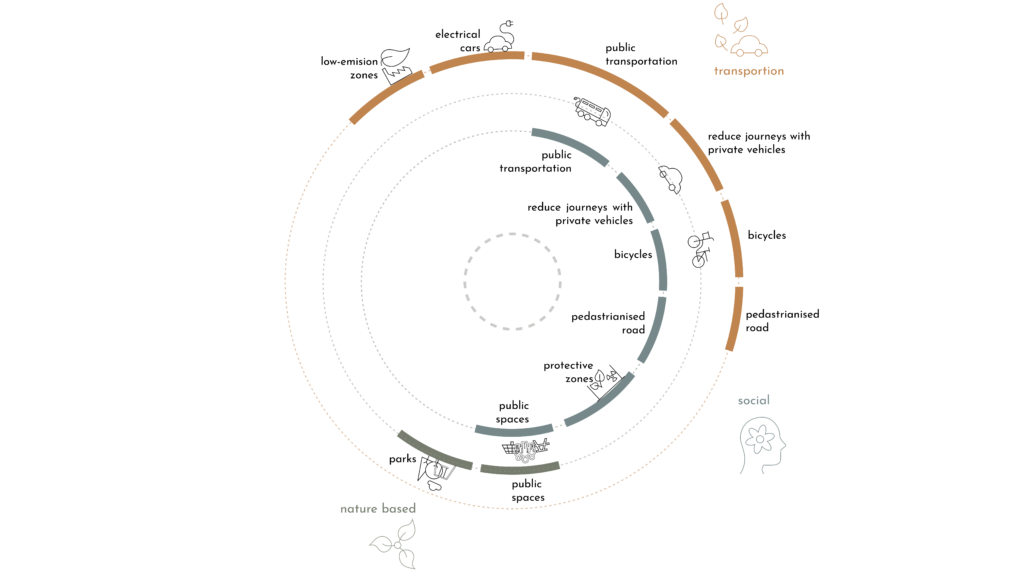
In this regard and as a part of the European Green Deal, to make a clean climate in Europe by 2050, there are several actions taken to reduce the concentration of particles in air. I categorised these measures into transportation, social and nature-based solutions. According to the measures published by Barcelona City Council, the main focus is to increase the use of public transport, electric based transportation, introduce more pedestrian only streets and promoting low-emission zone in Barcelona’s key points so the main measure deals with reducing the primary emissions of PM and these also include social aspects such as protective zones, encouraging citizens to chose more electric-based vehicles as well as reduce number of journeys with private vehicles. However, there aren’t many measures with nature-based solutions, to capture the existing PM or re-metabolising the PM.
Vegetation has a key role in controlling the density of molecules in the air however currently there is a lack of nature based solutions to tackle particulate matter concentration in cities. How can we use the capabilities of nature to control the levels of particulate matter in our cities?
VEGETATION

Vegetation can control the density of the particles in the air is by using them as a nutrient. Although vegetations also emit VOCs which are still particles they get into the loop of becoming a nutrient again.
THESIS STATEMENT
Rapid development in cities has led to an uncontrolled densification resulting in inadequate comfort level in cities due to low air quality caused by traffic as well as other natural emissions. “AIReclaim” is the exploration of a framework to measure particulate matter concentrations, capture and re-metabolise these via plant leaves. The collection of data will form a series of design strategies to be adapted to different urban environmental conditions.
METHODOLOGY
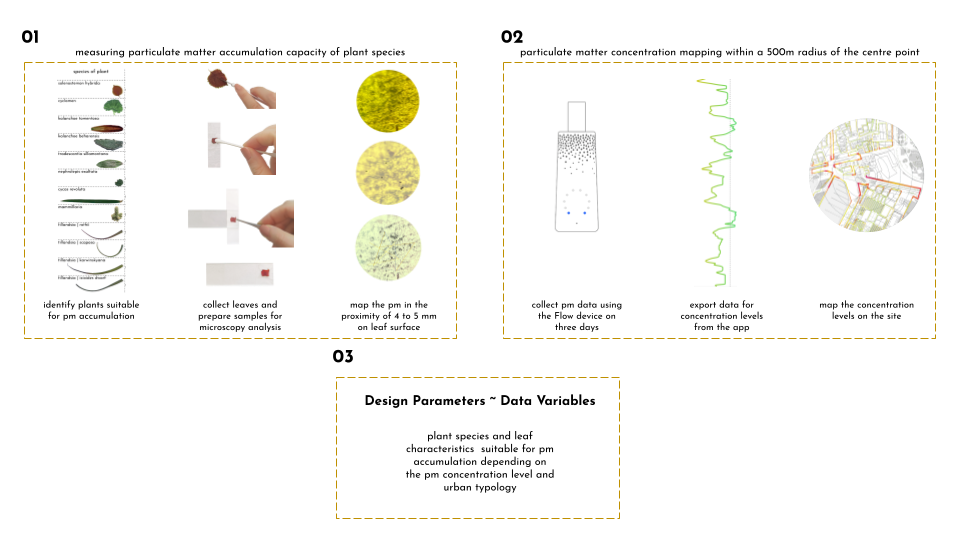
STEP 01 | LEAF PM ACCUMULATION OBSERVATION
Leaf Factors affecting Phytoremediation
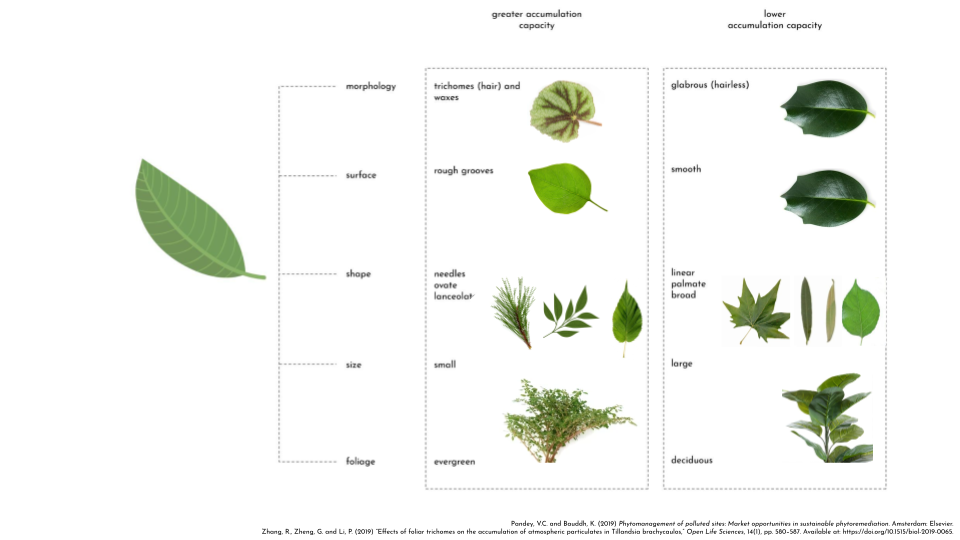
What factors of the leaf impact the accumulation capacity?
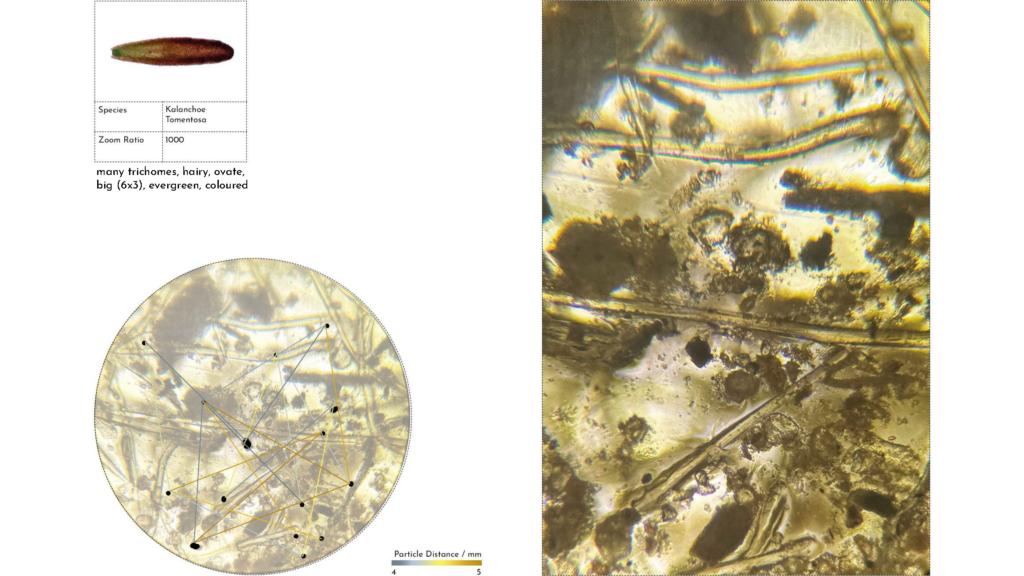
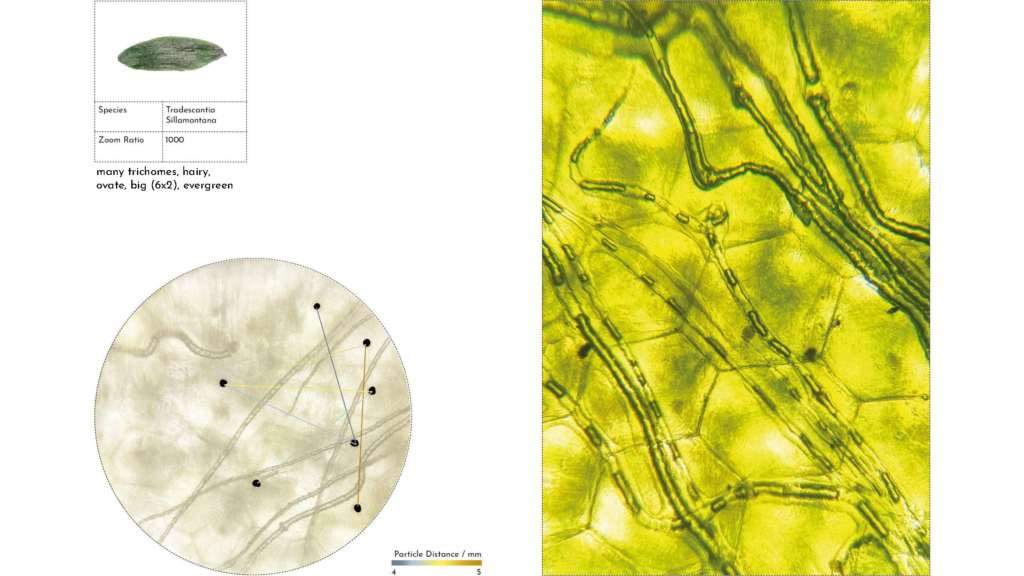
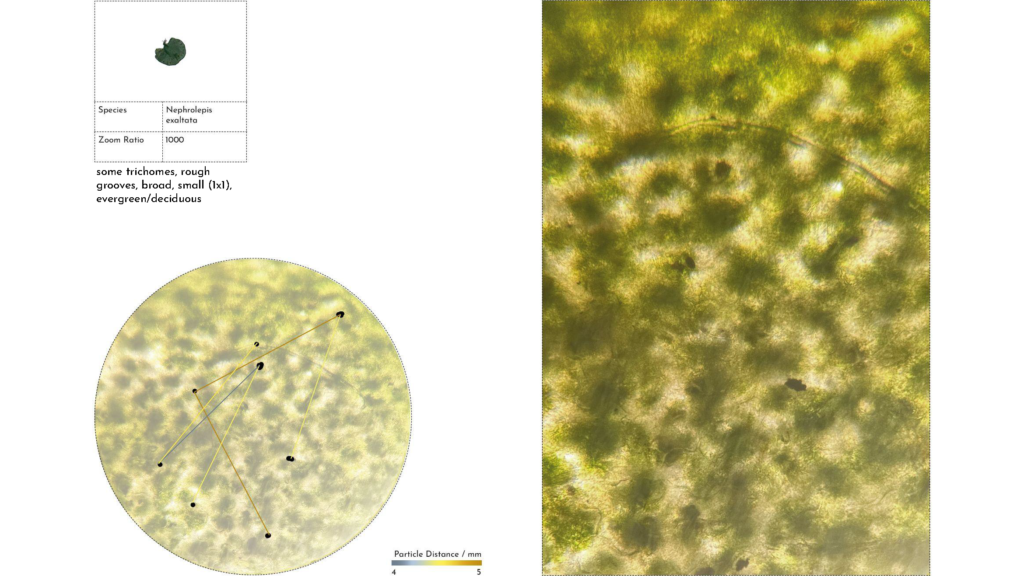
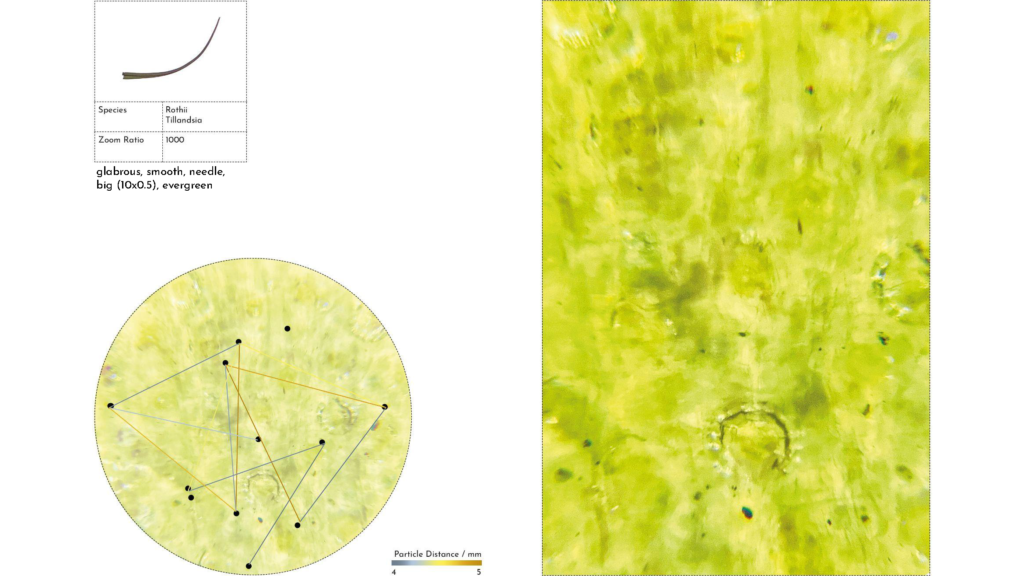
The percentage of trichomes available on the leaf, type of pubescence (hairs), veins and epicuticular wax have an impact on the accumulation capacity of particulate matter by the leaf. As well as the leaf size and shape, leaves with a spiky shape, small but many numbers of leaves have a greater accumulation.
Selection of Plants

Measuring PM Accumulation
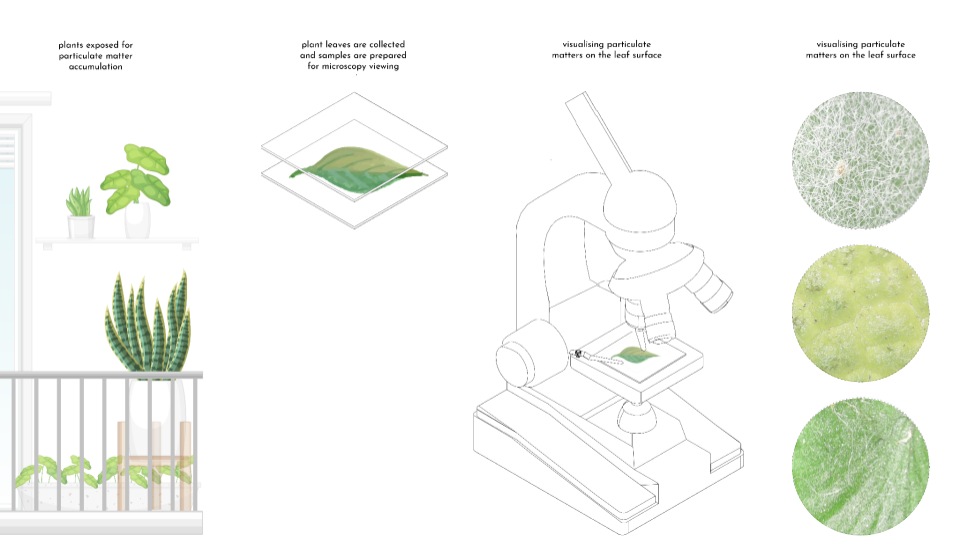
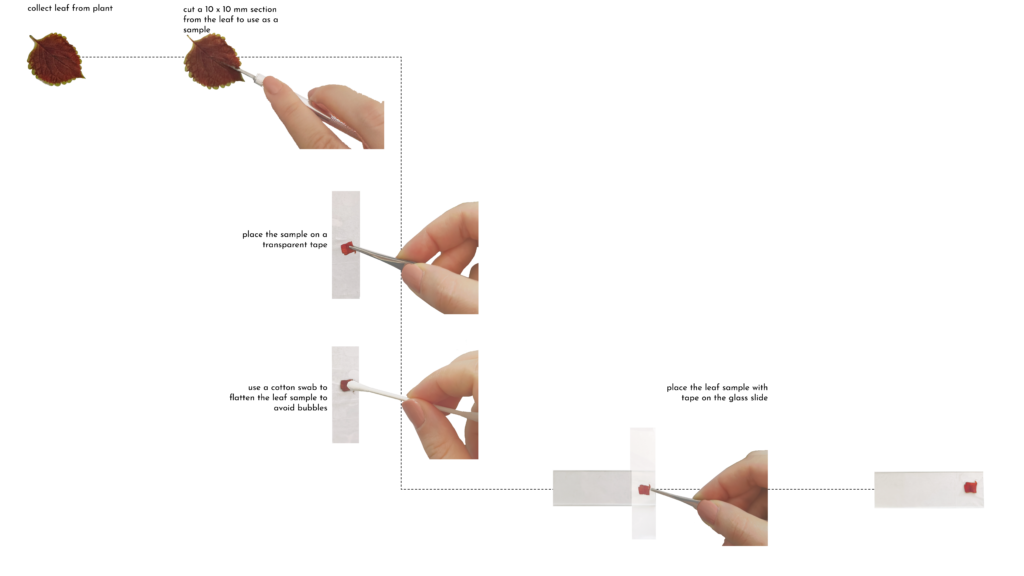
Preparing a Sample
Images from the Microscope


STEP 02 | PM MAPPING
Path walked on three different days, 25th, 27th and 29th January, starting from the centre.
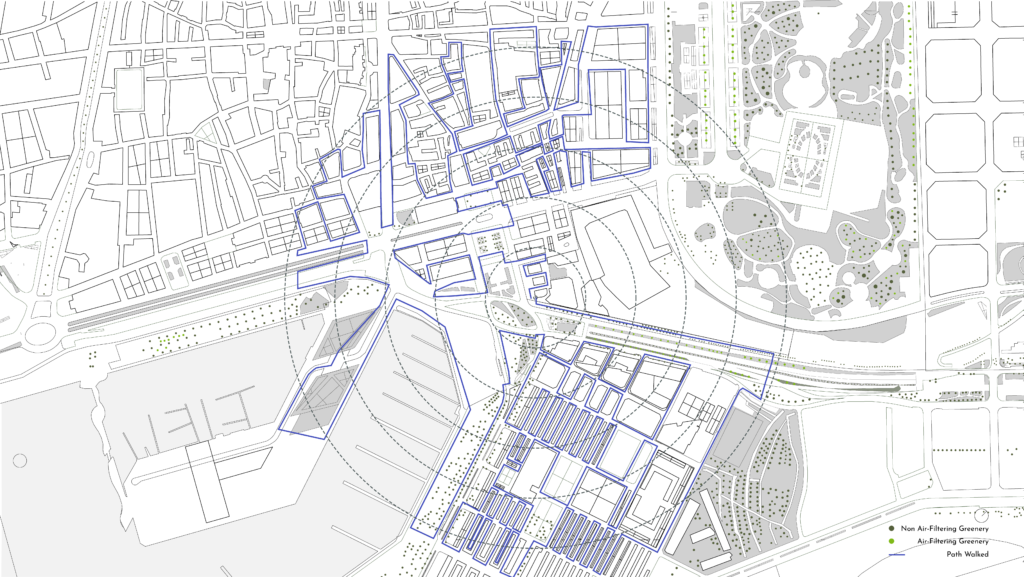
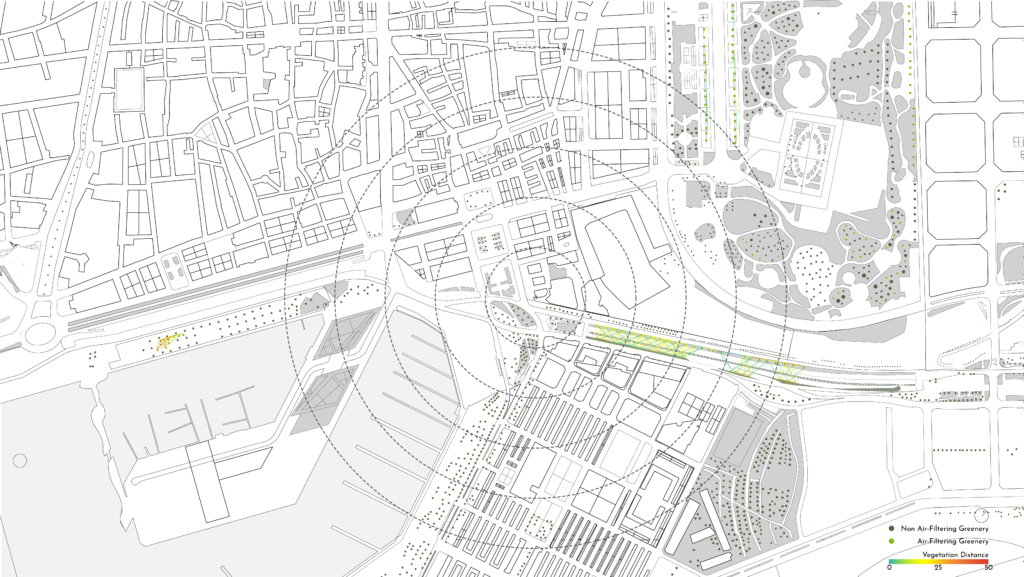
Greenery within the 500m parameter to the centre are plotted and the ones within a proximity of 50m from each other are connected.
Greenery with air filtering leaf characteristics within the 500m parameter to the centre are plotted and the ones within a proximity of 50m from each other are connected.
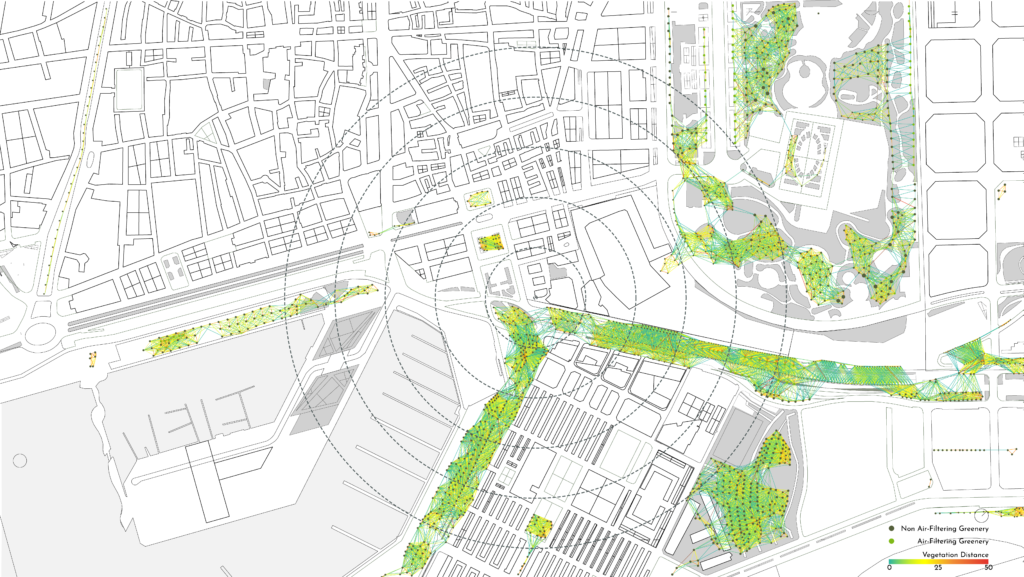
PM Levels on 25th of January
PM Levels on 27th of January

PM Levels on 29th of January

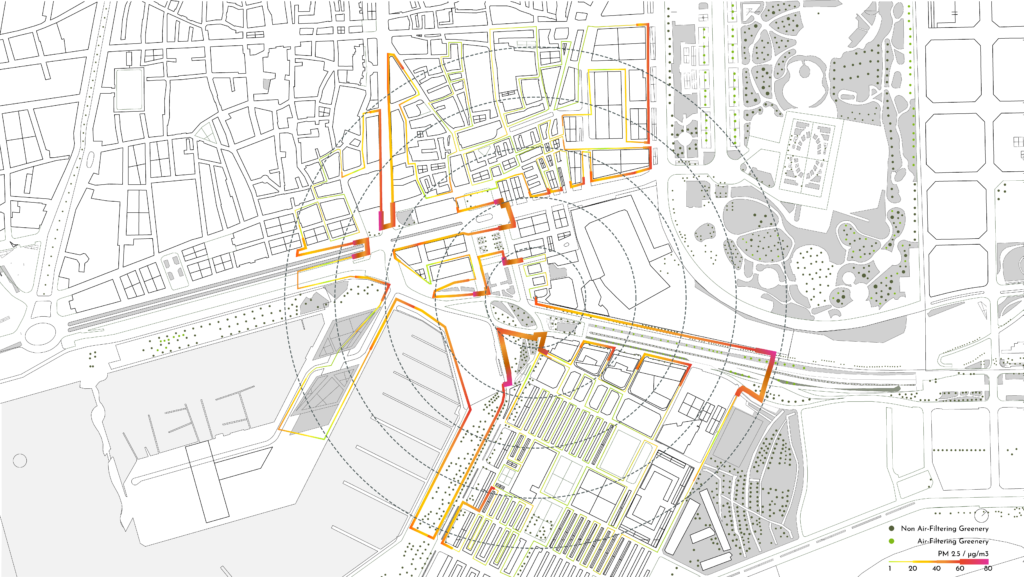
PM Levels on 29th of January and Air Filtering Characteristics Greenery Mapped

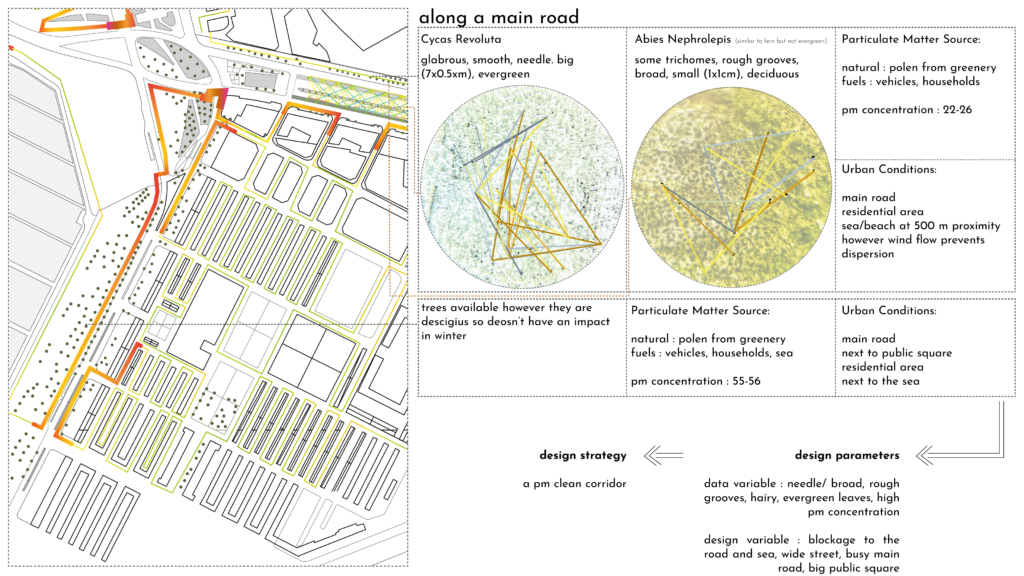
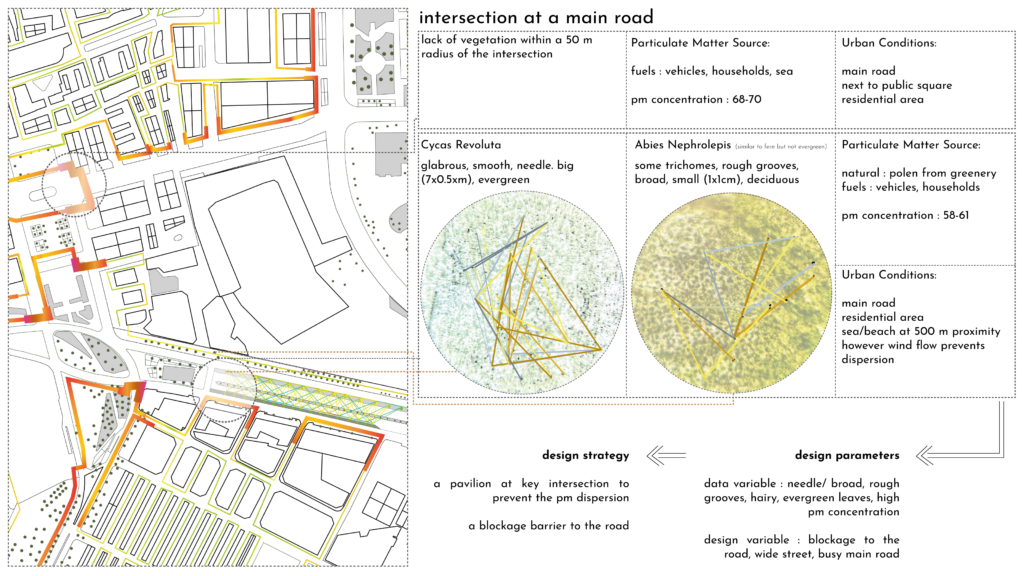
STEP 03 | EXTRACTING DESIGN PARAMETERS
NEXT