
Introduction: Airports, intricate systems encompassing numerous services and pathways within sprawling infrastructures, face the challenge of optimizing the flow towards departure gates. In this study, we delved into the possibility of filtering out non-essential activities and prioritizing efficient movement within airports. To gain insights, we focused on Oslo Gardermoen airport, a moderate-sized airport with a well-established layout and structure.
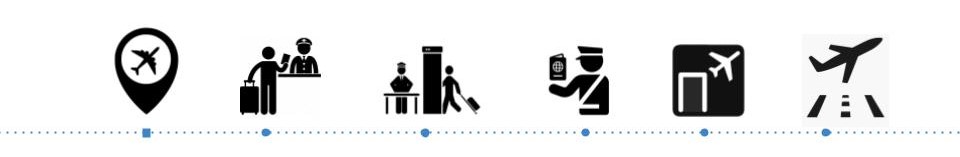
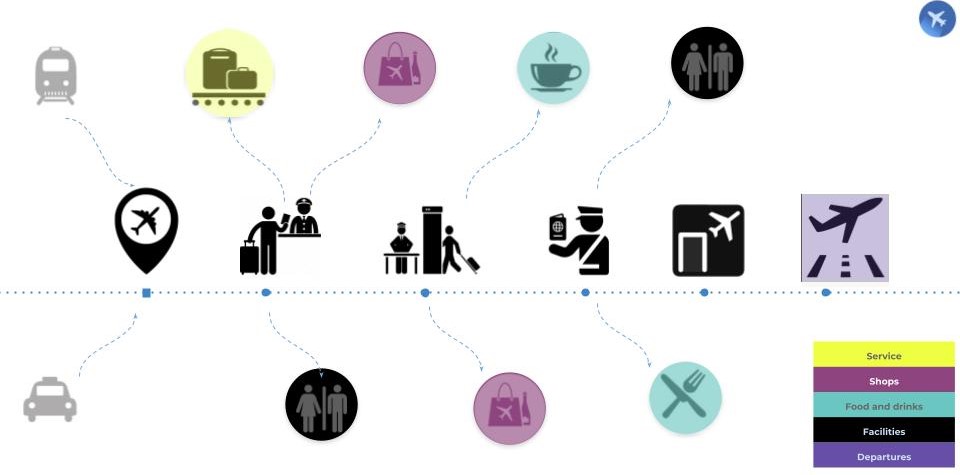
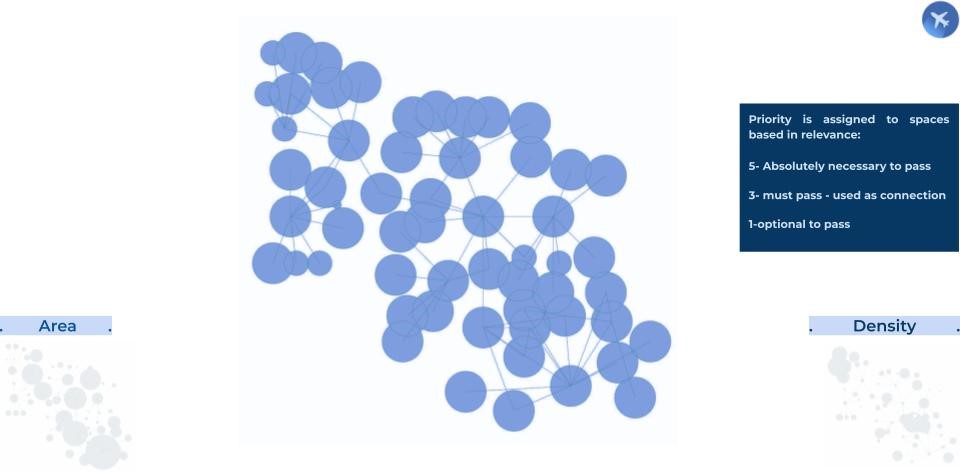
Key Points and Mapping: Within the airport, certain areas attract significant visitor attention, leading to potential bottlenecks. Strategically placed first checkpoints ensure essential stops throughout the airport journey, including security checks and passport control. Additionally, secondary points consist of services and facilities like shops and food courts. The subsequent connections between zones and the final call at the gates complete the airport flow. By mapping these points, we created a network map based on their relationships.

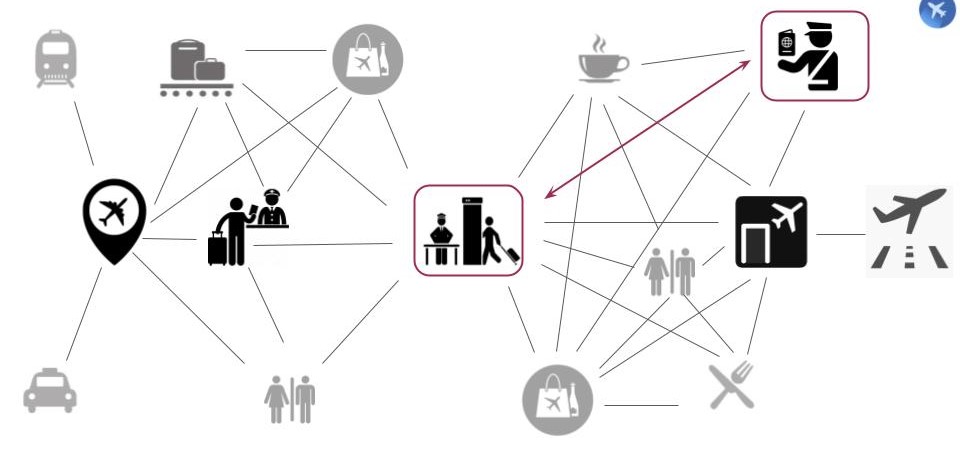
Assigning Features and Priorities: To facilitate analysis, each key point was transformed into a node within a graph. The area of each node was assigned as a feature based on the distribution of respective zone boundaries within the airport’s departure terminal. Furthermore, nodes were prioritized according to their importance, with ratings ranging from 5 (essential) to 1 (optional). Density calculations were conducted to determine the number of people per square meter within each node.
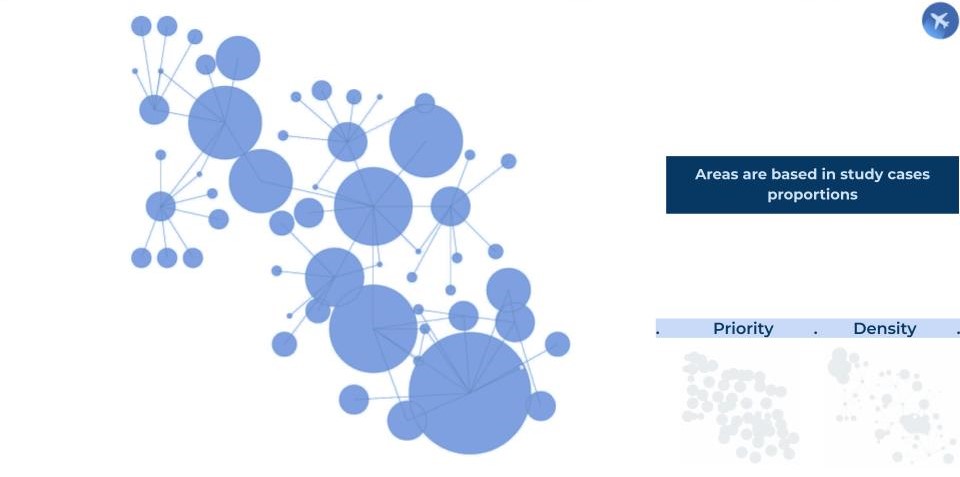
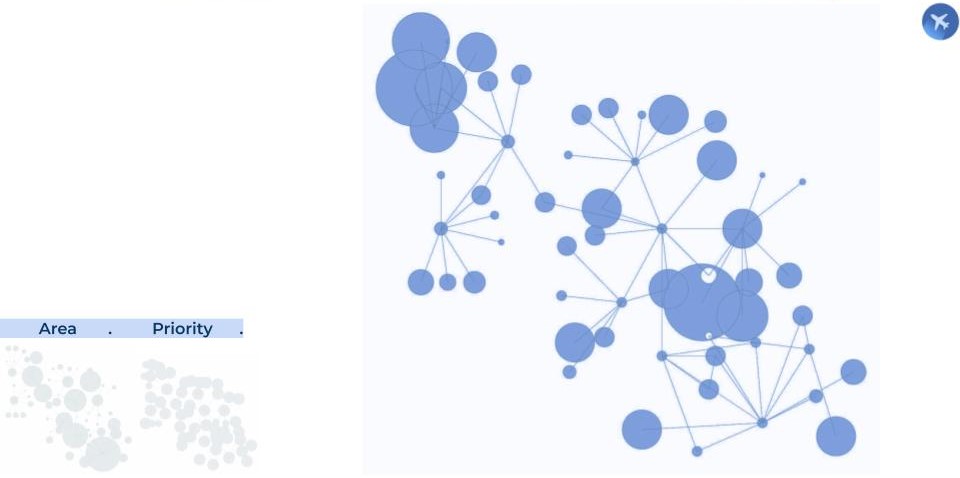
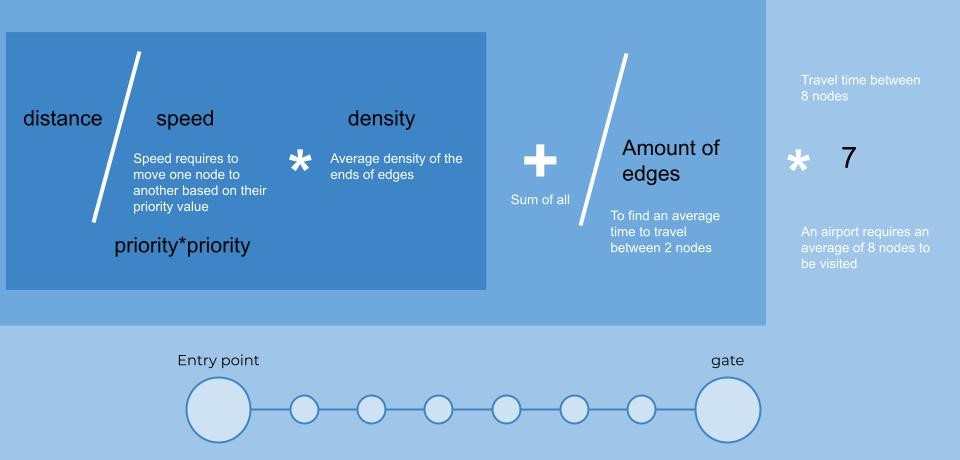
Calculating Travel Time: Determining travel time involved measuring the distance between nodes and assigning it to the connecting edges. The thickness of the line representing an edge represented the relative length relationship within the graph. Travel time from the entrance to the gate was calculated by dividing the distance between nodes by the speed. The average density of nodes at the end of edges influenced the overall travel time calculation. Adjustments were made to account for the number of nodes that must be traversed, considering at least 8 nodes from the access area to the gate.

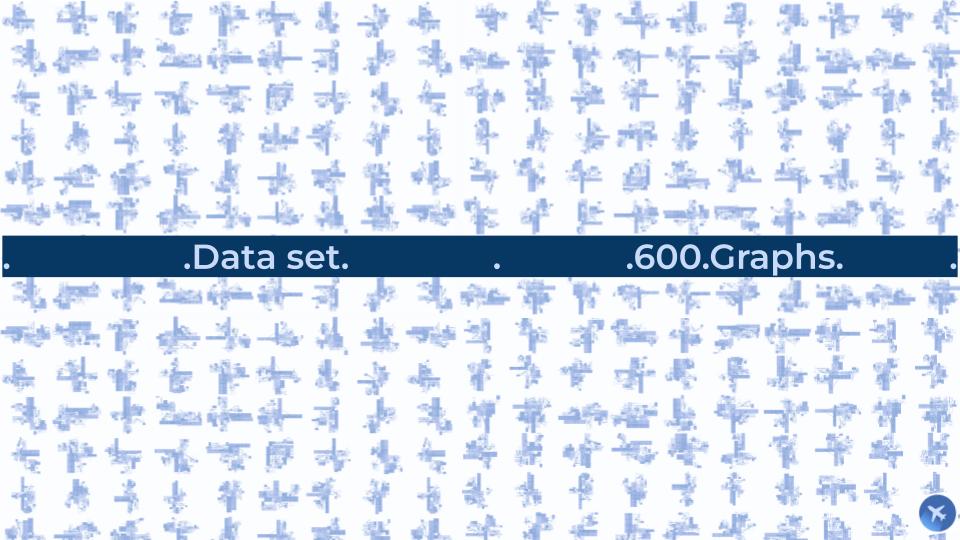
Generating and Analyzing Graphs: A plugin was utilized to generate a dataset of airports. The iteration process involved defining nodes, areas, and connections using a seed value. As the iteration progressed, the size, location, and distances between nodes varied. Additionally, the number of visitors differed across each iteration. In the end, we generated 600 airport graphs, providing a diverse set of visual representations.

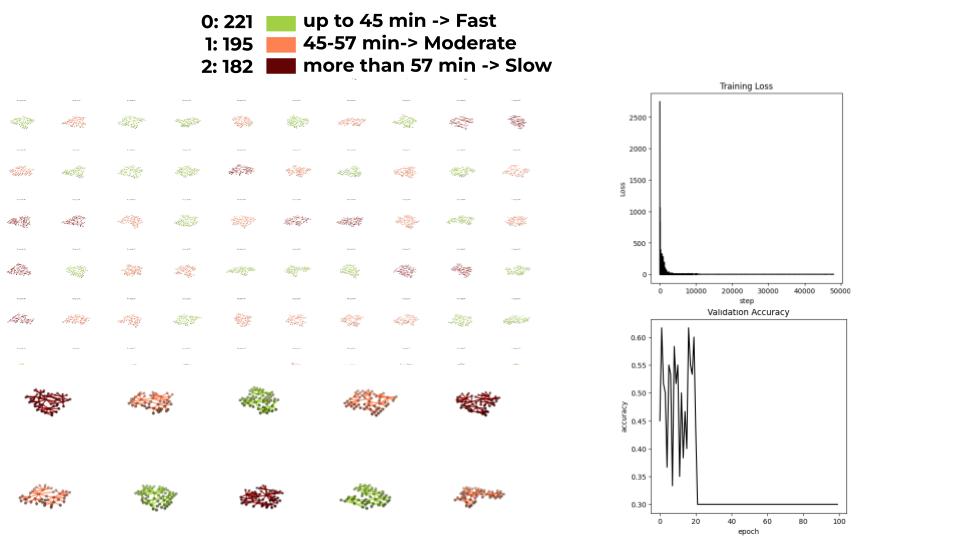
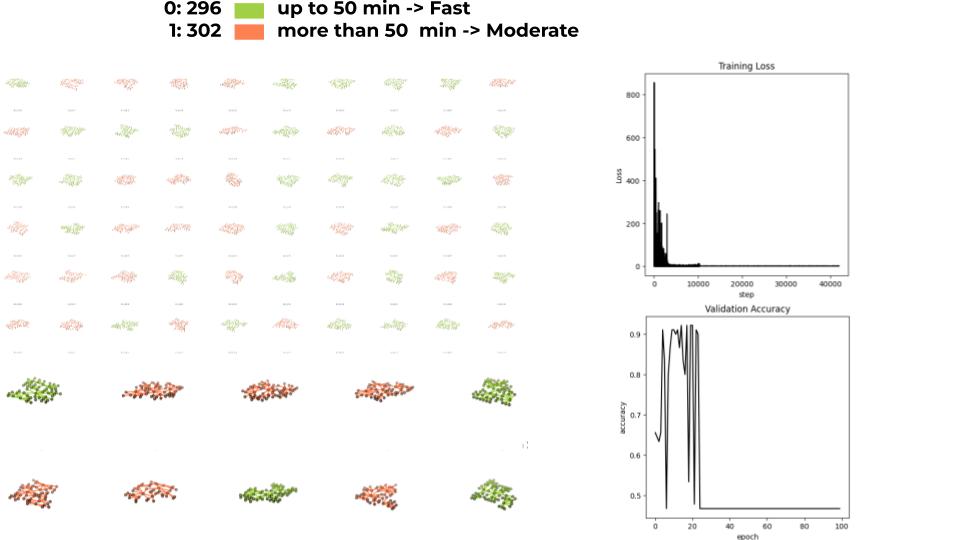
Graph Classification Challenges: We conducted graph classification for two scenarios: 3 classes and 2 classes. In the 3-class classification, travel times were categorized as fast (up to 45 minutes), moderate (45-57 minutes), and slow (more than 57 minutes). However, our dataset proved unsuitable for accurate 3-class classification based on the observed accuracy graph. Later, we divided travel times into two categories: fast (up to 50 minutes) and moderate (more than 50 minutes). Despite multiple attempts to adjust parameters, we did not achieve satisfactory results in accurately categorizing the graphs.
Future Directions: To improve accuracy, future efforts should focus on expanding the dataset size and refining density calculations in relation to travel time. It would be beneficial to increase the model’s complexity to cover the entire airport and explore similar complex facilities such as hospitals. Additionally, integrating the training process into the grasshopper environment and observing the dynamic changes in airport classification through varying plugin iterations hold potential for further research.
Conclusion: Analyzing pathways and prioritization within airports offers a pathway to enhancing efficiency. Our study, centered around Oslo Gardermoen airport, unveiled key points, mapped relationships, and calculated travel time. Although graph classification challenges were encountered, these findings pave the way for future improvements in accurately categorizing airports. As we continue refining our methodology, the ultimate goal remains to create seamless and efficient airport experiences for travelers worldwide.
