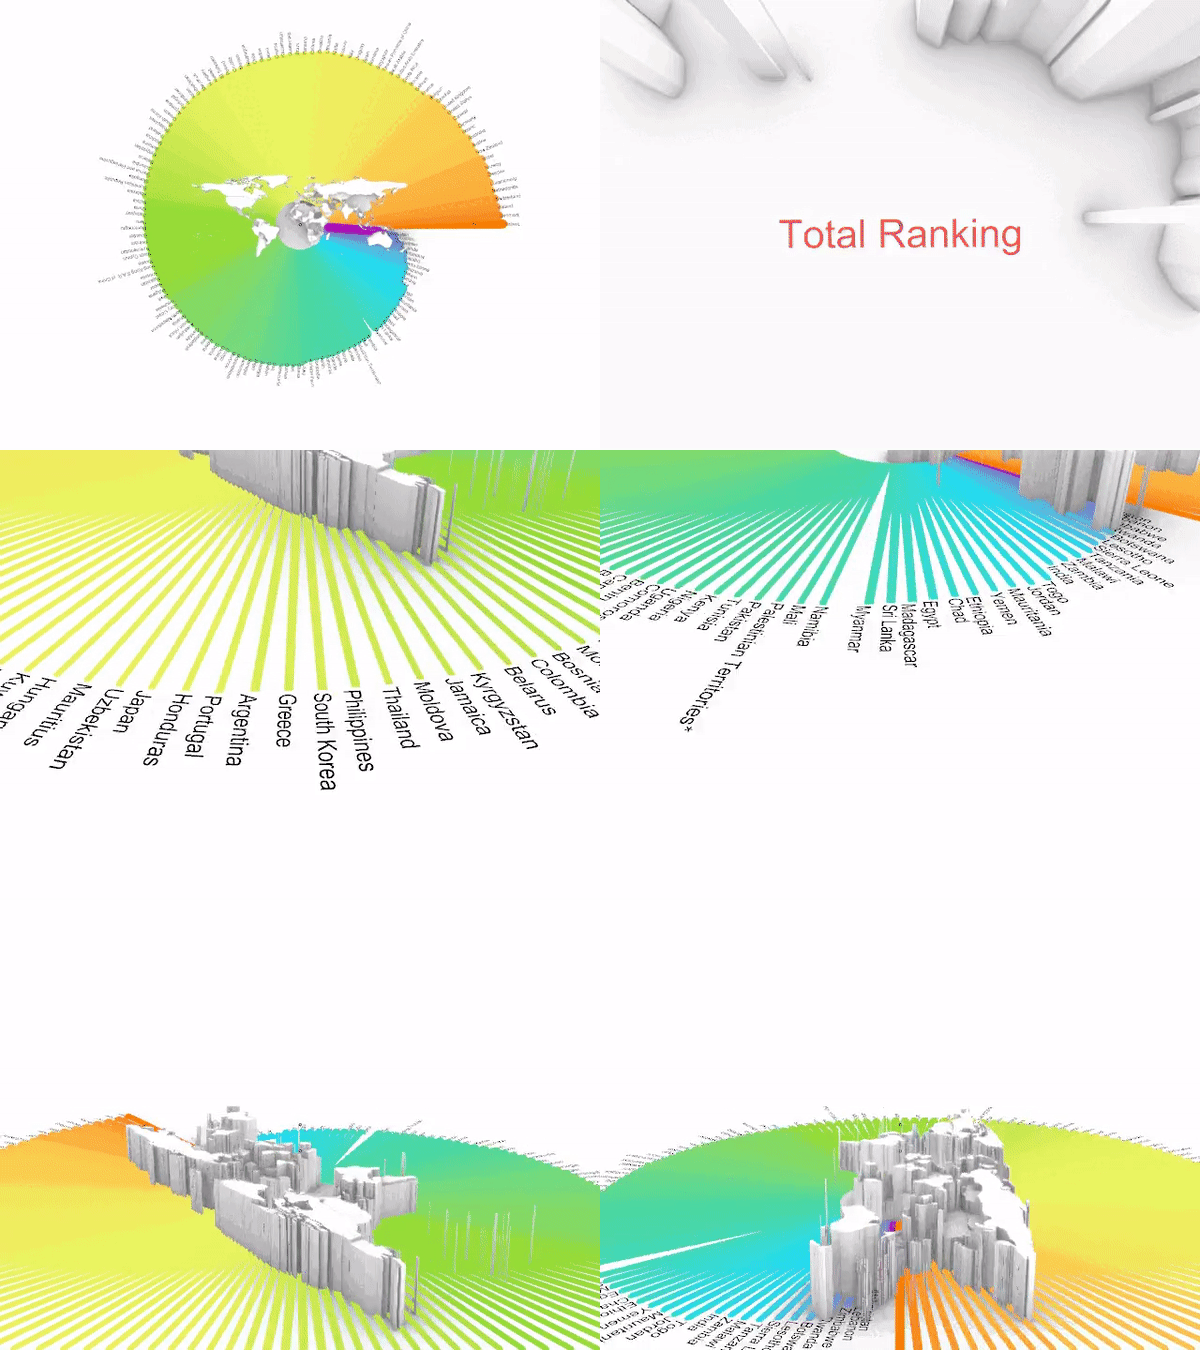
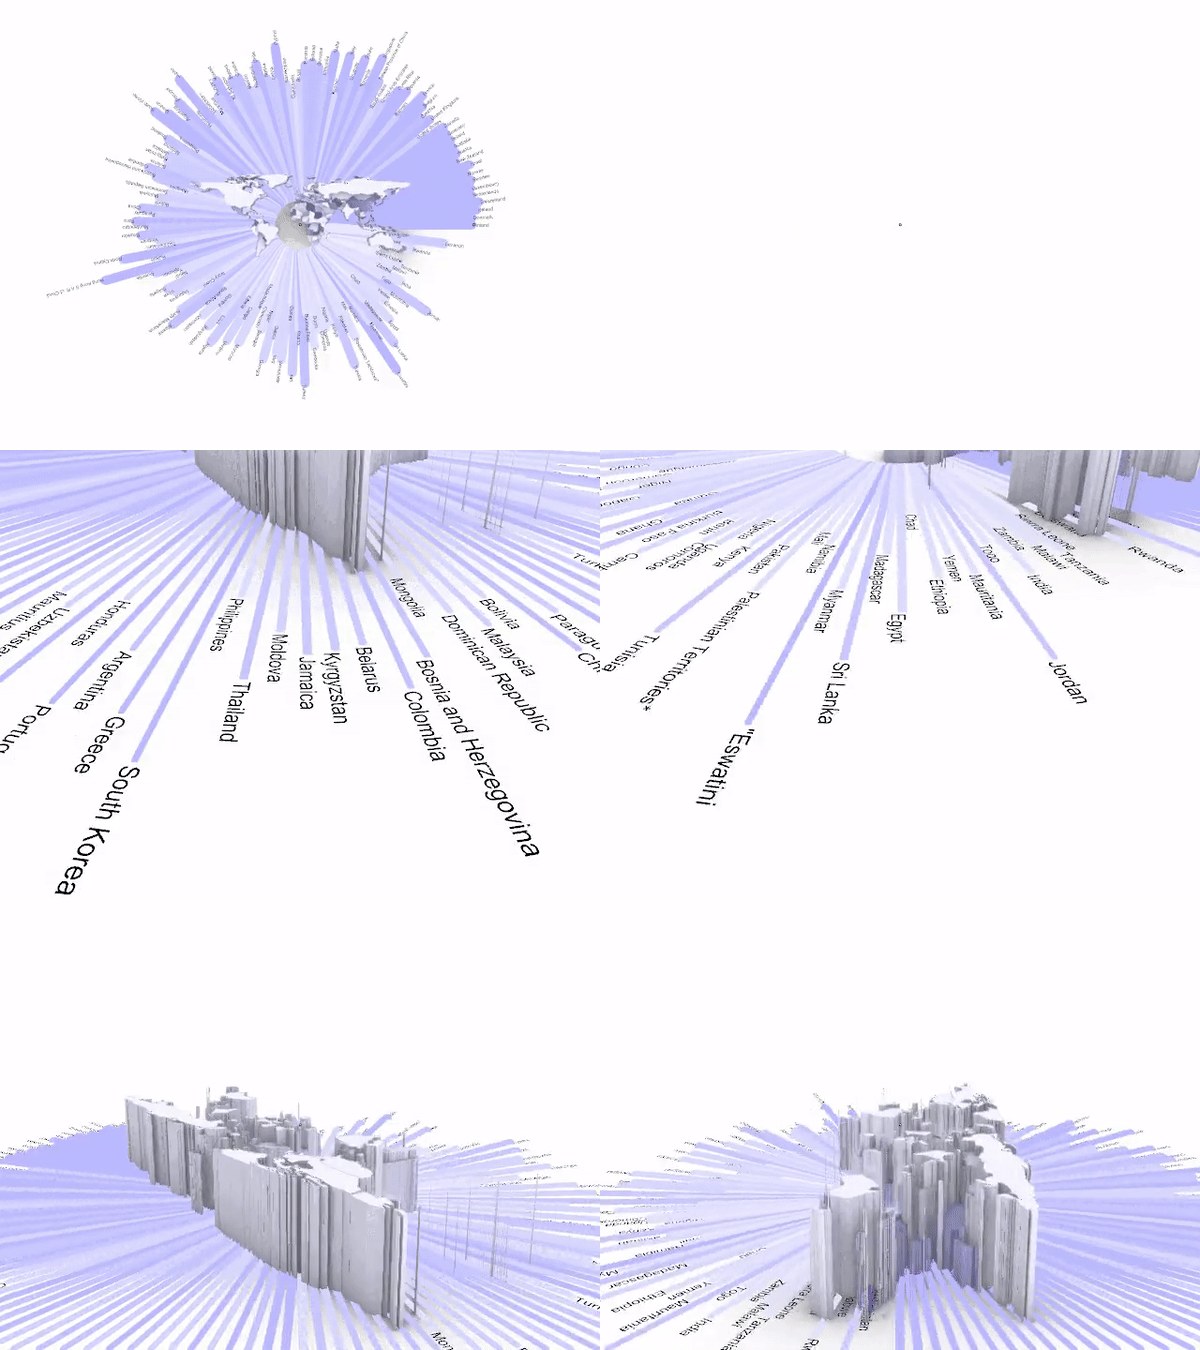
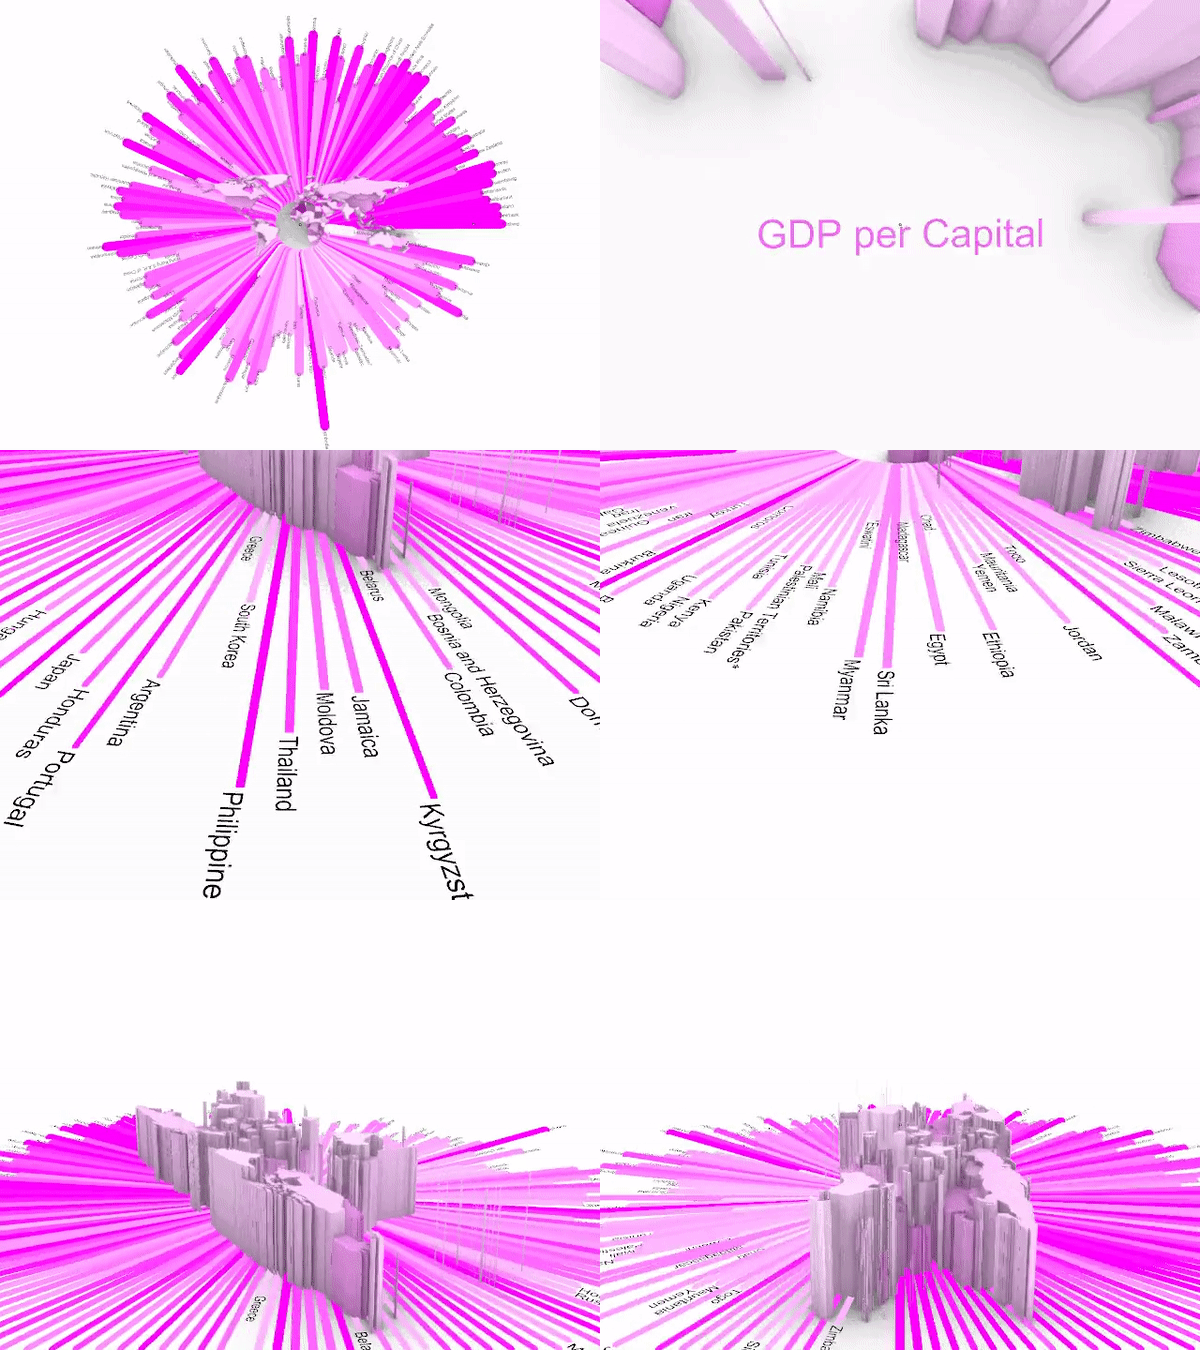
Data visualization “World Happiness Report up to 2022”

“Are you Happy?”
“Yes! I am!!” You may answer immediately,
But I don’t answer like you.
Of course, I’m not unhappy but, “Happy??”
Why don’t I say Yes? Is this due to national character?
If I compare each country on the map, I may know some hints.
Data quote: Kaggle “World Happiness Report up to 2022”
Top score

Social Support

Health Life Expectancy

Generosity

GDP per Capital

Freedom

Corruption


