
Creating a Visual Medium for the Visualization of Urban Data


Using Cesium in Unity Engine for Geospatial Visualization
Cesium for Unity bridges 3D geospatial data with Unity’s real-time development environment, enabling developers to create immersive, real-world simulations and applications. By integrating high-accuracy global datasets, 3D Tiles, and dynamic data feeds, it provides a robust framework for urban planning, disaster response, and interactive experiences.
Benefits of Using Cesium for Real-Time Visualization
- Dynamic Data Integration
Cesium supports time-dynamic data formats like CZML and KML, enabling visualization of changing datasets such as drone flight paths, satellite orbits, or environmental changes over time. Developers can upload these datasets via Cesium ion and control playback speed and camera movements to analyze temporal trends effectively. - Global Geospatial Context
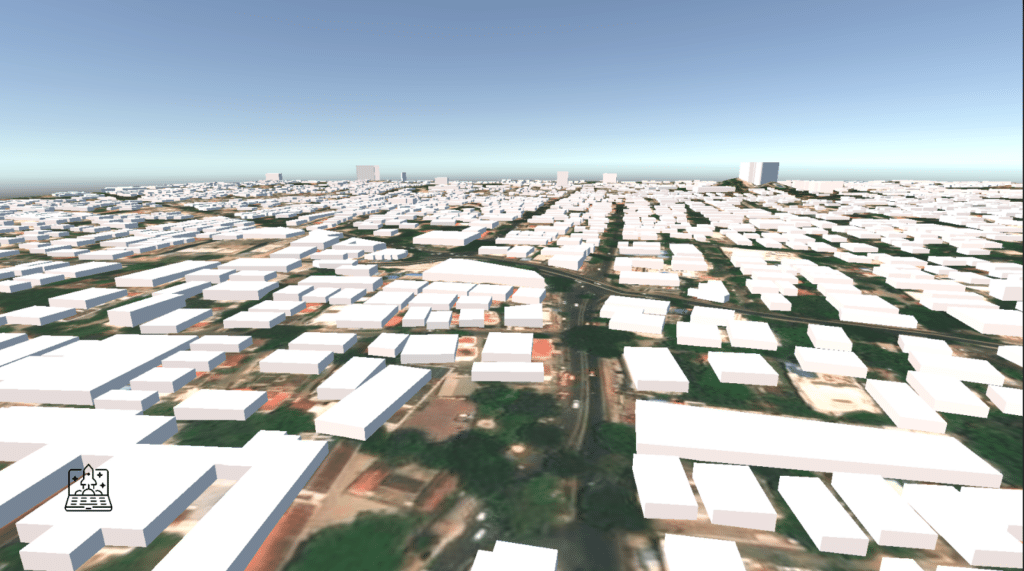
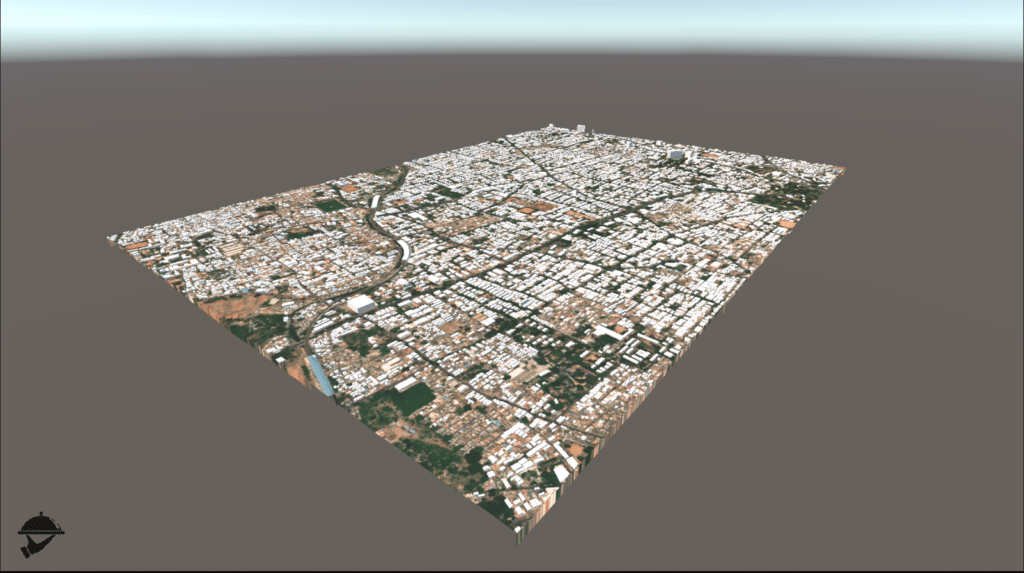
Cesium provides instant access to global datasets, including photogrammetry, terrain, and OpenStreetMap buildings. This allows Unity developers to place their simulations in accurate real-world locations with georeferencing capabilities - Optimized Performance
Cesium’s industry-leading 3D tiling pipelines transform large geospatial datasets into spatially indexed 3D Tiles that are streamed efficiently into Unity. This ensures smooth performance even with massive datasets - Interactive Storytelling
Tools like Cesium Stories enable developers to create annotated narratives around their data, making it easier to share insights with stakeholders or end-users. This feature is particularly useful for applications like urban planning or disaster response - Scalability Across Platforms
Cesium for Unity supports deployment on multiple platforms, including desktop, mobile, and VR environments. This versatility allows developers to create immersive experiences tailored to diverse audiences.
Features and Intended Use Case
The interactive buttons on the bottom left corner were meant to allow the user to select the typology of the restaurant based upon which the visualization of the map would change allowing the user to clearly visualize the parameters that are most important to the each restaurant typology.
On Hovering over the street network, each of the segments would get highlighted as well as display the characteristics of the street as well as the score for it, which is based on an underlaying algorithm. This is therefore connected to a database, from where it can be called to display the necessary data.
