
Introduction
Urban voids, or vacant spaces within a city, can occur due to various factors and circumstances. Here are some reasons why urban voids happen
- In areas where economic activity has declined, vacant lots or buildings may remain due to economic downturns, market fluctuations, or changes in industry.
- A large-scale redevelopment project often involves demolishing existing structures in order to make way for new developments, which can result in temporary urban voids during the construction phase.
- There are certain areas where development is hindered by zoning regulations, land use restrictions, and bureaucratic processes. It is possible for vacant spaces to emerge if the regulations are too restrictive or are not conducive to certain types of development, as developers may be discouraged from investing.
- Some neighborhoods can experience vacant spaces due to population shifts and changing demographics. Inner-city areas may experience a decrease in population density as people migrate from urban centers to suburbs, resulting in vacant buildings and lots.
- As a result of highway construction and major transportation infrastructure, neighborhoods can be physically separated, leaving vacant spaces behind. Due to the barriers created by transportation systems, it can be difficult to create these voids.
- Buildings and infrastructure can be severely damaged by natural disasters, such as floods, earthquakes, or fires. Urban voids can also occur when affected areas undergo no immediate reconstruction. Additionally, urban decay, where areas experience a decline in maintenance and investment, can contribute to the emergence of vacant spaces.
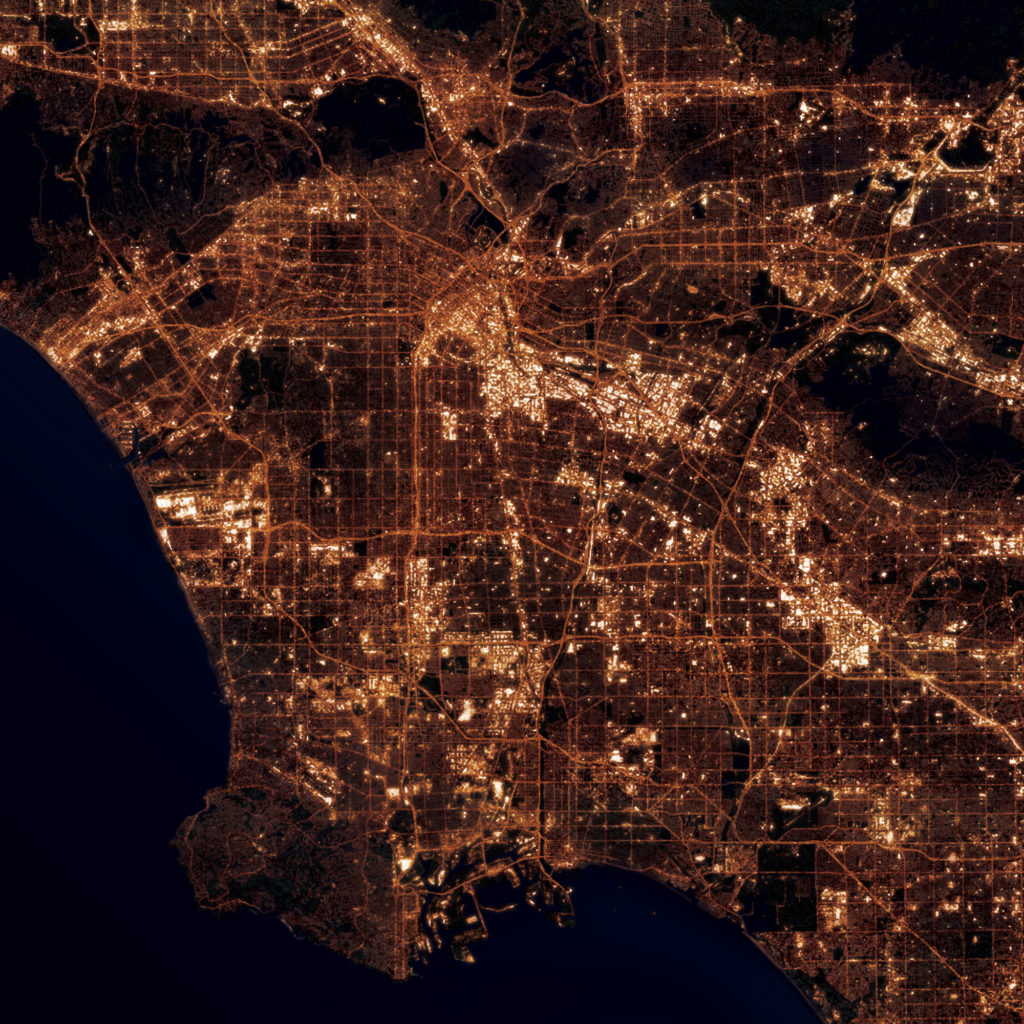
As part of the research, the city of Los Angeles was surveyed to create a dataset that could be analyzed. This dataset would provide an understanding of the urban voids as well as the possibility of utilizing and redeveloping those areas. We were attempting to provide a comprehensive picture of urban voids and their effects on the urban fabric as a whole.
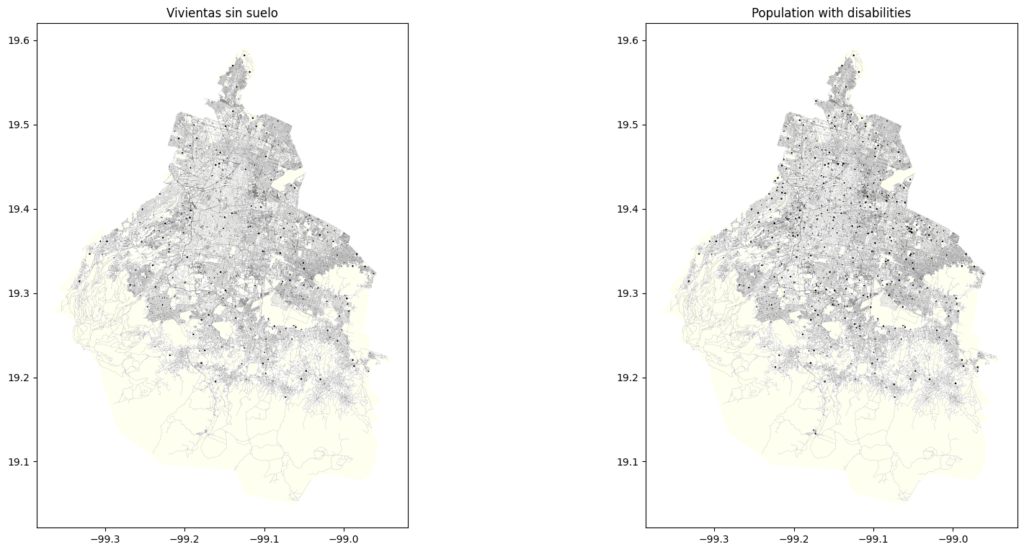
The use of machine learning techniques, such as GraphML, allows us to analyze the behavior of a city and how it responds to a specific target audience or object. For example, the following is a graph of Mexico City that shows nodes with information about the population with disabilities and housing.
DATA
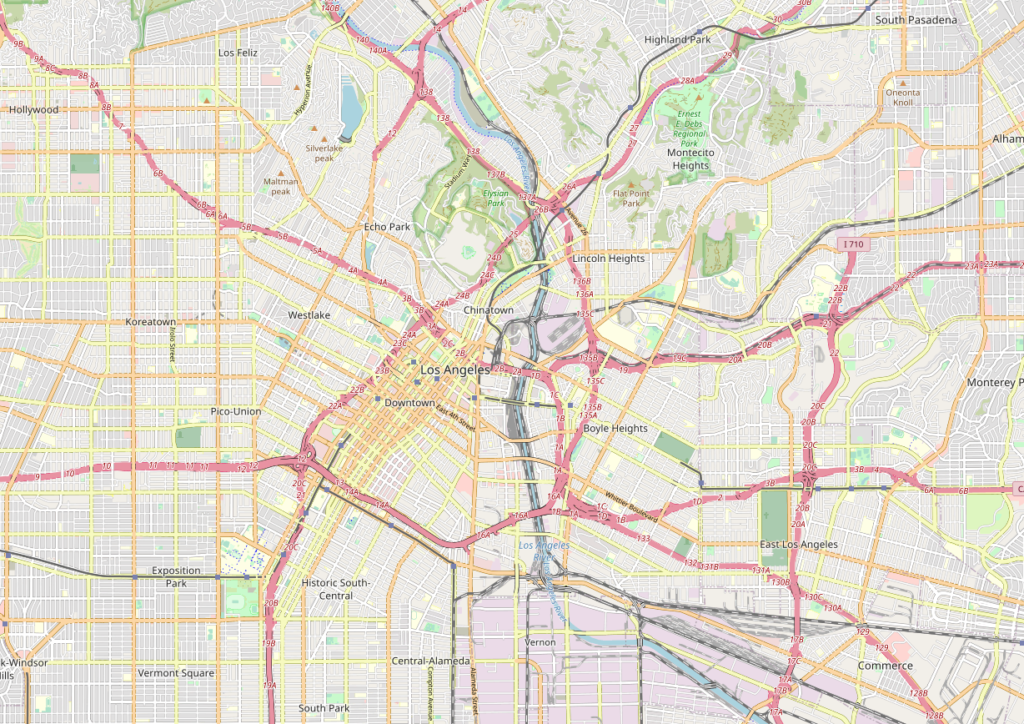
OpenStreetMap Data
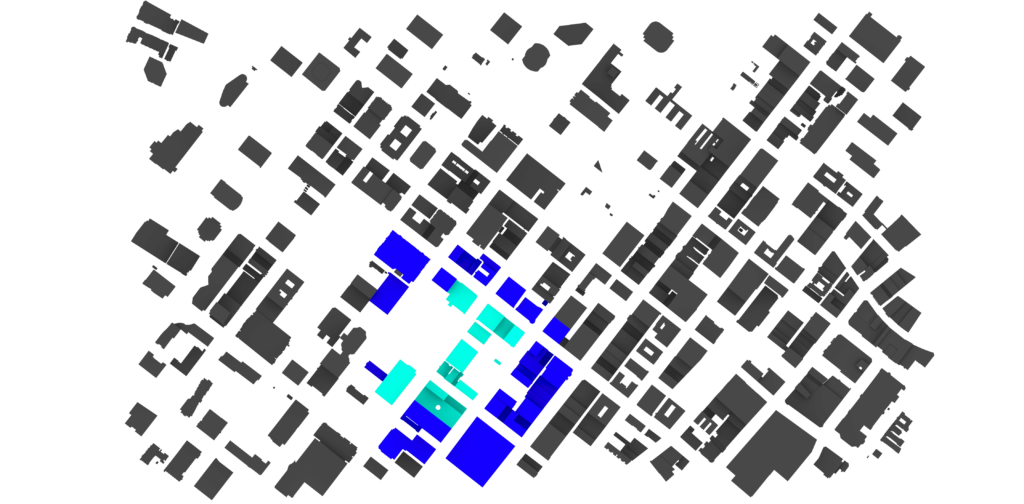
We utilized the extensive data available in OpenStreetMap, which provides comprehensive information about the road network, building footprints, and other urban features in Los Angeles.
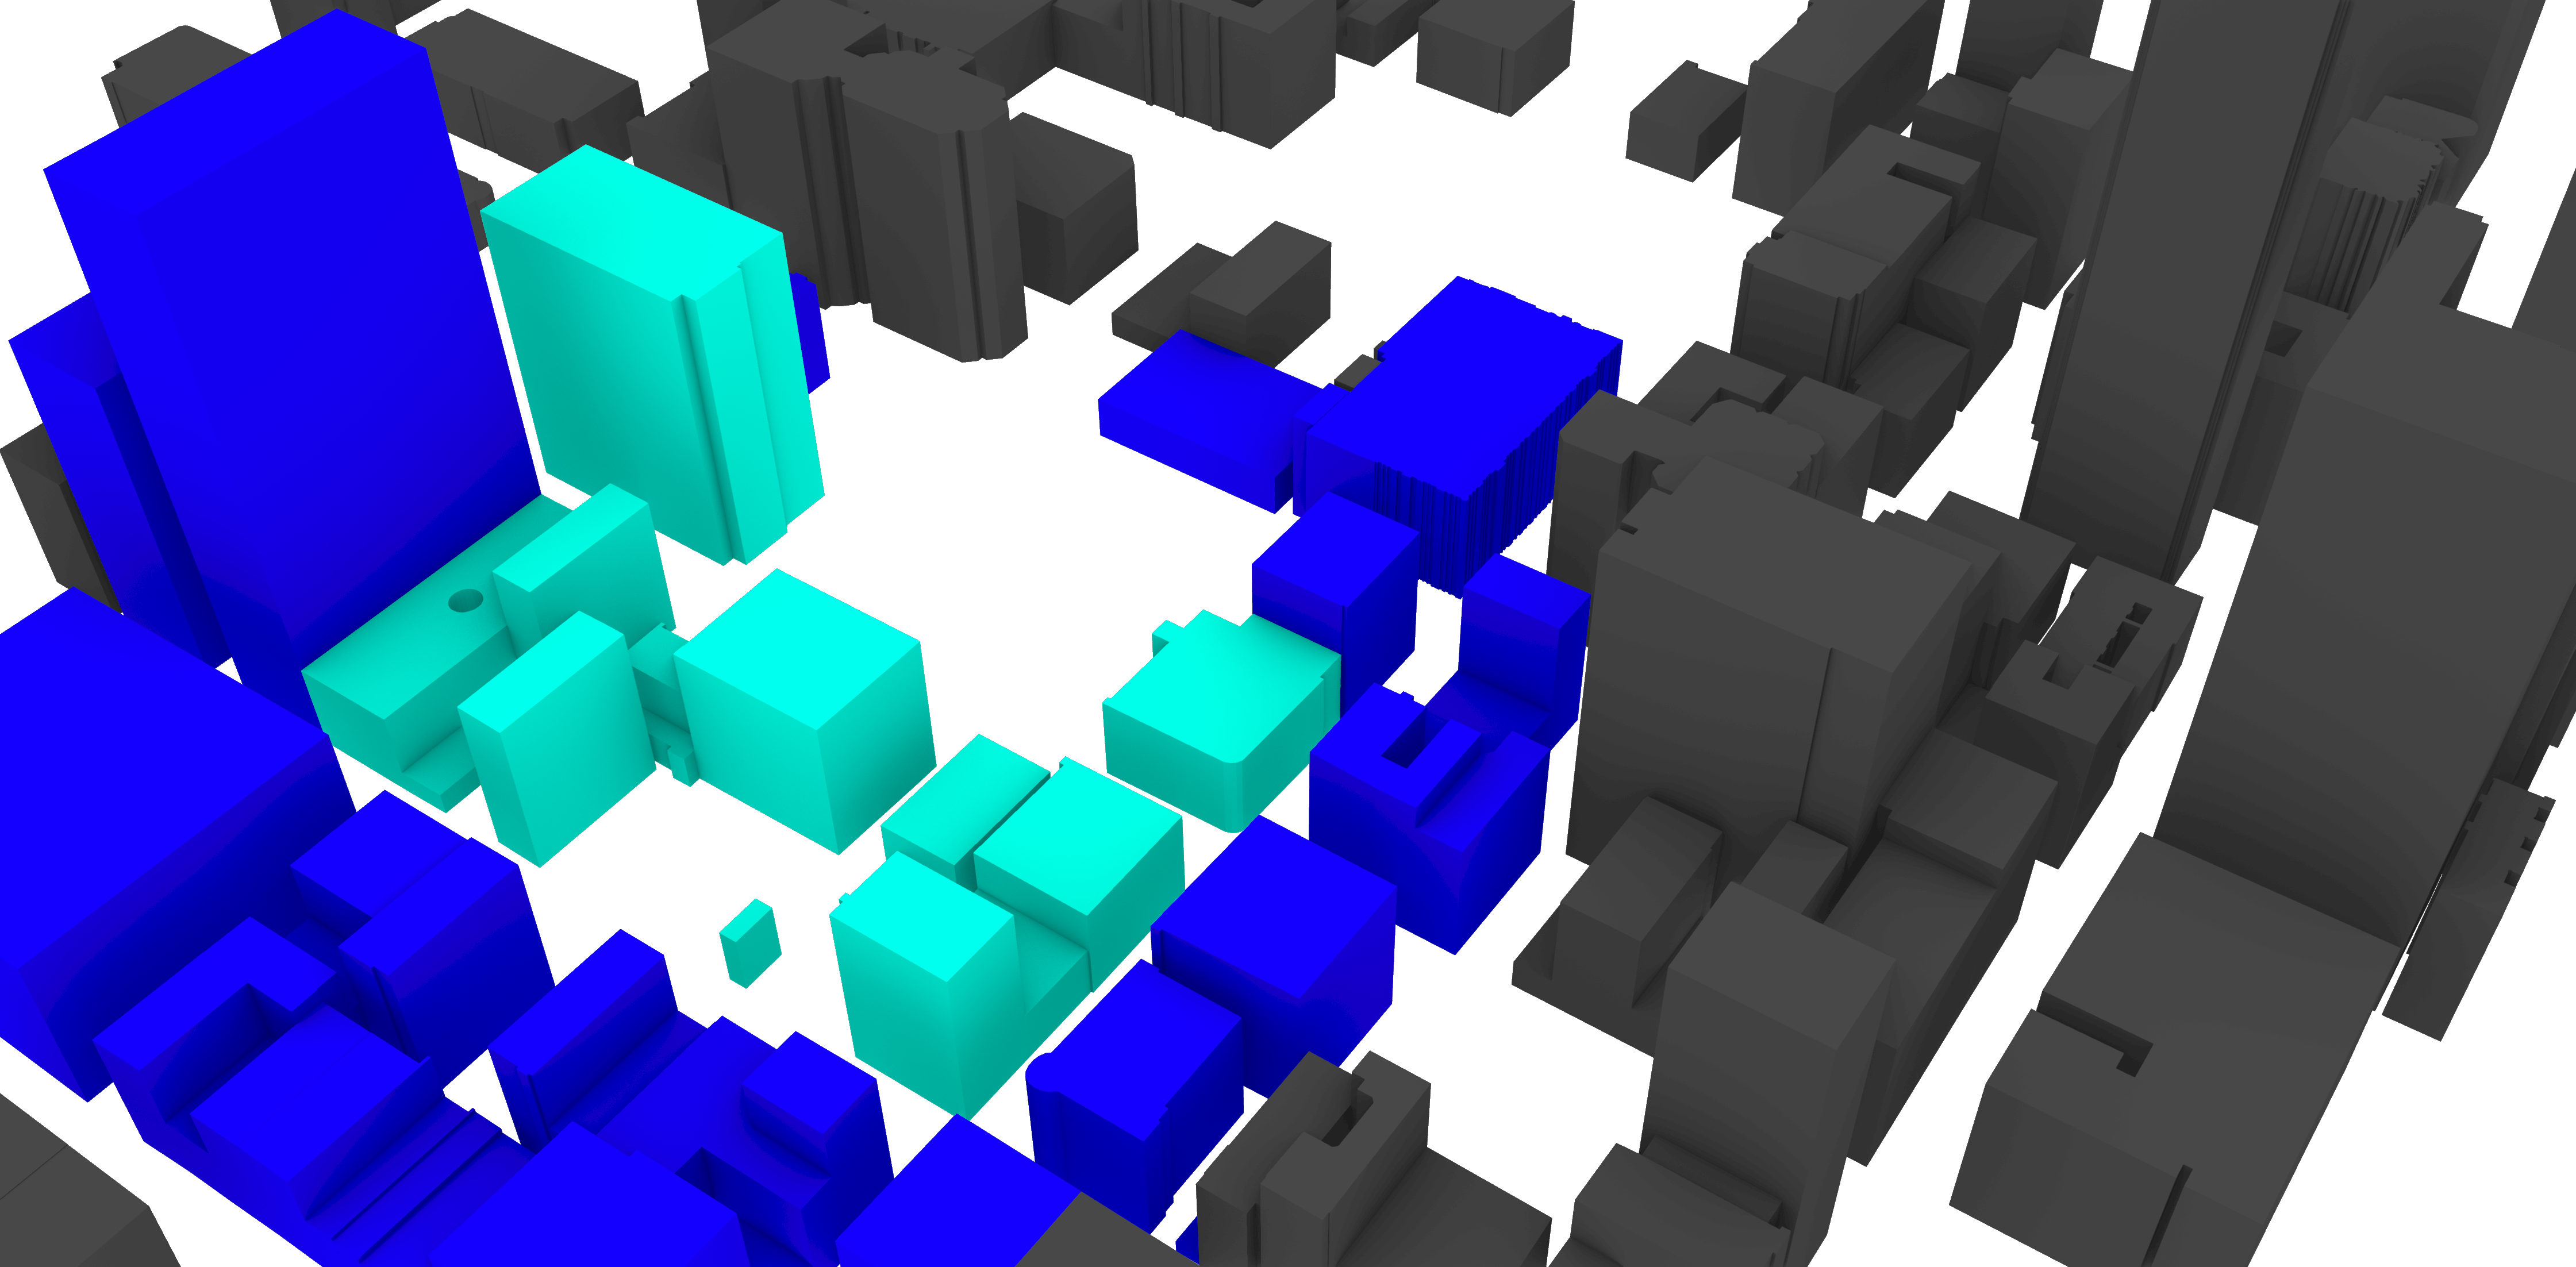
Based on the information provided by OSM of Los Angeles City, 3D buildings geometry was retrieved based on the information provided by OSM. In order to use the 3D GAN algorithm, a segmentation of the geometry of each building was needed because of the density of buildings and the shape of each building itself.
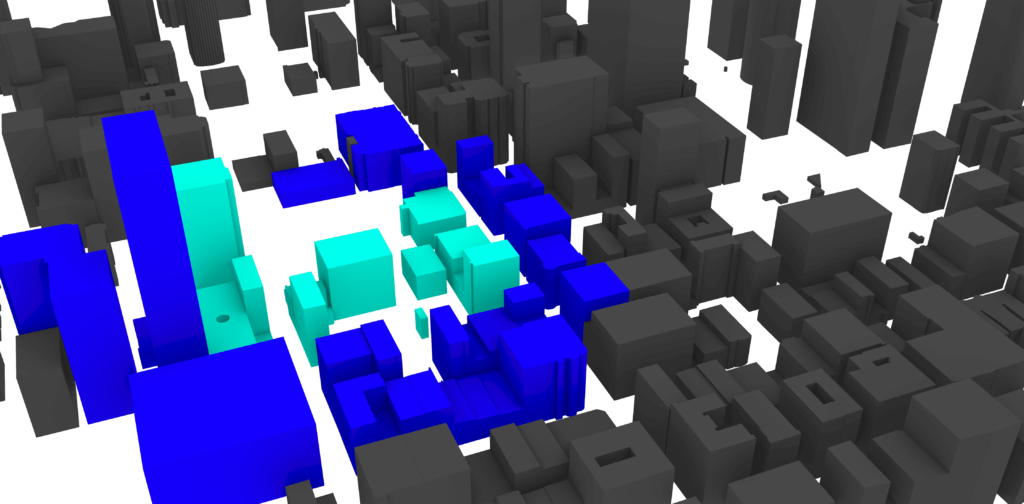
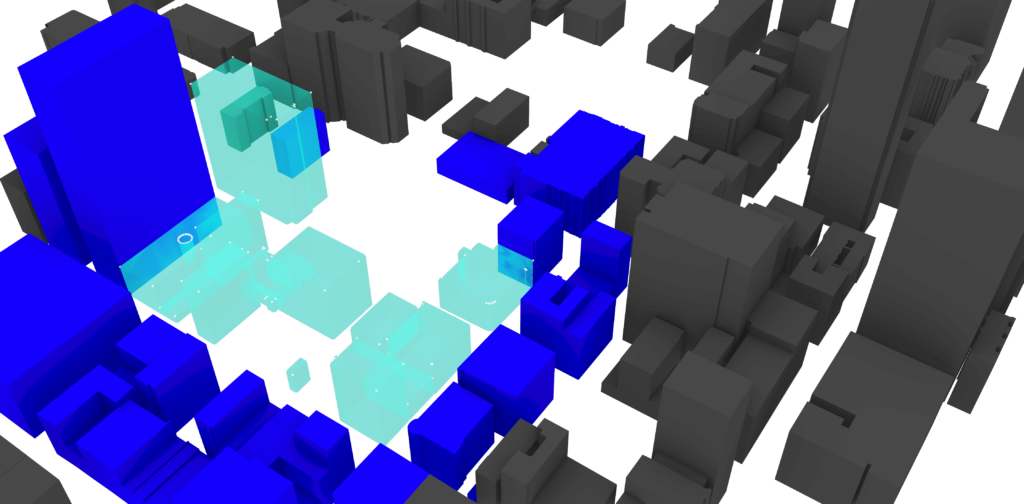
3d GAN
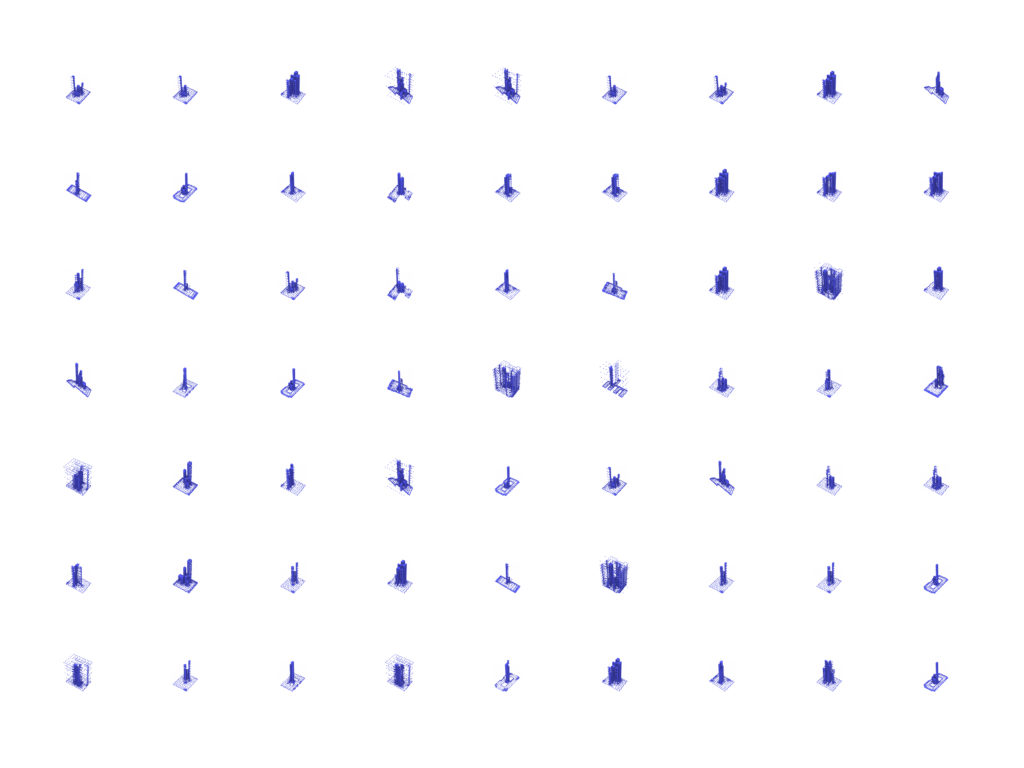
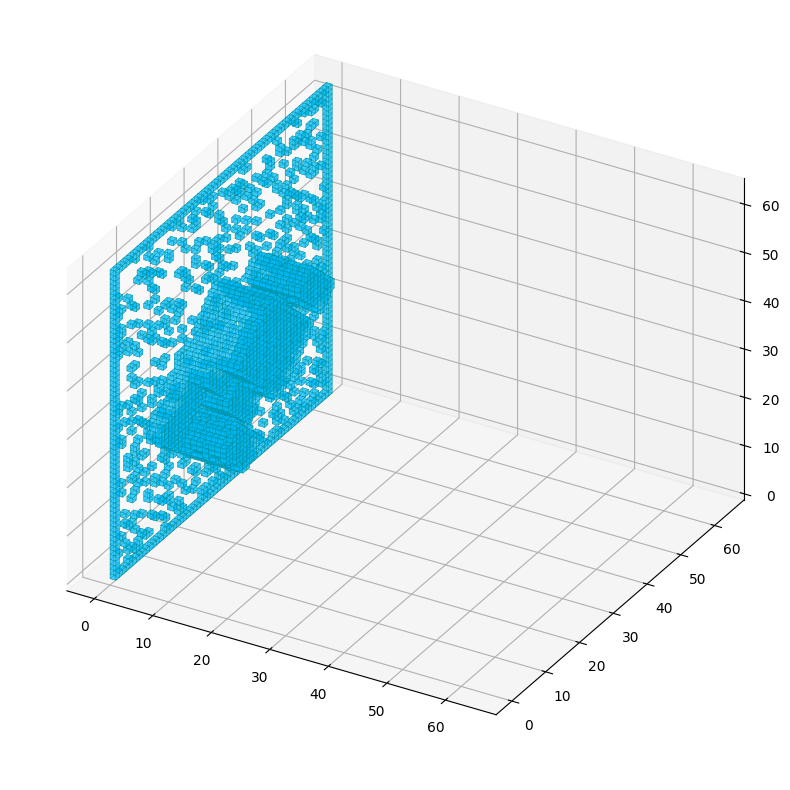
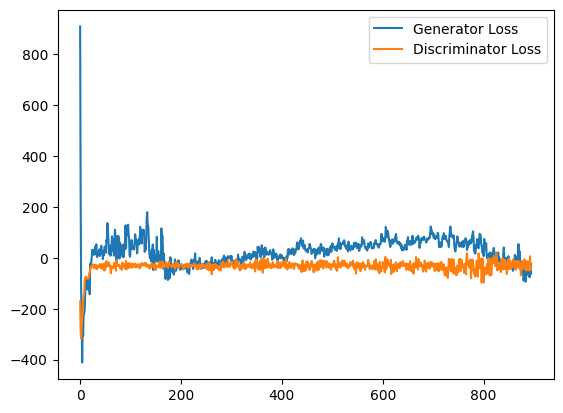
The training of the 3D GAN was a pretty computer power intens procces. It was able to
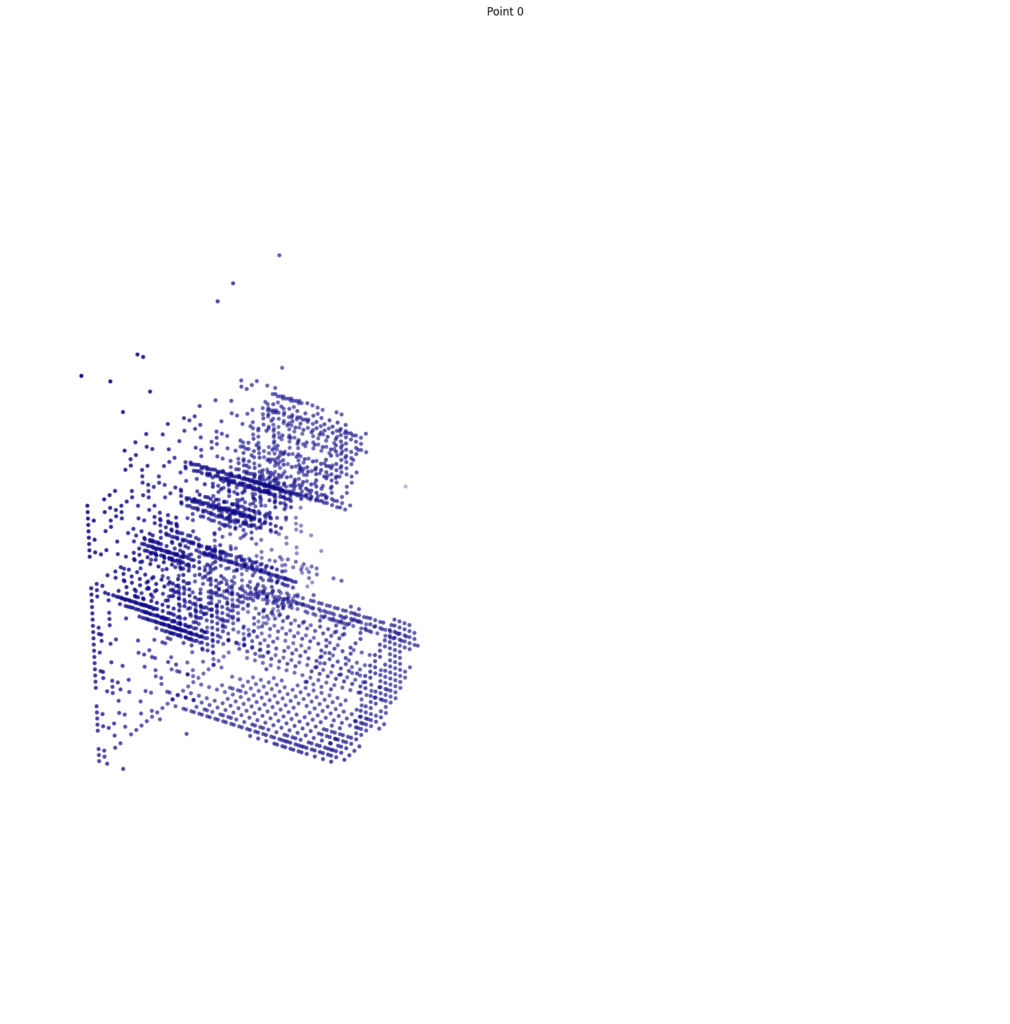
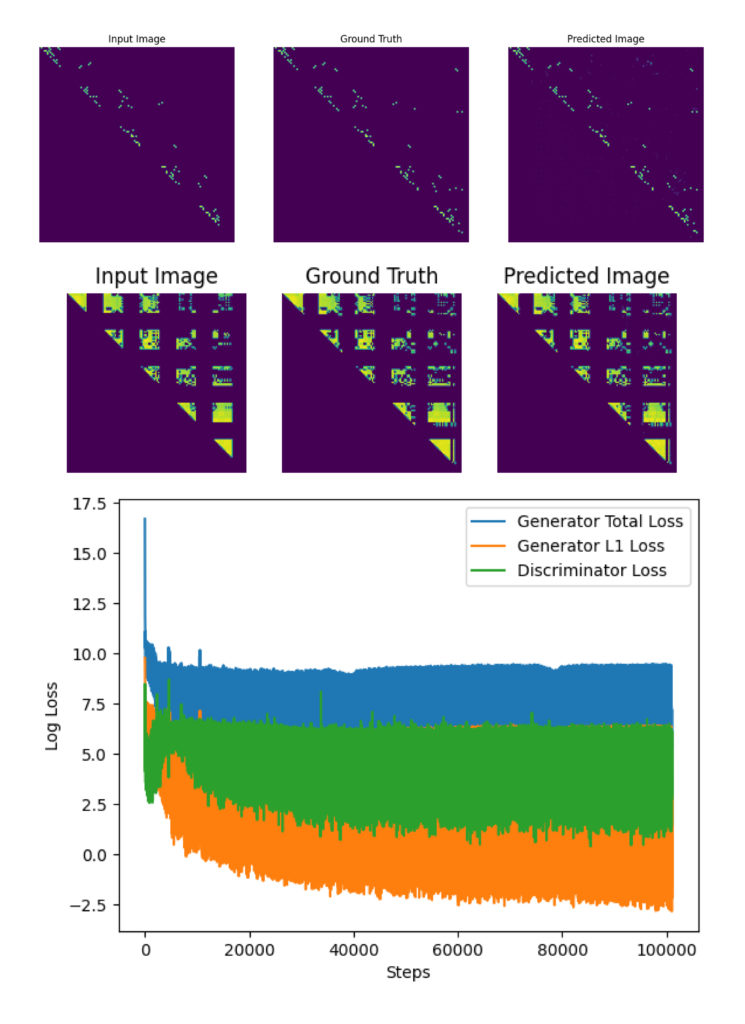
PIX TO PIX
Leveraging cutting-edge Pix-to-Pix algorithms, we translated the raw spatial data into detailed visual representations, enabling us to analyze the city’s geometry more effectively.
By analyzing the existing urban fabric, we trained machine learning models to predict the layout and design of new city blocks or individual buildings. This predictive capability assists architects, urban planners, and developers in making informed decisions during the design and construction phases. b. Surroundings Comparison: We developed algorithms to compare the predicted structures with their surrounding urban context, considering factors such as architectural style, building density, and neighborhood character. This analysis aids in ensuring harmonious integration and maintaining the overall aesthetic appeal of the city.
CONCLUTIONS
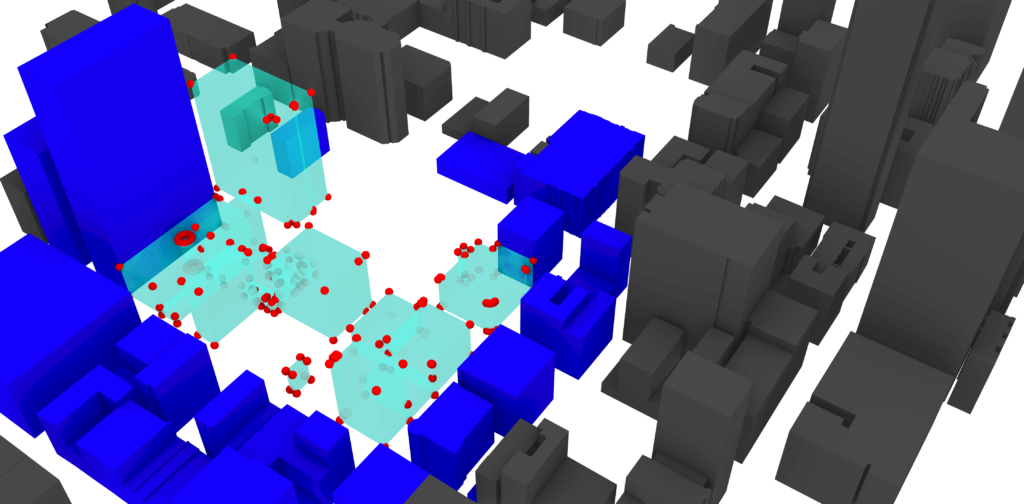
Limitations
- 128 points
- Training Time
- Lost of data due to the complexity of some buildings.
Future work
- Clean the input of Open Street Maps.
- Analyse different areas of the city
- Try to create a bigger image for more complexity
