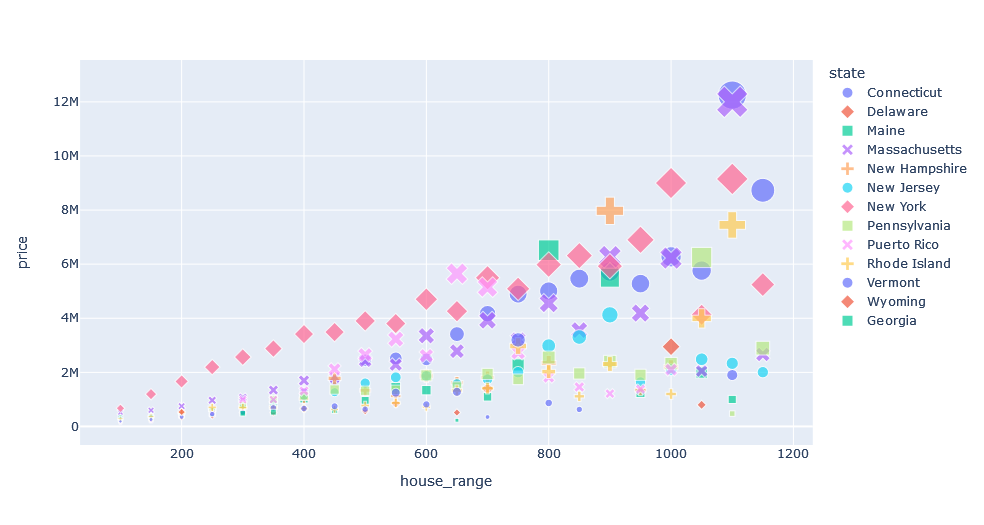
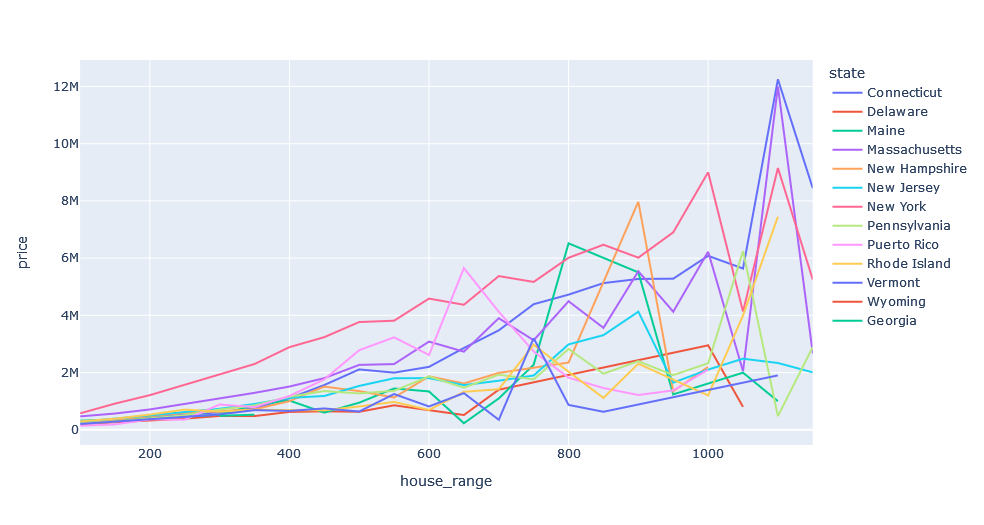
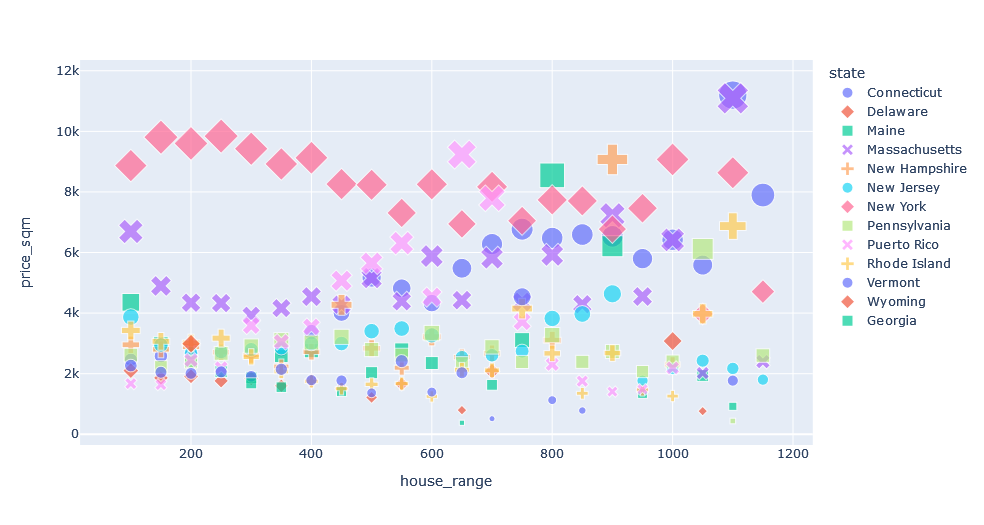
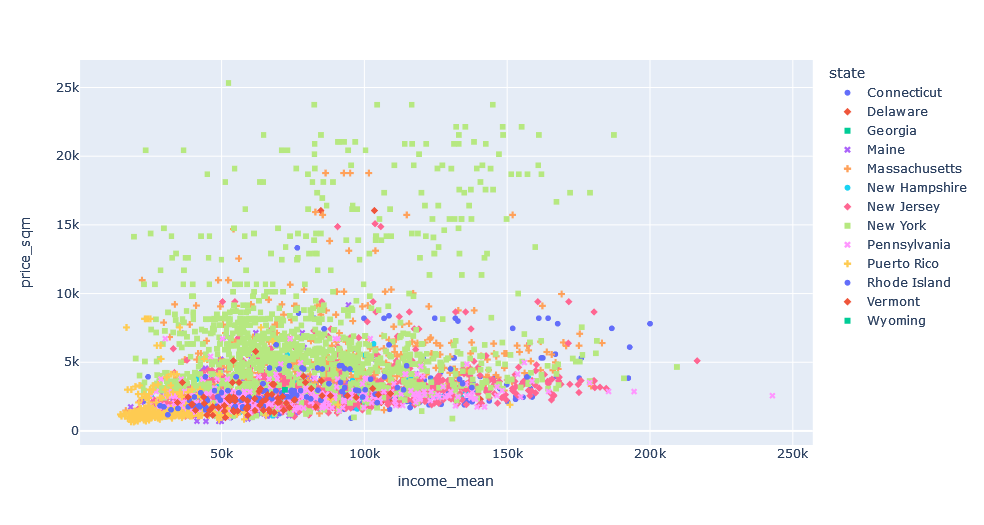
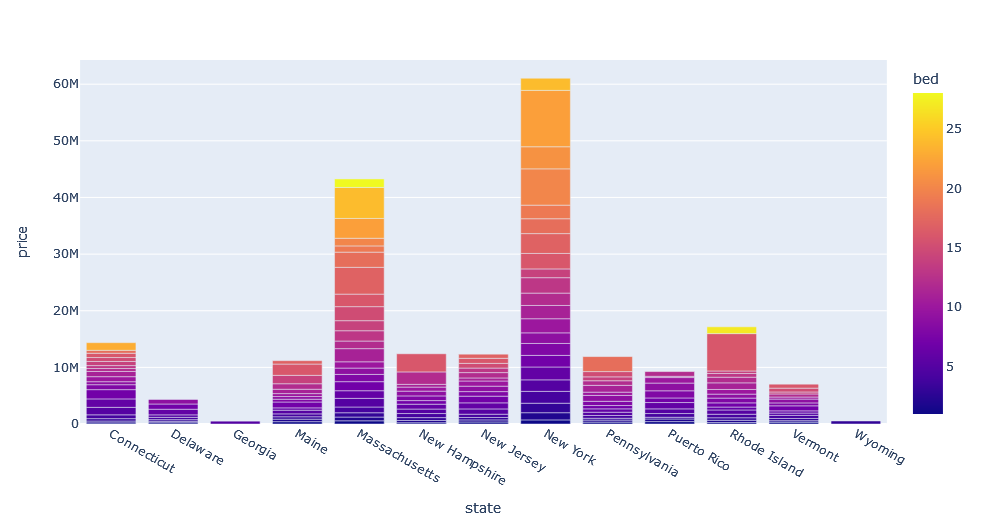
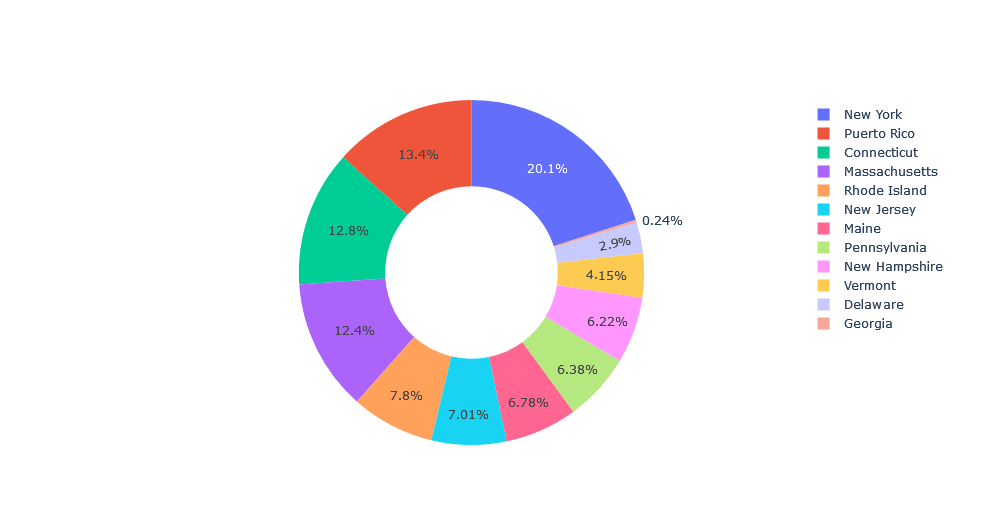
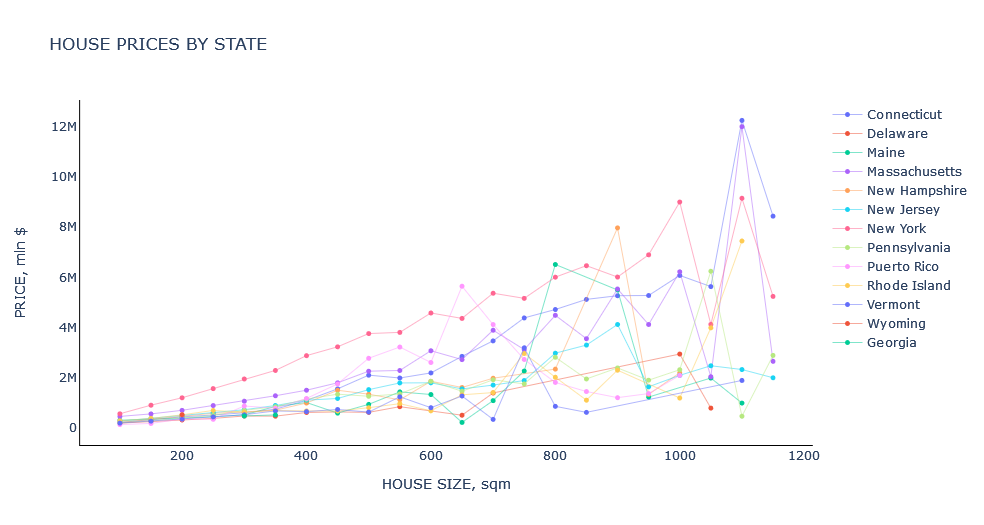
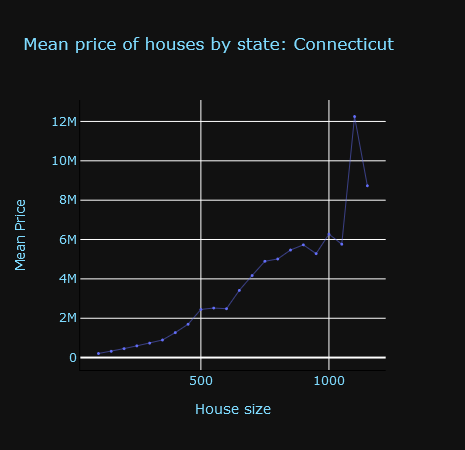
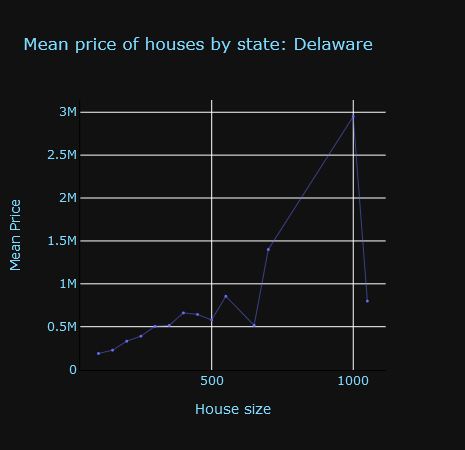
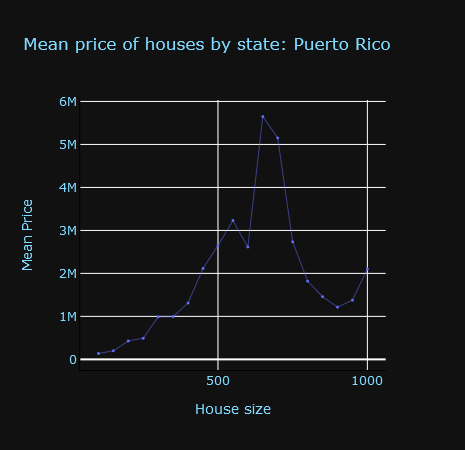
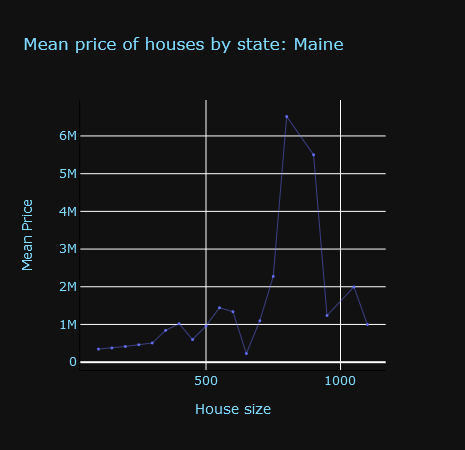
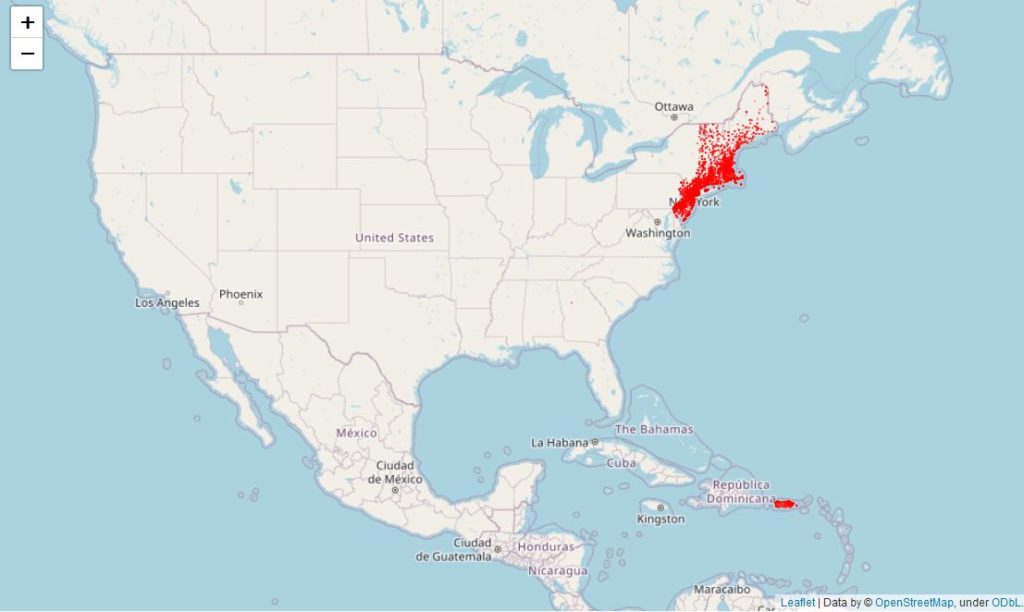
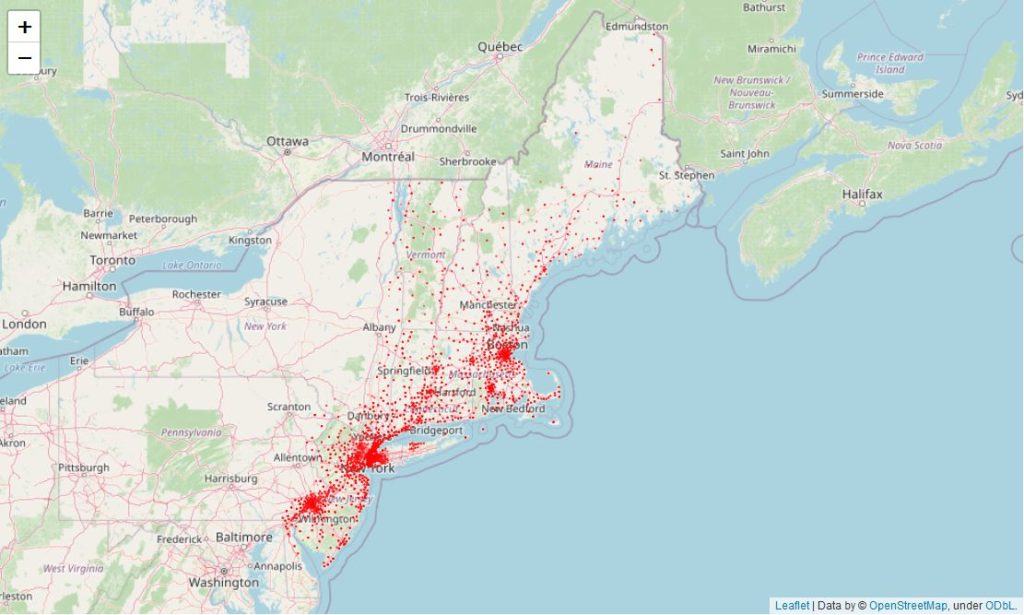
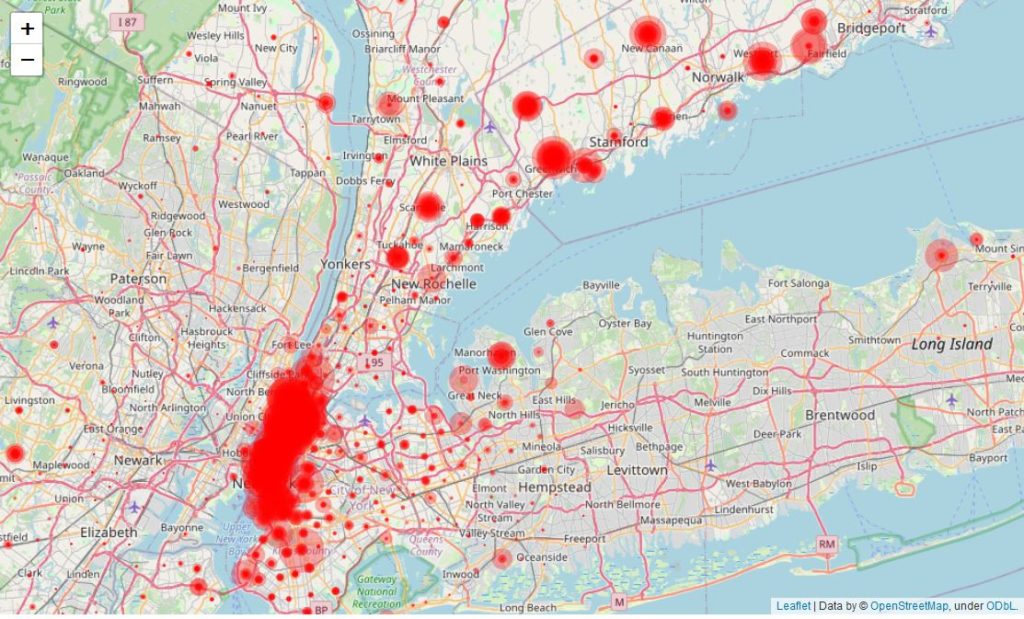
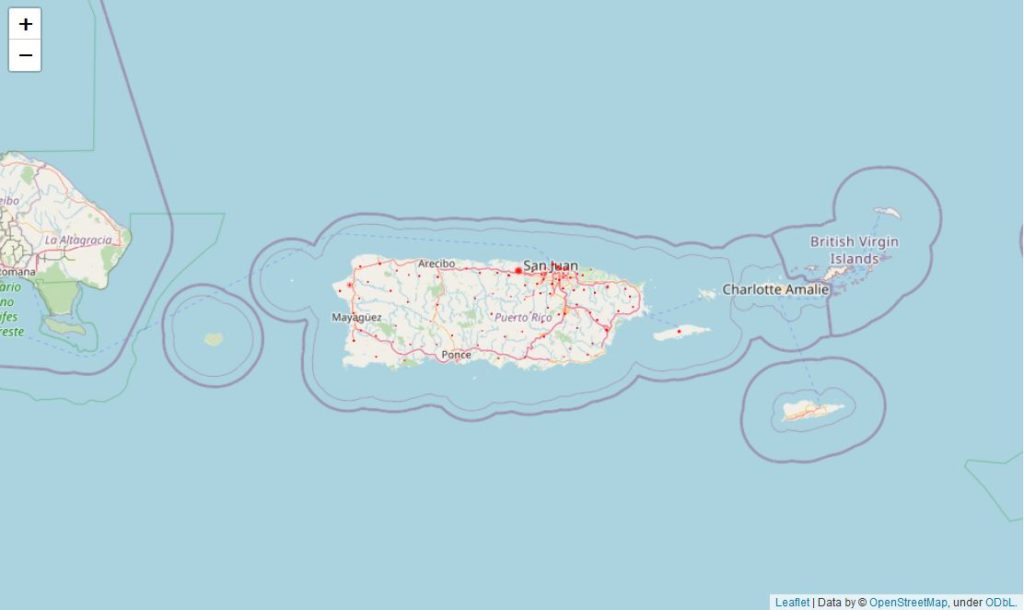
There are over 40,000 ZIP codes in the United States. Categorization by states and ZIP codes in order to compare data, find distinctive features and intercorrelations, and put data on map. VIsualization performed by Python, Plotly Express, Folium. In order to simplify tasks the dataset of 12 North East states is used.

Scatter chart: Mean house price by state
Line chart: Mean house price by state
Scatter chart: Mean sqm price by state
Scatter chart: Distribution of mean income comparatively to mean sqm home price by state
Bar chart: Amount of house selling proposals by state with ascending filtering by bed amount per house
Pie chart: Standard deviation of house prices by state
Line chart: Mean house price by state
Folium map: Distribution of mean house prices on the USA map
Distribution of mean values of real estate in North East states by ZIP codes
Distribution of mean values of real estate in the New York City area by ZIP codes. Size of circle refers to price value.
Distribution of mean values of real estate in Puerto Rico by ZIP codes
Animated line graphs of mean real estate prices by state