
Transforming Architectural Feasibility Analysis
In today’s competitive real estate development landscape, the ability to quickly analyze and optimize building configurations for maximum financial performance is no longer a luxury—it’s a necessity. Our newly developed web application transforms traditional static proformas into an interactive, data-driven decision support tool that bridges the gap between architectural design and financial analysis.
Reimagining the Traditional Proforma
Traditional feasibility studies often involve static spreadsheets disconnected from the actual building design. Our application transforms this approach by creating a dynamic link between architectural programming and financial outcomes. Rather than relying on complex external data feeds, our tool leverages user-defined inputs to drive both design visualization and financial calculations simultaneously.
As architects and developers collaborate on early-stage concepts, this tool provides immediate feedback on how design decisions impact the bottom line, allowing for real-time optimization before substantial resources are committed to development.
Who Benefits from This Tool?
The application serves several key stakeholders in the development process:
- Real Estate Developers: Who need to verify and fine-tune the financial feasibility of their projects
- Architectural Firms: Looking to ensure creative designs can be realized within realistic budget constraints
- Investors: Seeking clearer pictures of project viability through transparent financial metrics
- Construction Companies: Requiring early-stage cost validation
- Urban Planners: Analyzing development scenarios within broader city contexts
Flexible Input Methods
The application offers two primary methods for entering building data:
Standard Geometry Input
The default method allows users to define:
- Building footprint through a curve
- Number of floors and their respective heights
- Program percentages (residential, commercial, hospitality, industrial, services, and transportation)
- Construction costs per square meter
- Market values by program type
This approach provides a baseline for introducing specific geometry while allowing for expansion to incorporate more detailed configurations like floor efficiency ratios and voids.

Building Model Integration
For projects with existing 3D models:
- Direct import of building models
- Automatic extraction of level footprints as geometry inputs
- Integration with market-specific construction and value data
Our demonstration showcases this functionality using “HyperBuilding A,” a project with Tokyo market data, illustrating how seamlessly the application works with complex, pre-designed structures.

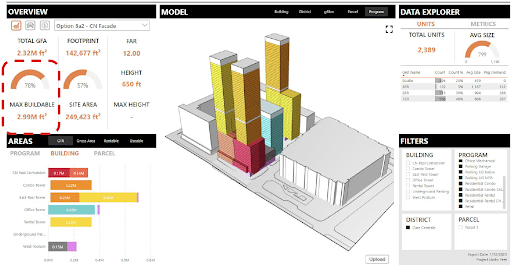
The Application Interface
Input Controls
The left panel houses all input controls, allowing users to adjust:
- Floor counts and heights
- Program distribution percentages
- Construction costs per square meter
- Current market values by program type
These intuitive controls enable testing different scenarios with immediate visual and financial feedback.

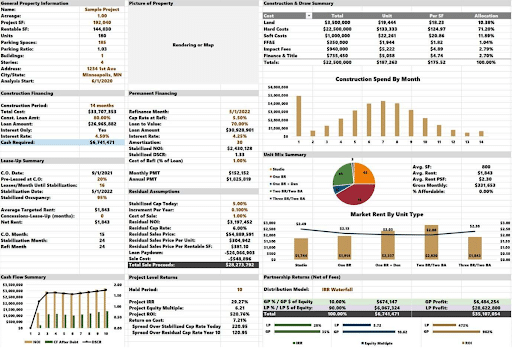
Financial Overview Dashboard
The central financial overview section provides:
- Total construction cost estimation
- Current total market value
- Overall estimated return on investment
This at-a-glance dashboard gives immediate feedback on the financial viability of the current configuration.

Dynamic Visualization
Below the financial dashboard, the building visualization window renders the current program distribution, color-coding different uses within the structure. This visual representation helps users understand how programs are physically distributed throughout the building.
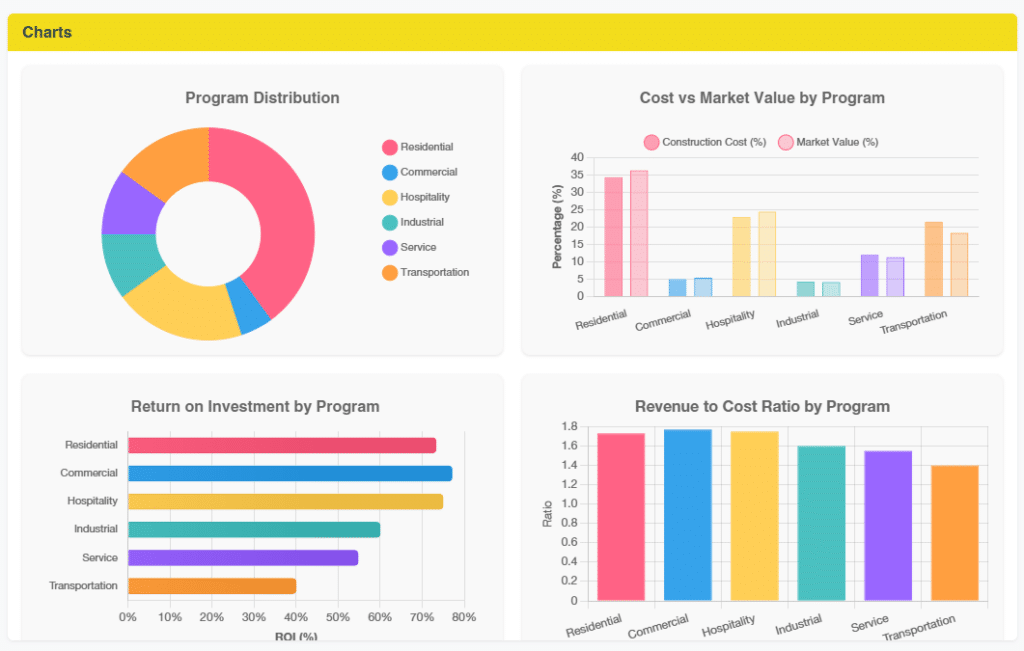
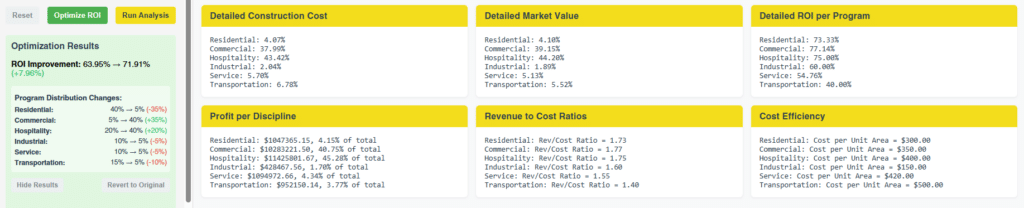
Analytical Charts and Metrics
The right panel and bottom section display detailed financial information through:
- Program distribution charts
- Cost versus market value comparisons by program
- Return on investment metrics by program
- Revenue-to-cost ratios
- Detailed construction costs per program
- Market values by program
- Profit breakdown by discipline
- Cost efficiency metrics
Optimization Capabilities
The most powerful feature of the application is its optimization functionality. With a single click on the “Optimize ROI” button, the system:
- Runs a series of tests using current configurations, construction costs, and market values
- Identifies the most efficient program distribution for maximized ROI
- Redistributes programs within the building based on financial performance
- Provides a detailed breakdown of changes made to improve ROI
The application intelligently balances the programs to achieve optimal financial outcomes based on specific market conditions and building configurations.
Technical Implementation
Behind the scenes, the application leverages:
- A compute-ready Grasshopper definition (accessible via Hops/Rhino.Compute) to generate both 3D geometry and financial metrics
- Python scripts that distribute programs across the building based on percentages and compute financial performance metrics
- Three.js for interactive 3D visualization
- Real-time calculation of financial outputs displayed through charts and tables
The simplified input strategy ensures the system is both robust and easy to use without sacrificing analytical depth.
Case Study: HyperBuilding A
Our demonstration utilizes the Hyper Building A project with Tokyo market data to showcase the application’s capabilities with complex geometries:
- The tool successfully analyzes the multi-level structure with varying floor plates
- It applies Tokyo-specific construction costs and market values
- Despite the increased complexity and calculation load, it optimizes program distribution
- The optimization results clearly show which disciplines experienced increases or decreases in allocation percentage to achieve optimal financial performance

Transforming the Design Process
This innovative tool represents a significant advancement in integrating architectural design with financial analysis. By allowing real-time optimization of building programs based on market realities, it empowers designers and developers to make more informed decisions earlier in the development process.
The application’s versatility makes it valuable at multiple project stages—from early feasibility studies to detailed program refinement of existing designs. As the real estate market continues to evolve with changing demands and economic conditions, tools like this become increasingly essential for creating financially viable buildings that maximize return on investment while meeting programmatic needs.
By transforming static proformas into interactive models that directly connect design decisions with financial outcomes, we’re helping create a more transparent, data-driven approach to architectural development that benefits all stakeholders in the building process.
