
Introduction
In today’s data-driven world, the ability to visualize data effectively is a key skill. This blog post introduces the fundamentals of data visualization using Python, a powerhouse in the data science toolkit. We’ll explore essential libraries like GeoPandas, Plotly and Contextily, guiding you through the process of transforming raw data into insightful, visually appealing charts and graphs.
Step 1: Importing data to Python
To accomplish this task, we will utilize the GeoPandas library in Python. GeoPandas is an open-source library that enhances the functionalities of Pandas, a widely used data manipulation library, by incorporating support for handling geographic data.
# IMPORTING DATA TO PYTHON
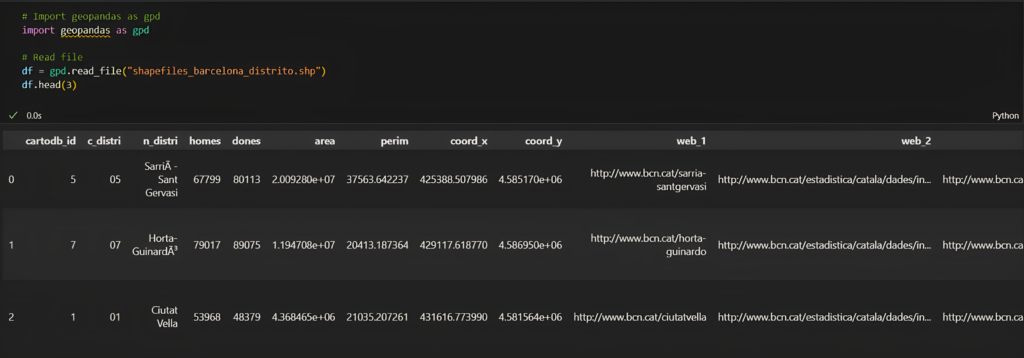
The dataset we’re examining contains distinct rows representing various districts in Barcelona. Each column provides specific data related to the respective district.
Step 2: Creating column for Demographic Density
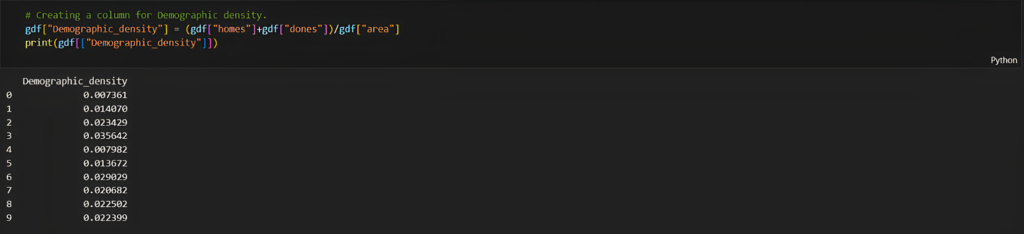
We will now introduce a new column to our existing dataframe to facilitate data visualization. Let’s calculate the demographic density for this purpose. This can be achieved by summing the total numbers of men (‘homes’) and women (‘dones’) and then dividing this total by the area of each district.
# CREATING A COLUMN FOR DEMOGRAPHIC DENSITY
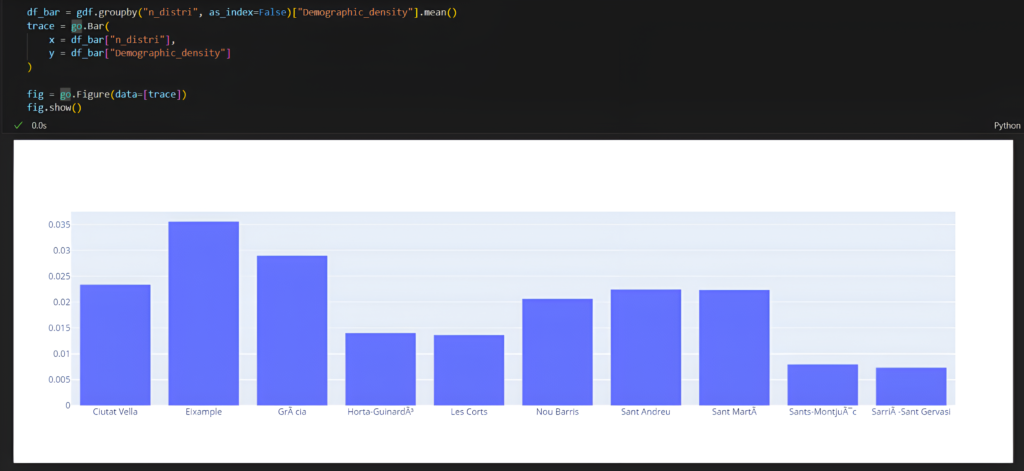
Step 3: Plotting the Demographic Density on graph and map
To achieve this, we will employ Plotly, a versatile Python library renowned for its ability to create interactive and aesthetically pleasing graphs. Plotly supports a wide range of chart types, from basic scatter and line charts to more complex 3D models and geographical maps.
# PLOTTING DATA ON GRAPH
# PLOTTING DATA ON MAP

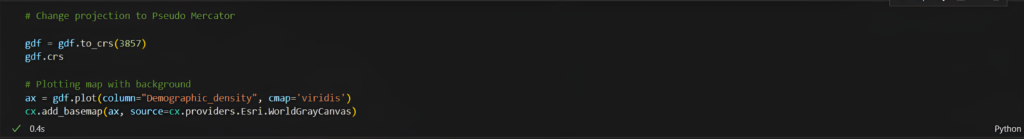
Step 4: Adding background to the map
To achieve this, we will utilize contextily, a Python library designed specifically for adding basemaps to plots created with matplotlib. Contextily makes it easy to overlay your data on top of web tiles from various sources like OpenStreetMap, Stamen, and more.
# ADDING BACKGROUND TO MAP USING CONTEXTILY
Conclusion
As seen above, python has a very wide range of use case in data manipulation and urban mapping. These methods can be used to develop a variety of graphics or graphs in order to put forward big chunks of data into easily readable information.
