
Faculty: Angelos Chronis, Aris Vartholomaios, Alex Christodoulou, Ekaterina Vititneva, Lenka Kabosova, Maria Papadimitraki
Parameters
Location: Stockholm, Sweden (59°19’53.8″N 18°04’16.6″E)
Building Typology: Residential
1.SUN HOURS, SOLAR RADIATION, VISUALIZATION
a. Incident Radiation
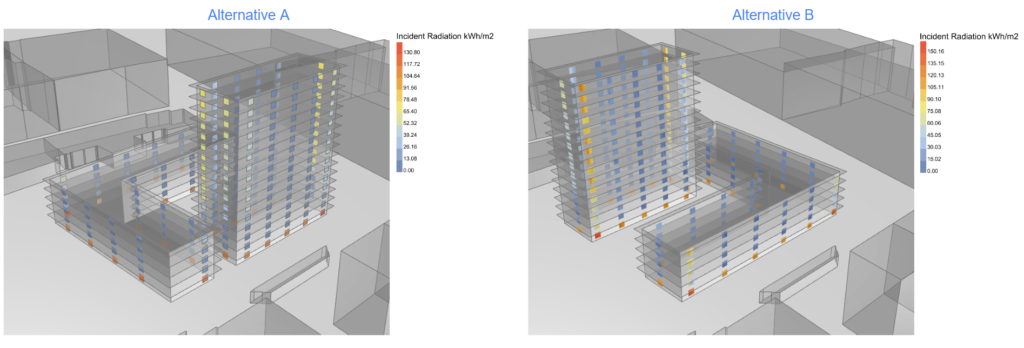
In alternative A, the two building masses reduce the overall exposure to solar radiation since the higher block provides substantial shading to the longer façades of the shorter blocks. This results in a more desirable performance in summer months but it might also affect the heat demand in harsh winter.
b. Direct Sun Hours

On the other hand, the direct sun hours in alternative B tends to have a higher ratio of exposed windows to the longer annual sun hours.
2.THERMAL COMFORT
a. Psychrometric Chart
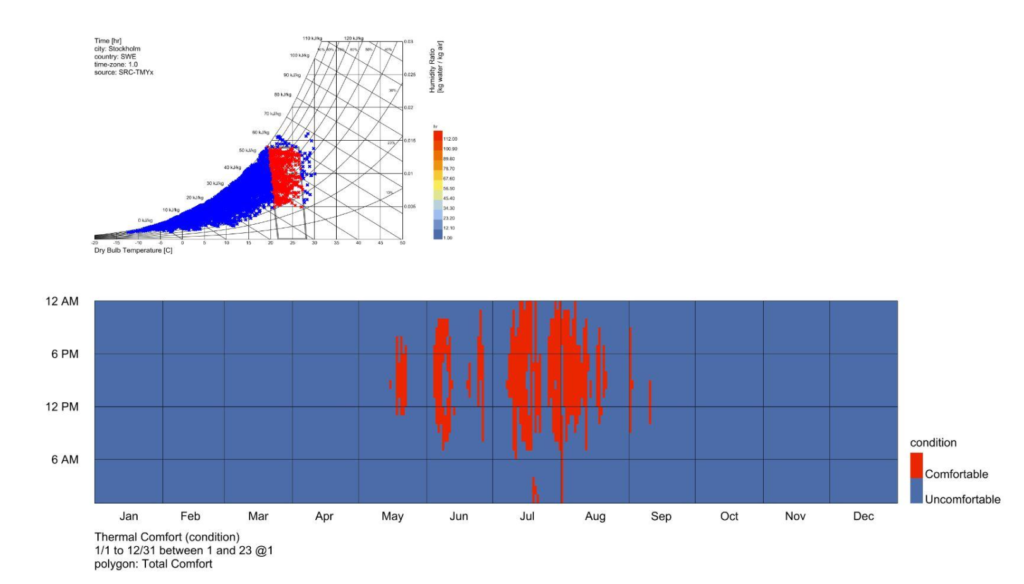
When we have a look at the psychrometric chart, cold weather prevails in general. The highest temperature observed is 25 degrees in July.
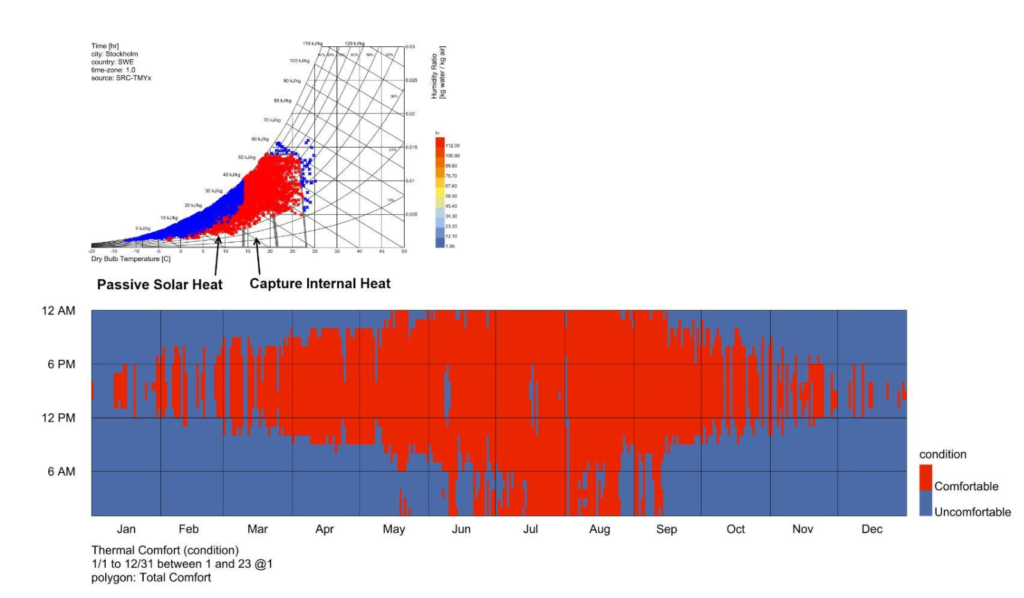
This necessitates proper heating and tools for preserving the heat such as triple glassed windows, 30 centimeters thick walls and so on.
b. UTCI
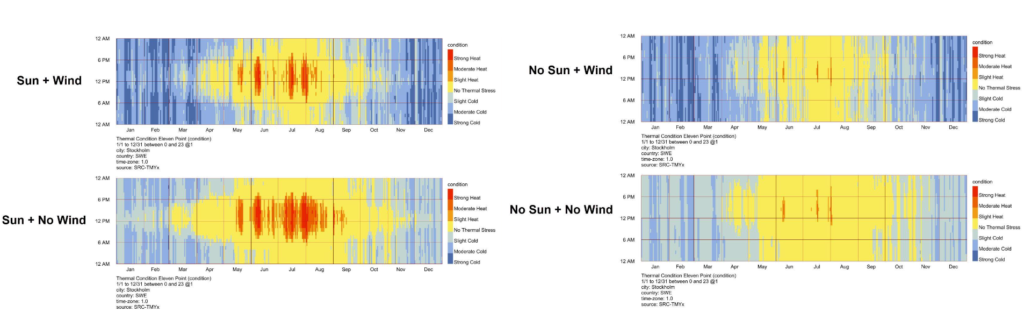
When the UTCI charts are observed, it is seen that even in summer months, the mornings and evenings can be quite cold.

During the September equinox, the buildings in Alternative A, with an open courtyard to the south, block the cold winds and offer a few thermally comfortable areas. Alternative B has virtually no comfortable areas.
c. Thermal Comfort for Courtyard Ground Materials
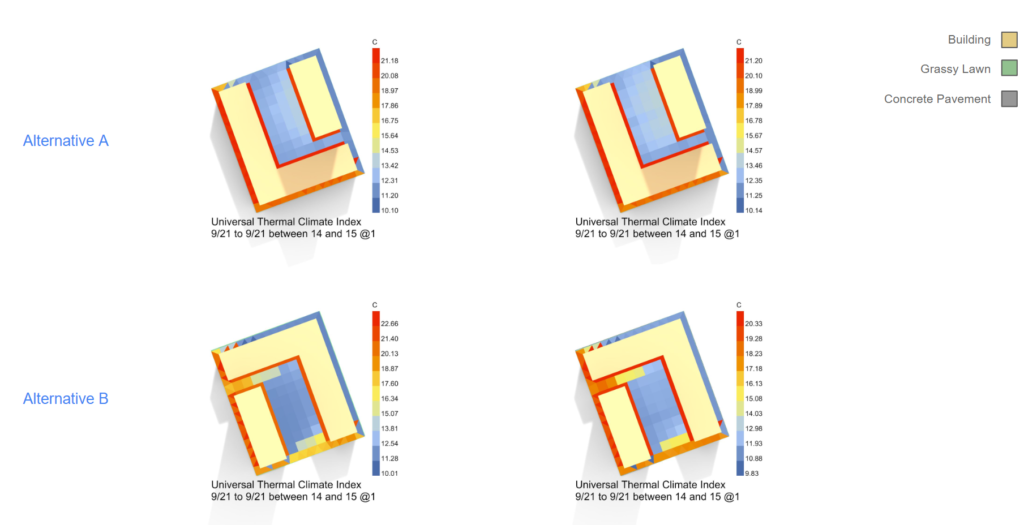
Both alternatives are initially designed with a courtyard of concrete pavement, which results in around 11 celsius degrees for both cases. More heat absorbent materials like grass can increase temperature by 2 degrees in both alternatives.
3.DAYLIGHT STUDIES
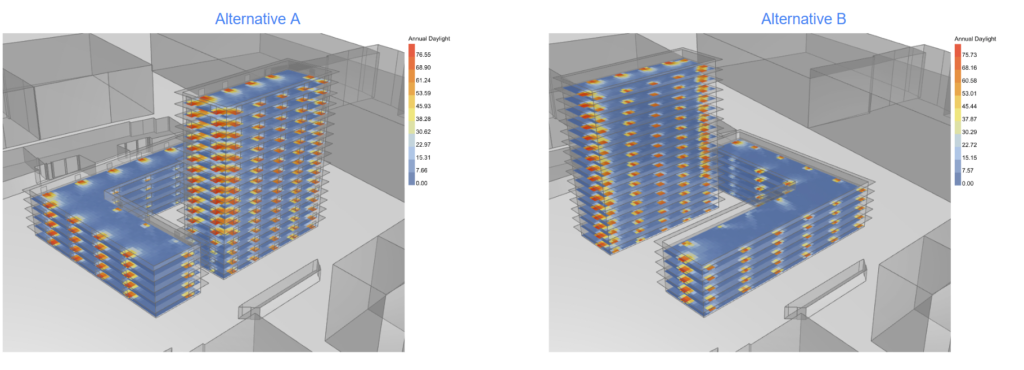
a. Annual Daylight
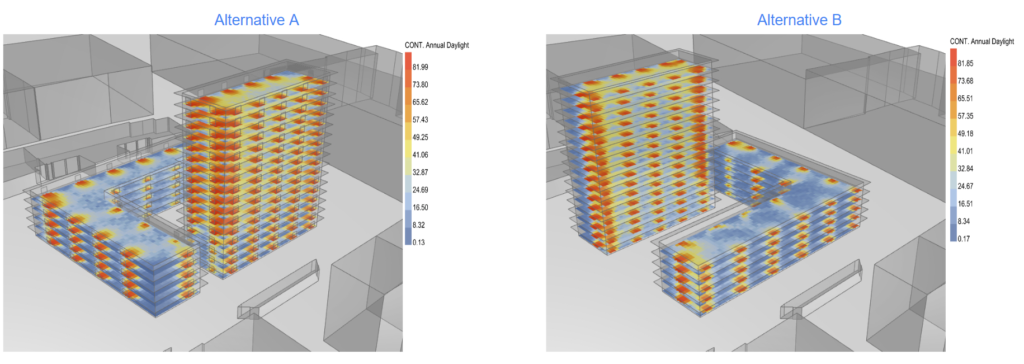
b. Continuous Annual Daylight
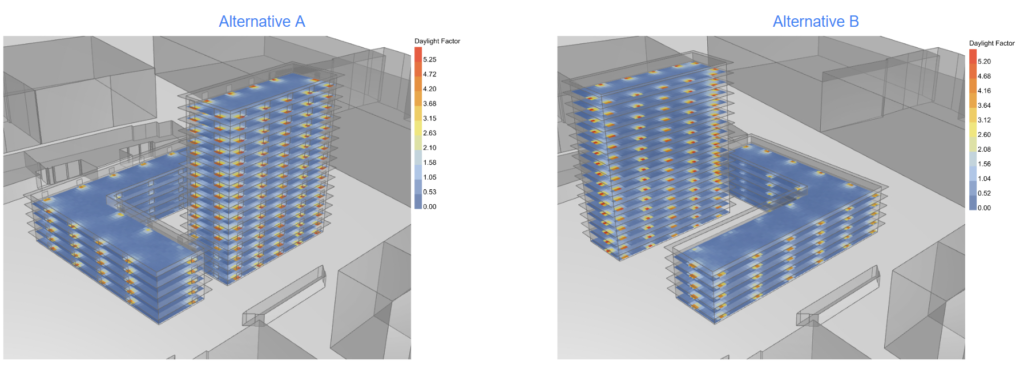
c. Daylight Factor
d. Sky View

The two design alternatives tend to perform identically in daylight simulations. This is mainly because of the surrounding context which has large open areas and wide streets around our site.
4.WIND
a. CFD
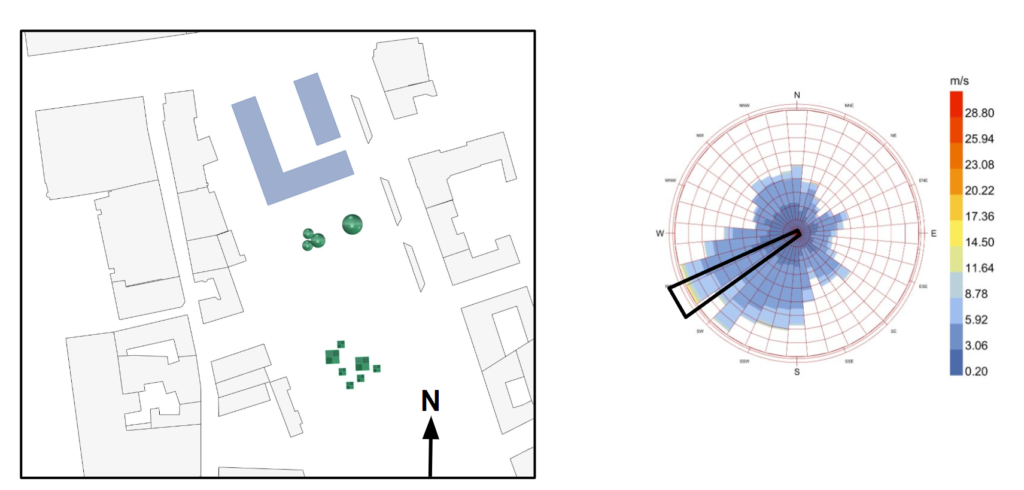
Extracting wind direction and prevailingness is the first step to setting up a CFD simulation. However, obtaining that from a wind rose is a challenging task. Let’s break the problem down graphically.
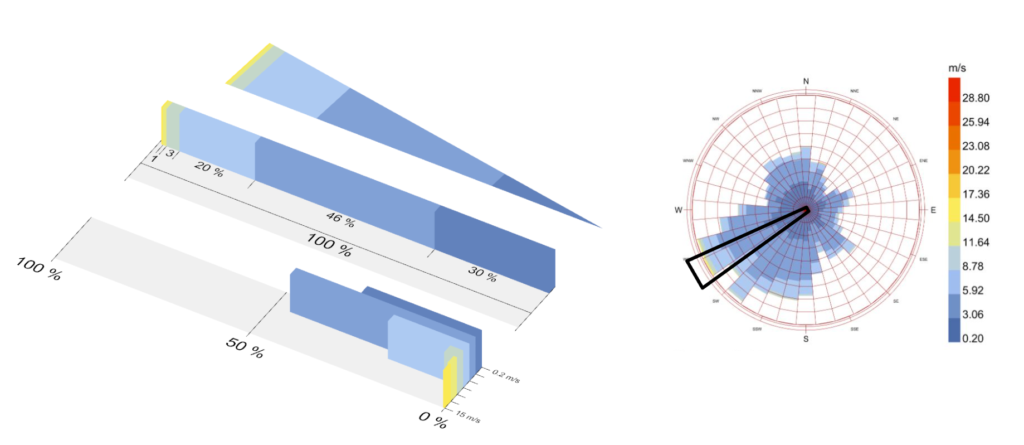
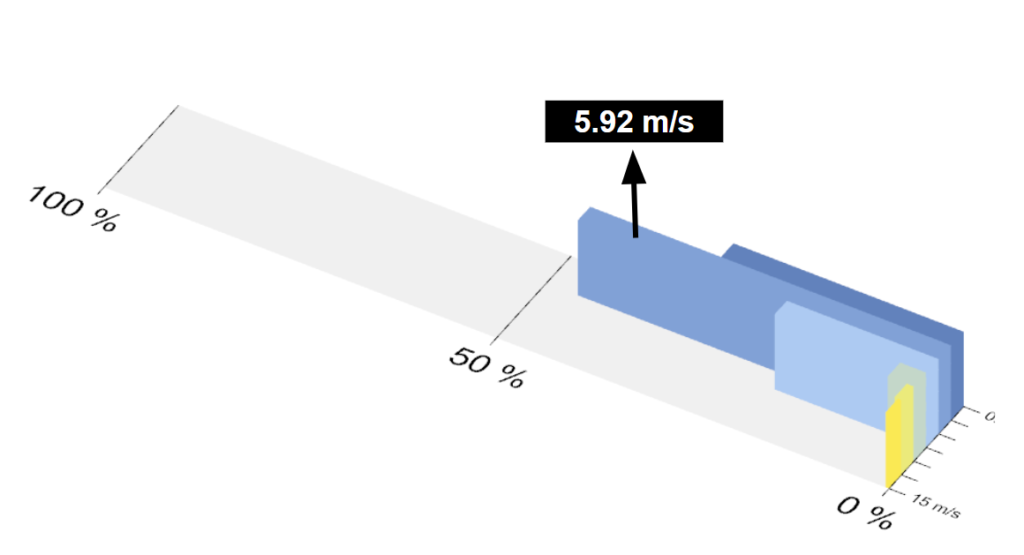
The size or area of those colored parts is not relevant. We can represent them as bars. The length of each bar is a percentage of time. While the color of the bar equals speed. Our prevailing wind has a speed of 5.92 m/s, is present 48% of the time, and blows from the SouthWest.
b. Wind Velocity – CFD

The wind conditions in the patios of our two alternatives are similar. So, we instead looked at the effect of our buildings on their surroundings, especially the northern cafe area.

But once again, the effect of each alternative is similar. So, we look further into our context.
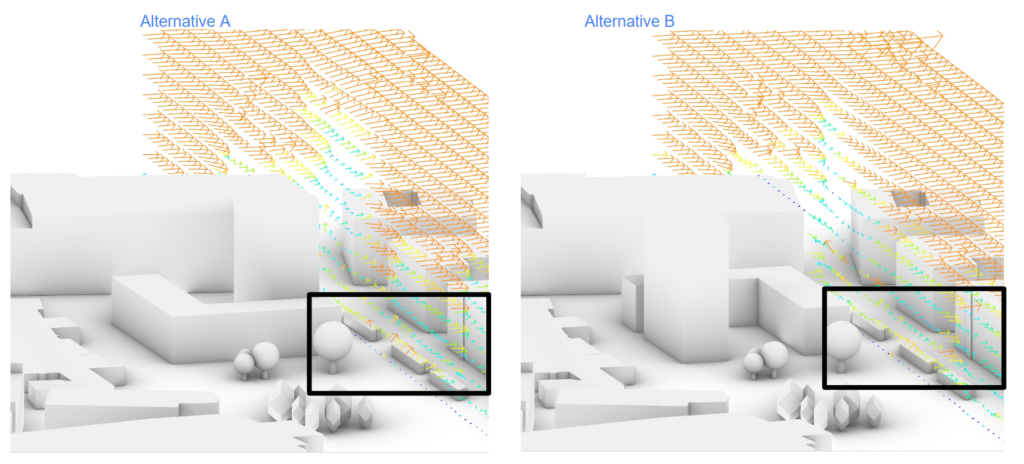

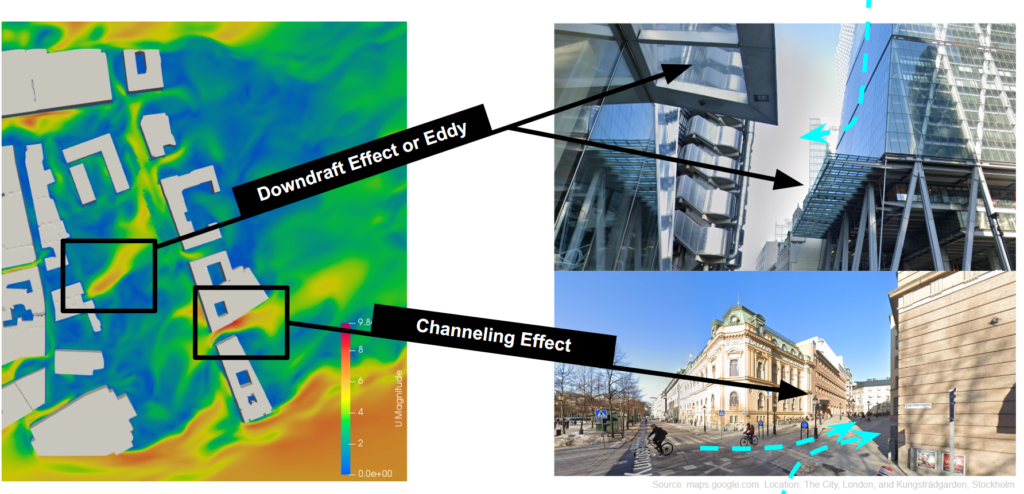
Venturi or channelling happens on the street where a subway station is located, while an eddy is visible on the southern side of our buildings. We understand now that those canopies in most towers in The City (in London) are not there because there was a bit of slack in the budget, but they help with downdraft!
c. Wind Speed – InFraReD
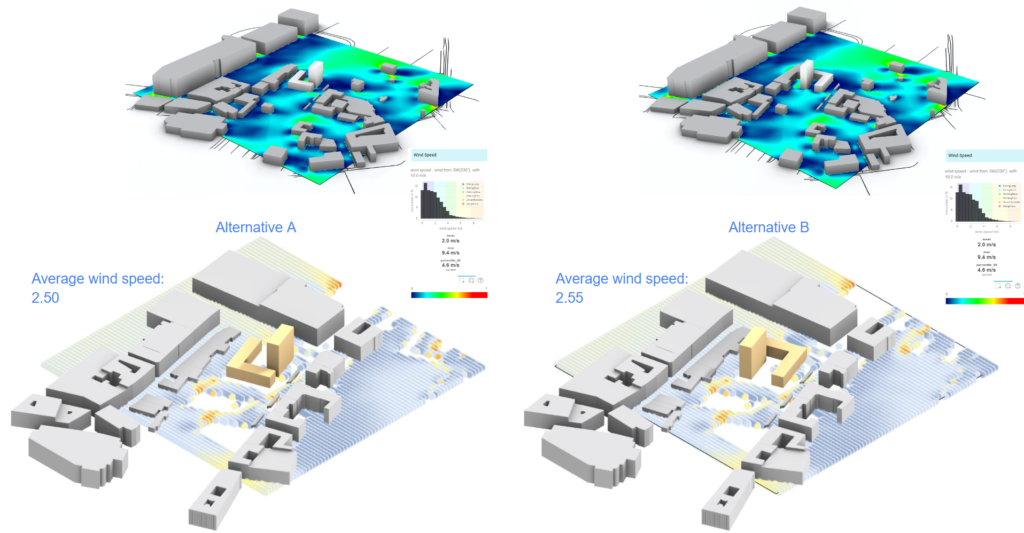
When we analysed the site in terms of wind speed via Infrared, we observed that alternative B is in favor of the users, since it provides a wind speed at a level of sitting long in the courtyard. Eventually, both alternatives having their pros and cons, we concluded that alternative B offers better thermal conditions for the residents of our design compared to alternative A.
