
Introduction
Airbnb is a well know marketplace that connects people who want to rent out their property with people who are looking for accommodations, typically for short stays (Investopedia, 2023). As a powerful tool to connect people to hospitality supply around the world, and provide them quality spaces to stay, it heavily relies on the perception of users as a means to attracting future guests.
By collecting and sharing a complete characterization of the available properties, users can adapt their search based on geographical conditions, expected amenities and accommodations, physical conditions of the place, constraints and restrictions among others. The same way, users can search for previous guests’ experiences, feedback on the location, host’s services, real conditions of the place as other perceptual variables.
This data helps guests shape their travel according to their needs and expectations using data-based solutions. In this same manner, the aggregate information gathered by Airbnb and publicly exposed in their datahub Inside Airbnb is a useful tool to understand urban dynamics in different cities around the globe.
Methodology
Inside Airbnb provides datasets for many cities around the world, describing the demand and supply dynamics of the platform. Using this information, the objective is to describe and obtain insights about the spatial dynamics of three cities in Spain: Madrid, Barcelona and Sevilla.
On one hand, the dataset LISTINGS provides all the historically available offered properties per city, including their price. It also includes information about the host name, included amenities and accommodations, previous users’ ratings, among others. Furthermore, it provides the location of each listing, meaning that it can be geolocated for cartographical analyses.
In the same manner, the open-data platform contains detailed information about the REVIEWS done by previous guests to the listing they attended to. This includes the complete comments left by the users. This dataset allows to perform a keyword search to look for the most common words used by guests to describe the listings as well as the general conditions of the surroundings.
Finally, the platform contains a georeferenced dataset containing the polygons of the NEIGHBORHOODS to spatially merge the listing location to administrative boundaries.
By adding an additional layer to the analysis, the amenities or points of interest, extracted using OpenStreetMaps open-data source, it is possible to quantify the proximity of the listings based on a walkable distance radius (for the scope of this exercise, a distance of 400 meters is considered). Not only this allows to evaluate the accessibility of the different neighborhoods, but also look for correlation between Airbnb demand, supply and healthy place conditions.

Insights on socio-spatial dynamics
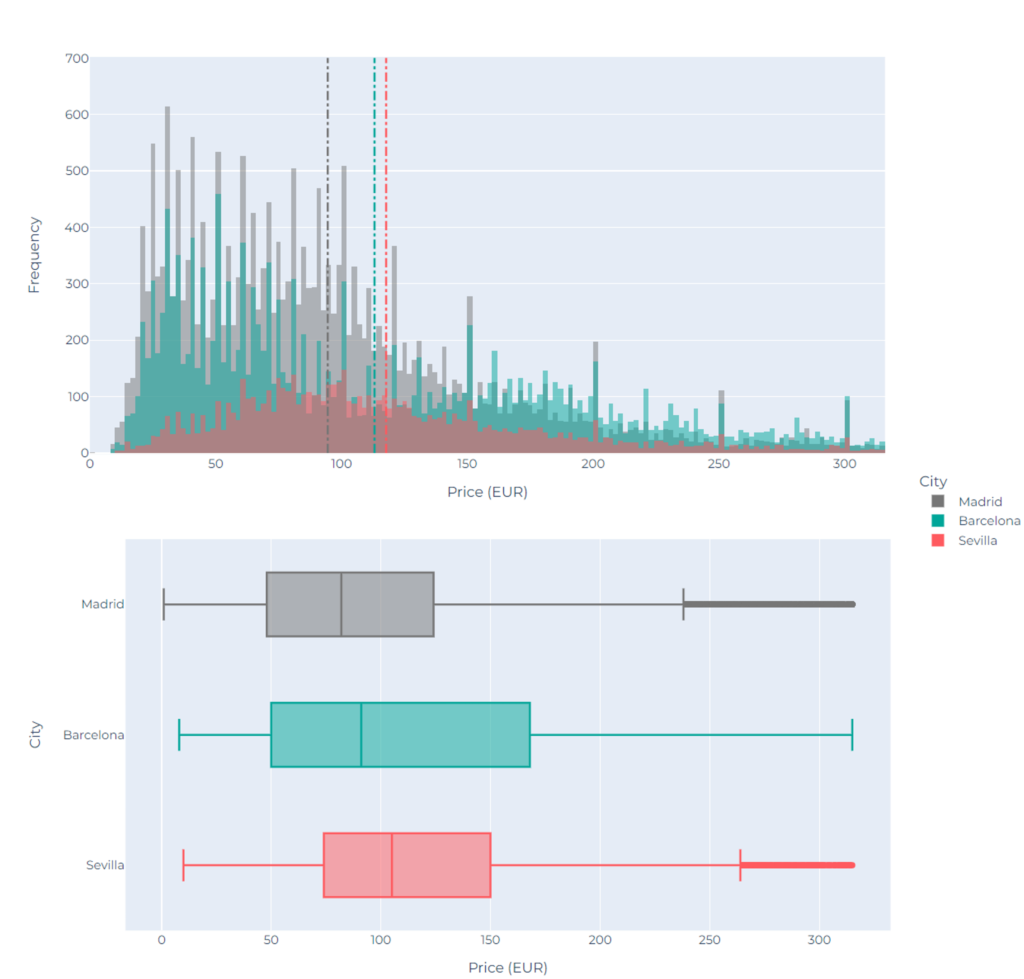
By performing a descriptive statistical analysis on the price distribution of the listings, it is possible to identify that Sevilla has the highest average price per listing, followed by Barcelona and then Madrid. Specifically on the case of Madrid, the listing prices are positively skewed with high concentration of registries concentrated in the lower bounds, while Barcelona and more drastically Valencia registries are more widely spread to the middle-higher values.
Insights on space accessibility
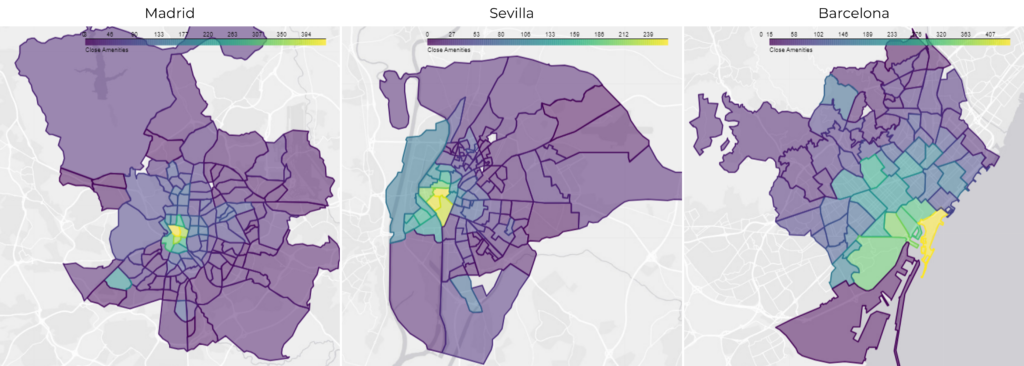
By performing a 400-meter search radius on each of the listings published by Airbnb, it is possible to quantify the mean accessibility per neighborhood. As it should be expected, the neighborhoods at the center of the three cities show a higher proximity to amenities.
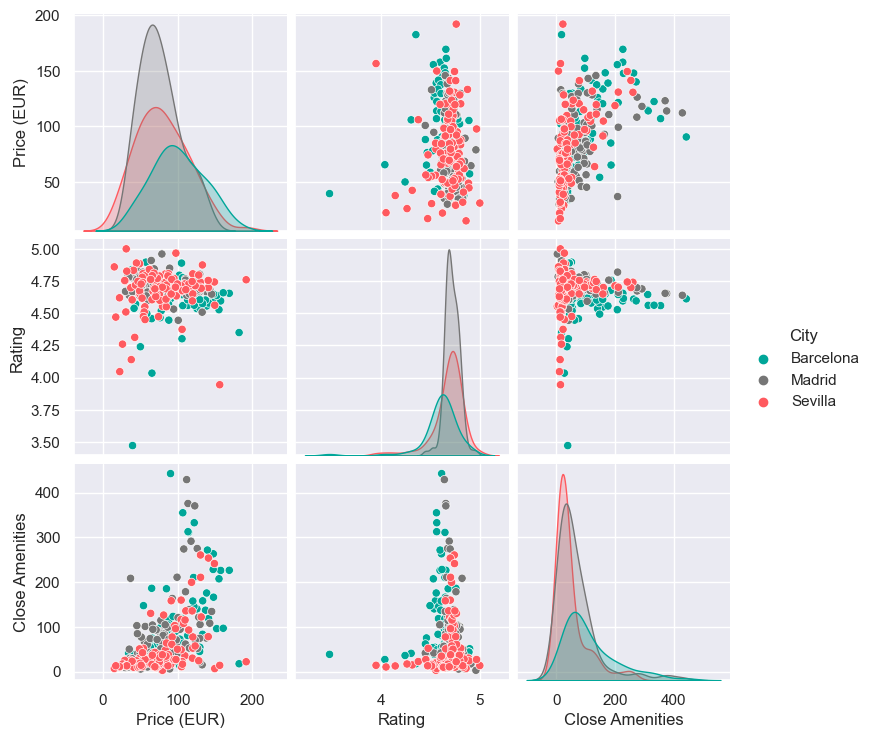
Accessibility is an important factor both from the demand and the supply of hospitality. As identified below, there is a correlation between proximity to amenities, listings’ price and users’ rating: Locations with high proximity to amenities not only tend to represent higher prices, as people are willing to pay more, but also, they are more satisfied with their experience, as also ratings tend to be proportionally higher.
Insights on people’s perception of space
Users’ ratings of listings reflect their perceptions of their experience in the properties in a quantitative way. Although they are useful for assessing the quality of listings, they don’t transmit the subjective value of perceptive variables that are important for users. For this reason, analyzing their open comments allows to identify subjective aspects that could represent patterns in a more general way. By extracting the most common keywords by user, by listing and even by neighborhood, it is possible to identify trends and generalizations. This is a process that requires a critical perspective to avoid capturing repetitive but not valuable words (such as “apartment”, “place”, articles, connectors, hosts’ names, city names, among others). After depurating these keywords, it is possible to map the most common word by neighborhood.
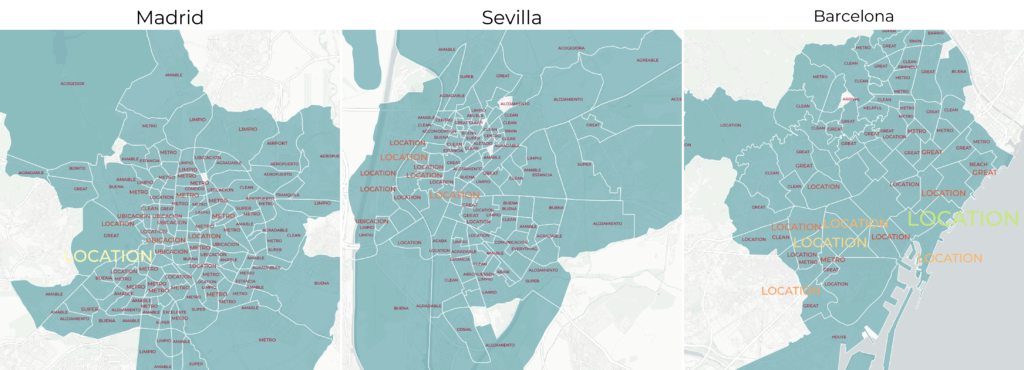
It is possible to identify that the LOCATION of listings is very repetitive among users ratings, but furthermore, neighborhoods where this word is more common, correlate with those which have high accessibility to amenities and services.
Conclusions
Platforms like Airbnb collect and share data involving millions of people, places and locations. It is not only a valuable tool for the users of the platform, both from the demand and the supply perspective, but it is also a powerful asset for urban analytics and the study of urban phenomena.
