Using Node Similarity and Machine Learning: How advanced graph analytics and spatial daylight autonomy analysis are transforming architectural design workflow
Introduction
In an age where climate-driven architecture is paramount, daylight performance remains central to both spatial experience and energy efficiency. Our project tackles this by combining IFC data, graph logic, and machine intelligence to create a facade design copilot. This system not only flags underperforming zones but suggests optimized interventions like adjusting window-to-wall ratios (WWR), adding shading devices, or rebalancing window orientation — and then loops through the process again for improved outcomes.
The project tackles one of architecture’s most persistent challenges: optimizing natural light distribution in complex building configurations while maintaining design integrity and spatial relationships. By converting traditional IFC (Industry Foundation Classes) building models into dynamic graph structures, this methodology opens unprecedented possibilities for automated design optimization and performance-driven architectural decision-making.
The Challenge: Beyond Traditional Daylight Analysis
Traditional daylight analysis often treats building elements in isolation, missing the complex interdependencies that exist between spatial units, openings, and their contextual relationships. While Spatial Daylight Autonomy (sDA) metrics provide valuable insights into individual space performance, they fail to capture the systemic patterns that could inform holistic design improvements. The research team recognized that buildings function as interconnected systems where the performance of one unit directly influences its neighbors—a perfect scenario for graph-based analysis.
The project’s core objective was ambitious yet clear: to identify clusters of low SDA units using node similarity and explore design improvements through automated optimization loops. This approach shifts the paradigm from reactive problem-solving to predictive design intelligence, where potential issues are identified and resolved before they manifest in built environments.
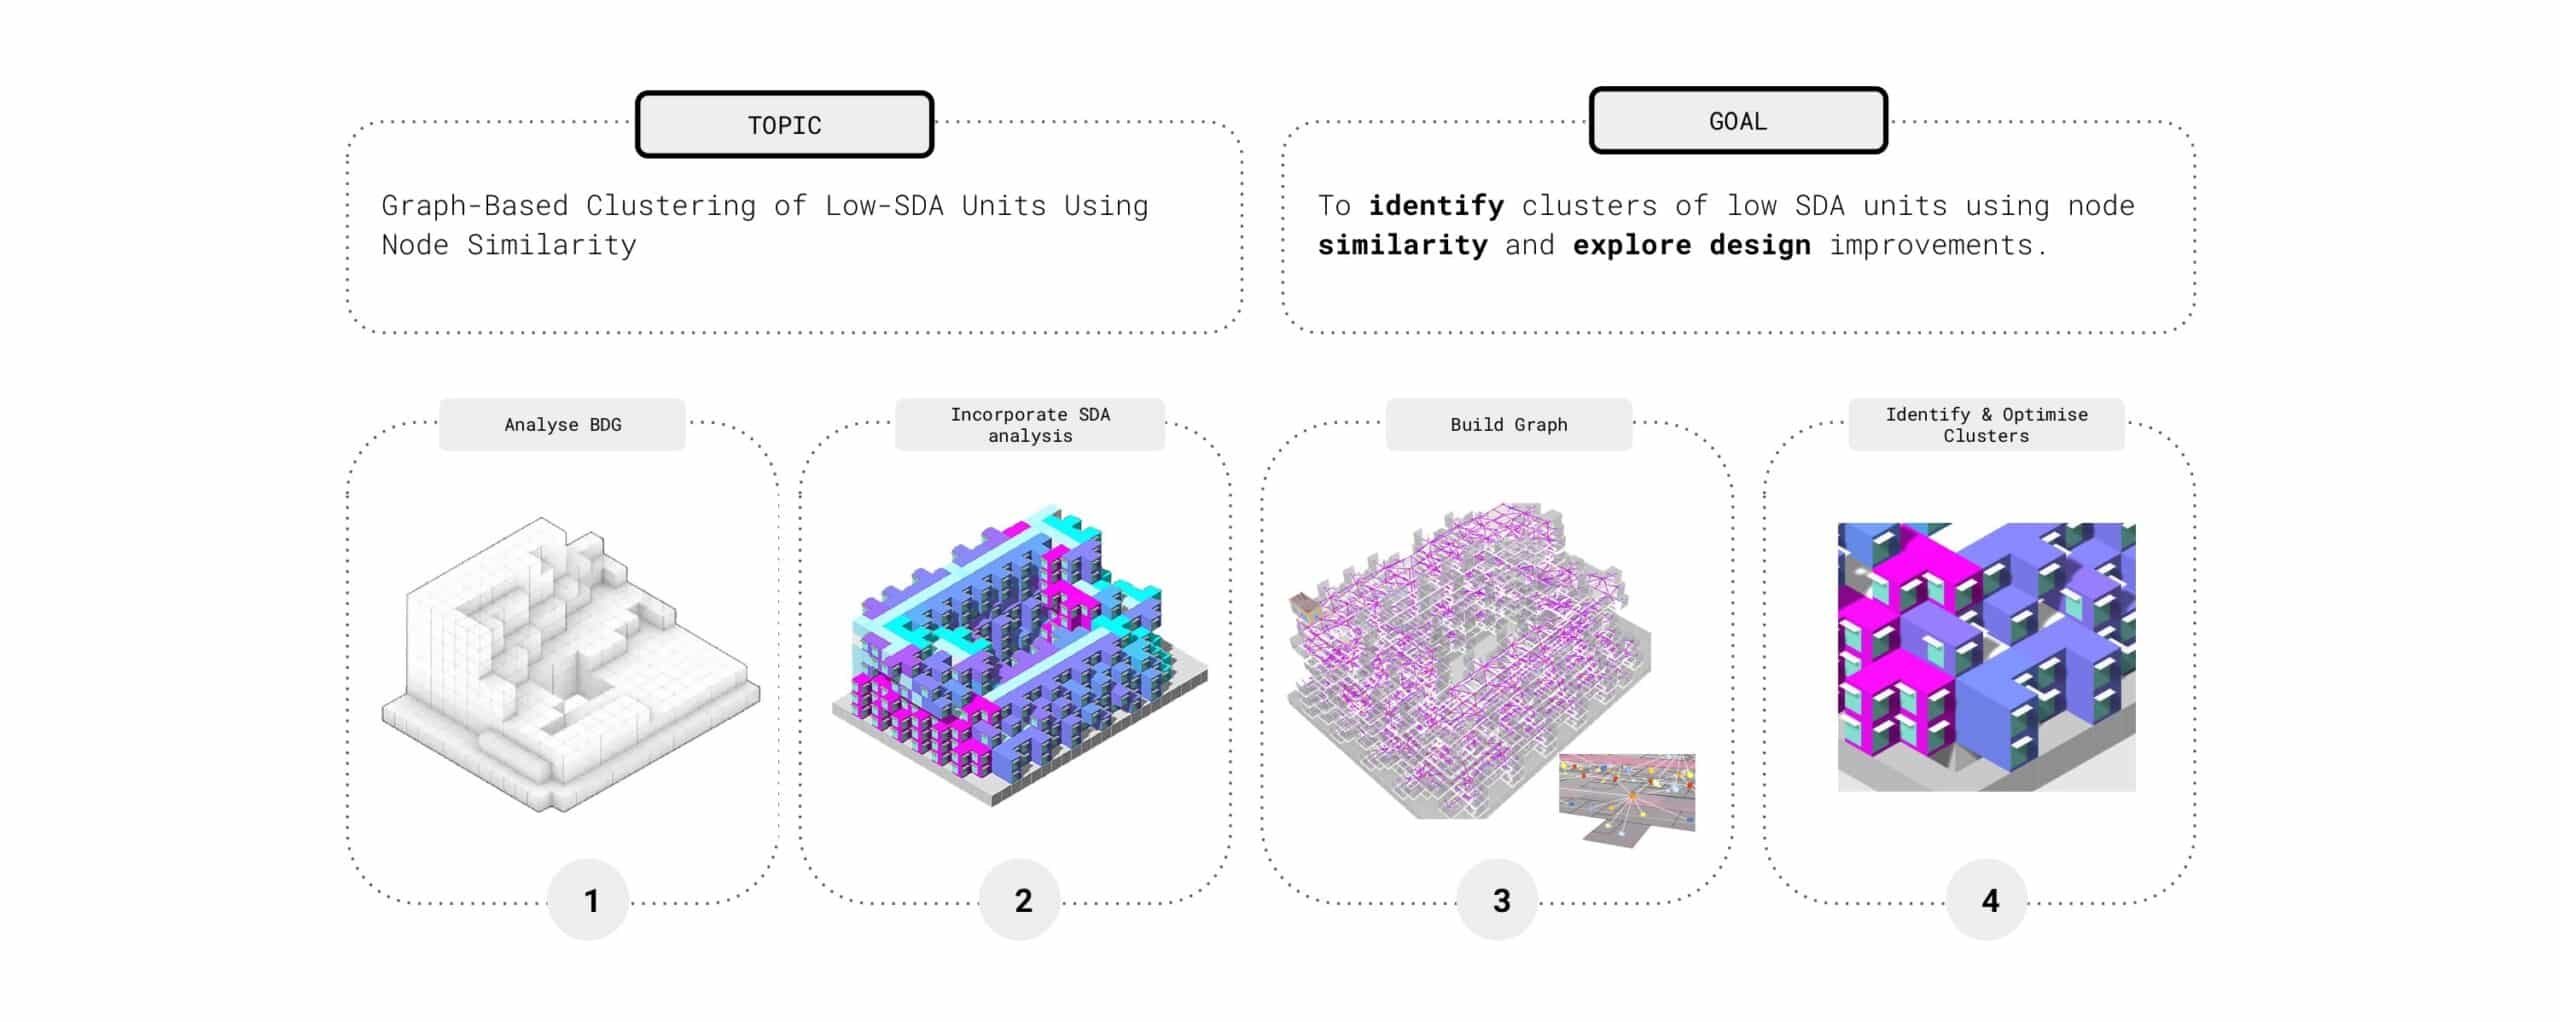
Caption – Goals and objective of the topic
Project Goal
The project set out with a clear ambition:
To identify clusters of low-SDA units using node similarity and propose design optimizations.
Rather than treating rooms or modules as isolated instances, our approach visualizes them as interconnected graph nodes — capturing their relationships, behaviors, and performance as a network. This enabled us to address performance issues not only locally but contextually.
Technical Methodology: From IFC to Intelligent Graphs
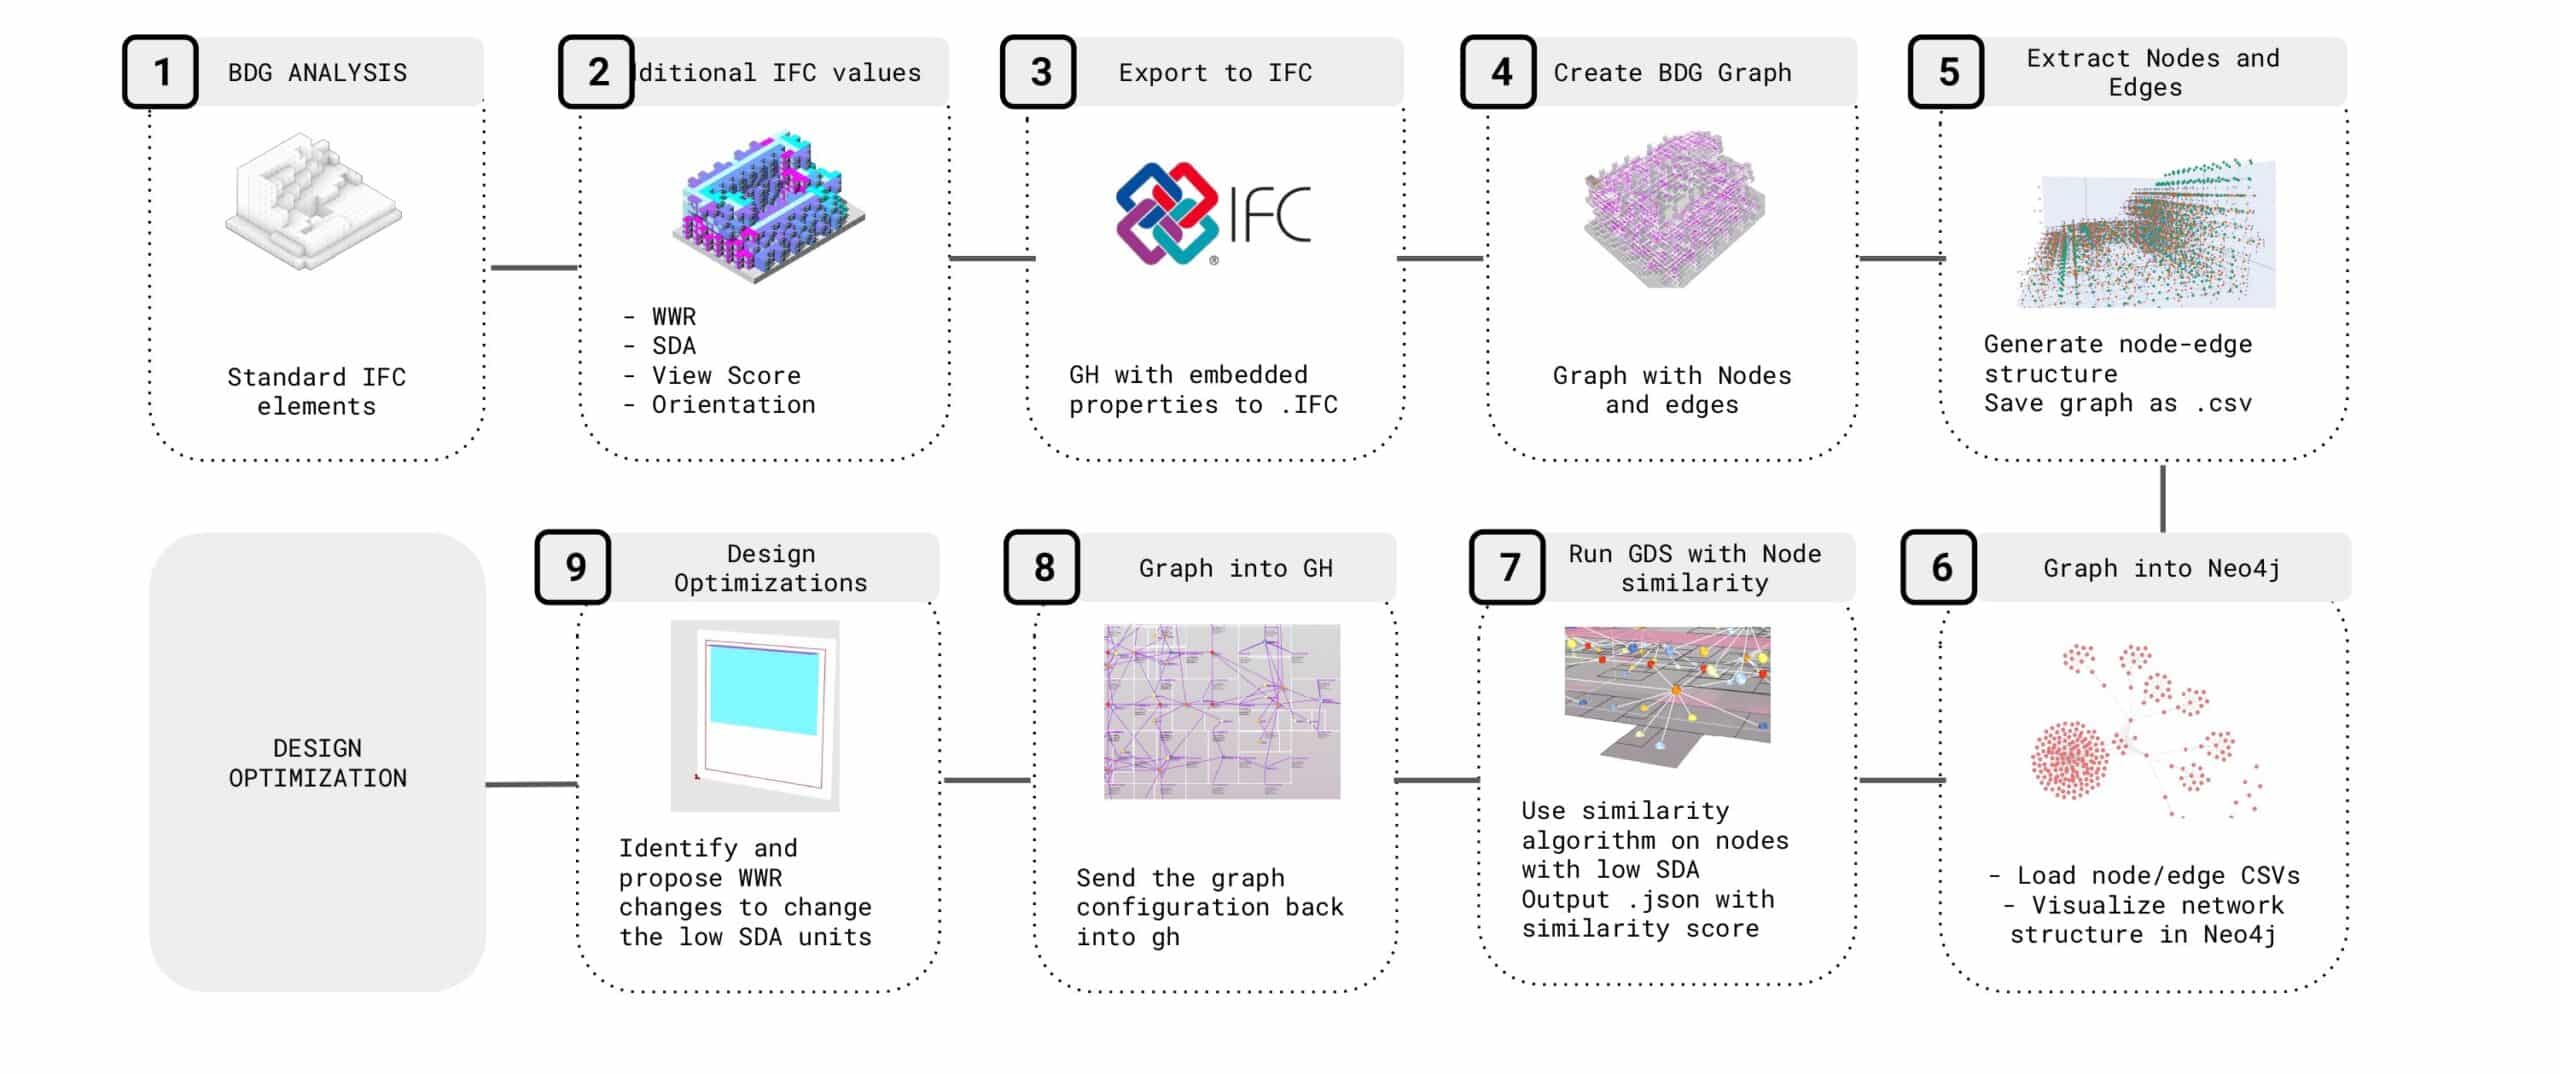
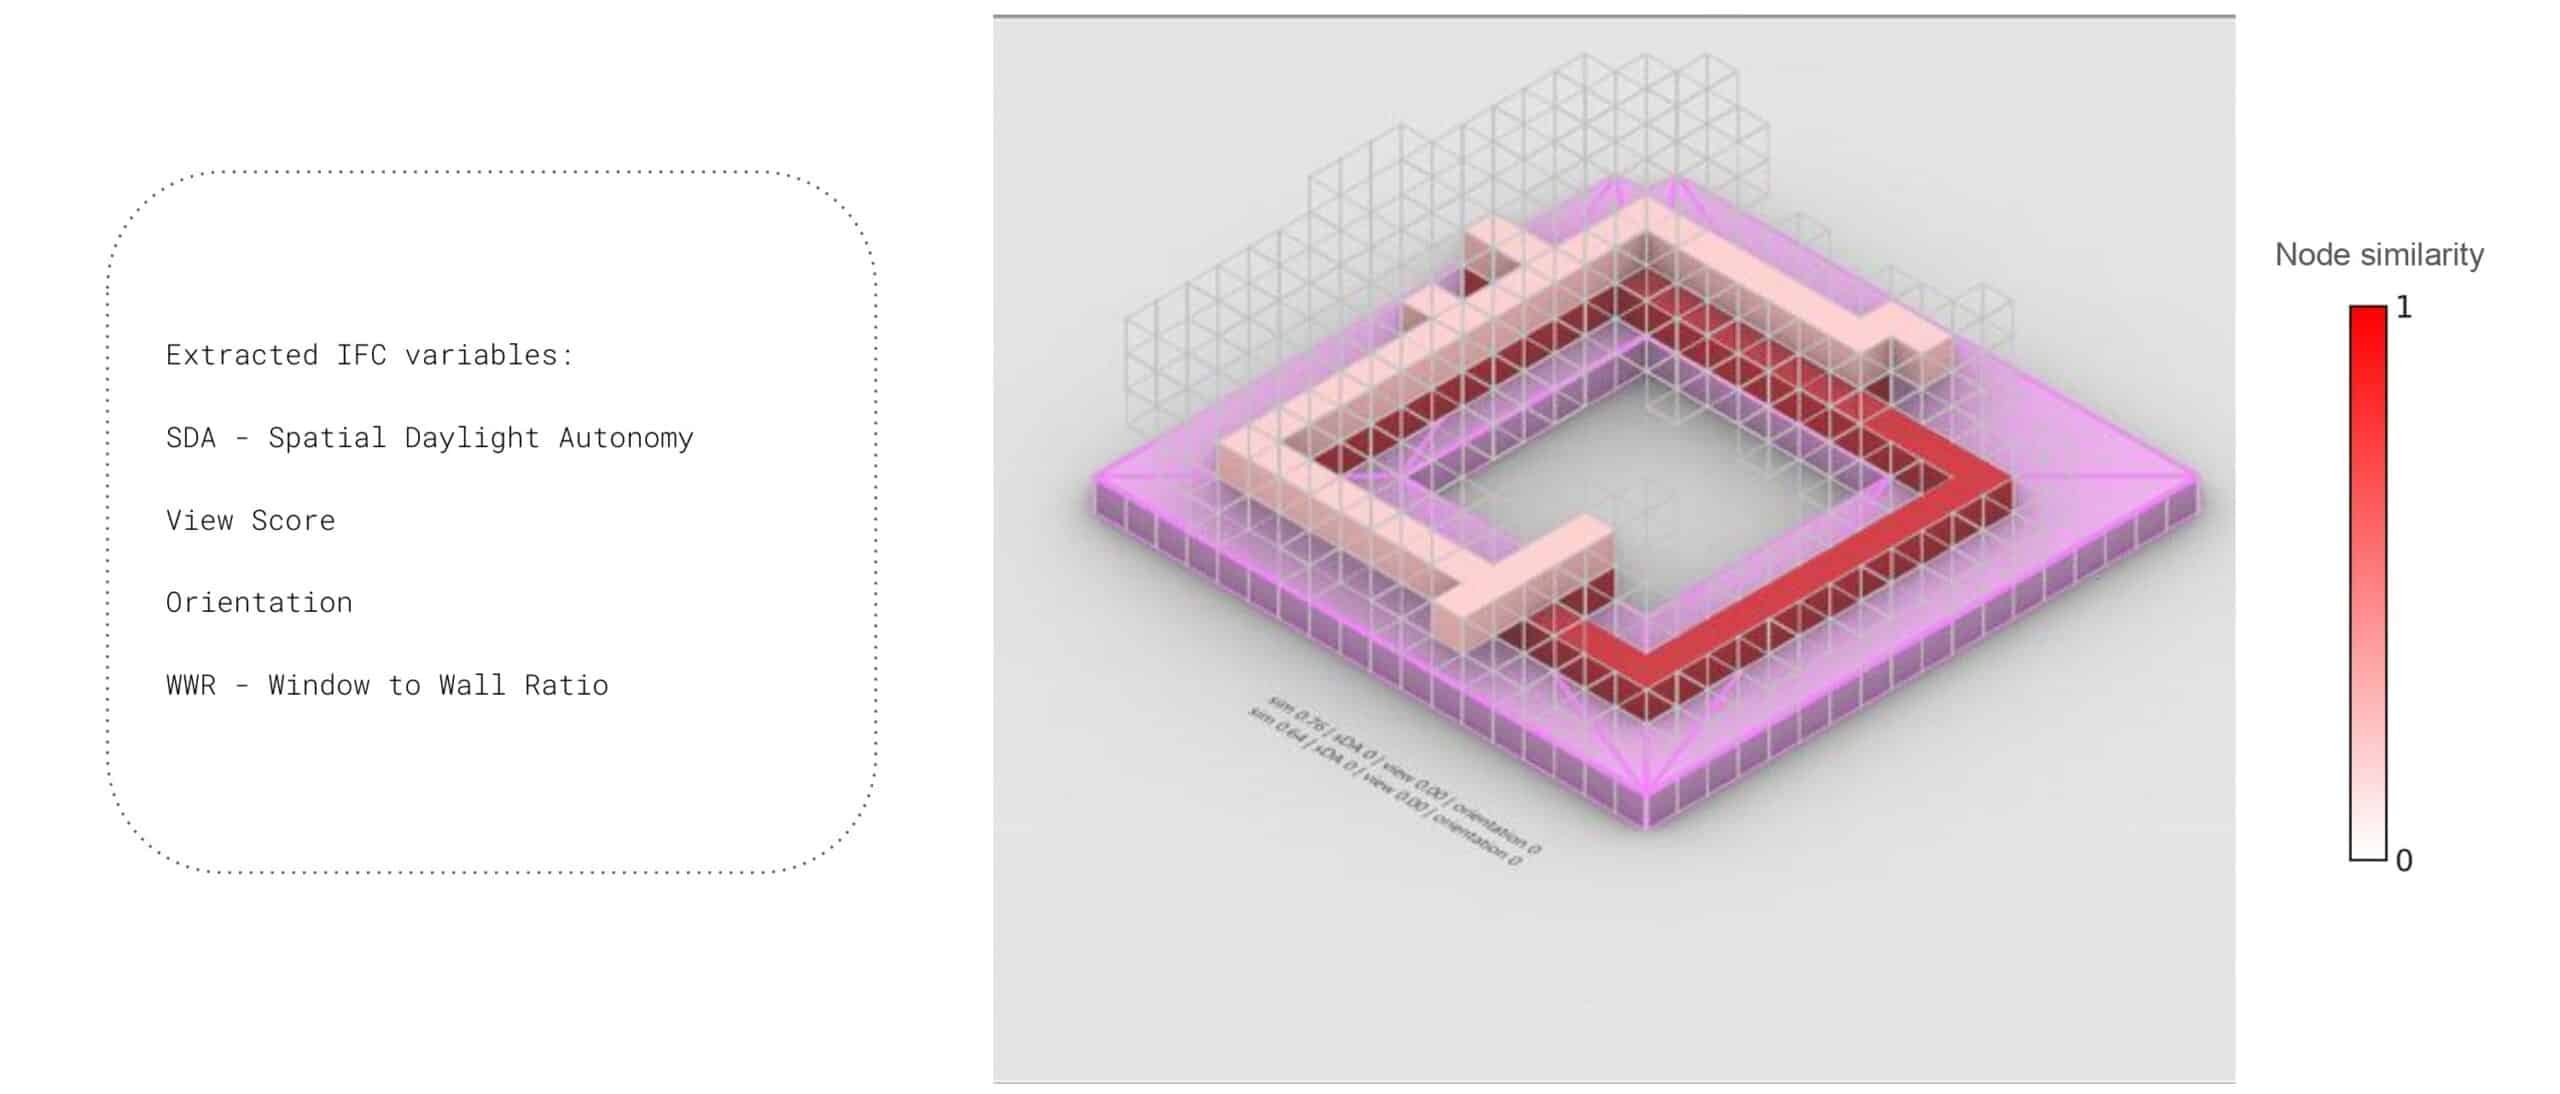
Phase 1: Building Data Graph (BDG) Creation and Analysis The technical workflow begins with the creation of a comprehensive Building Data Graph (BDG) that captures both geometric and performance data. The team developed a sophisticated pipeline that extracts standard IFC elements and enriches them with critical performance metrics including Window-to-Wall Ratio (WWR), Spatial Daylight Autonomy (sDA), View Score, and Orientation data.
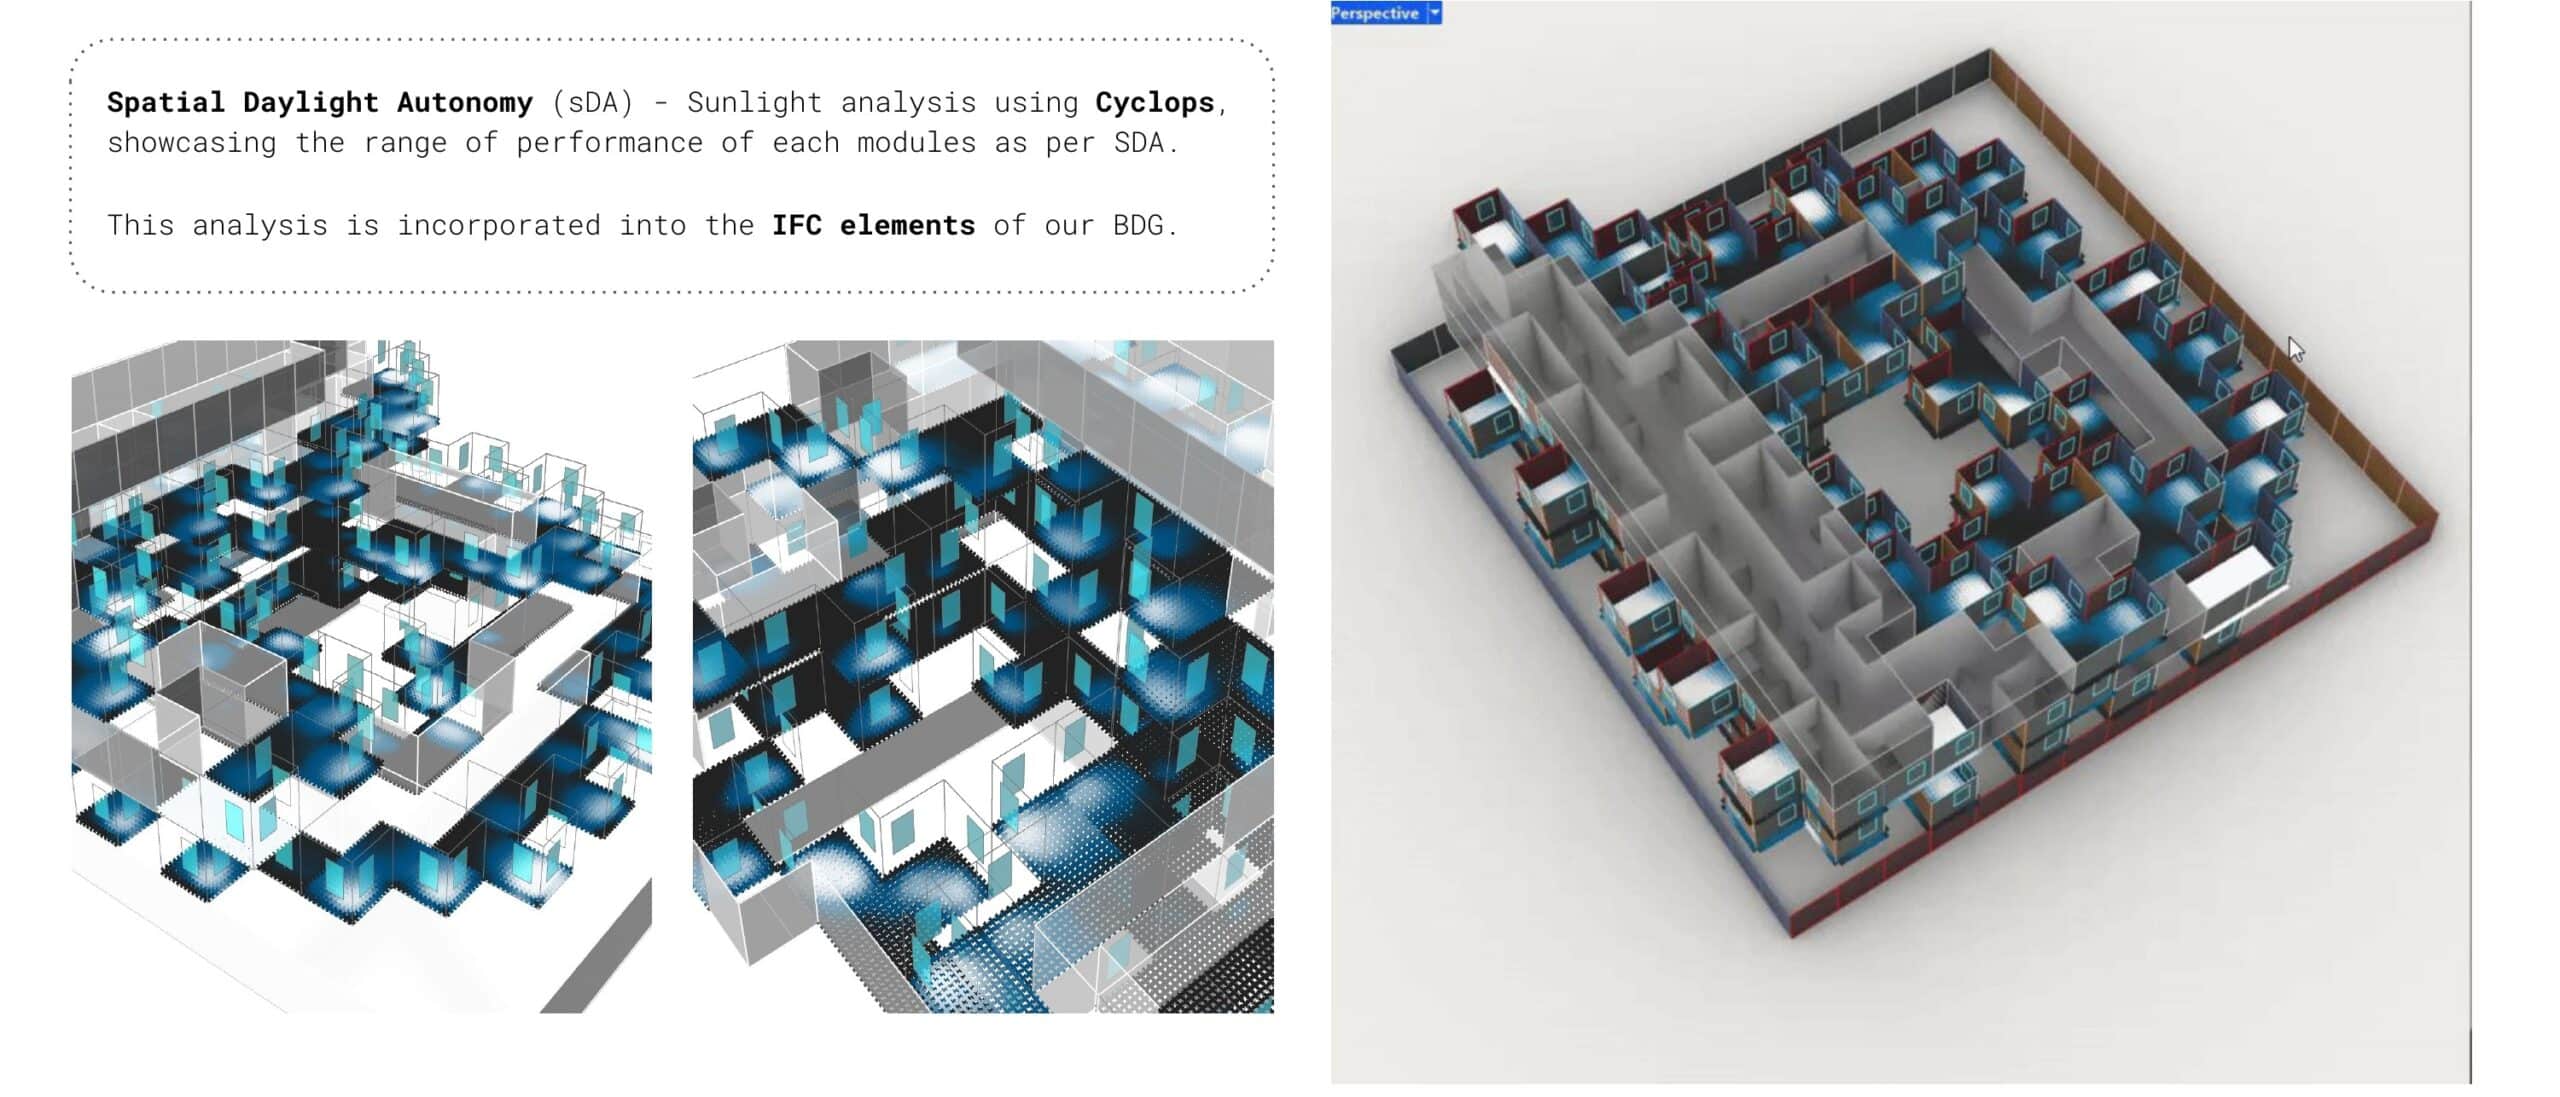
Phase 2: SDA Integration and Performance Mapping Spatial Daylight Autonomy analysis was conducted using Cyclops, providing detailed insights into the daylight performance of each module. This analysis goes beyond simple illumination levels, incorporating temporal variations and spatial distribution patterns that affect occupant comfort and energy consumption. The sDA values are directly embedded into the IFC elements, creating a performance-aware building model that serves as the basis for graph analysis.
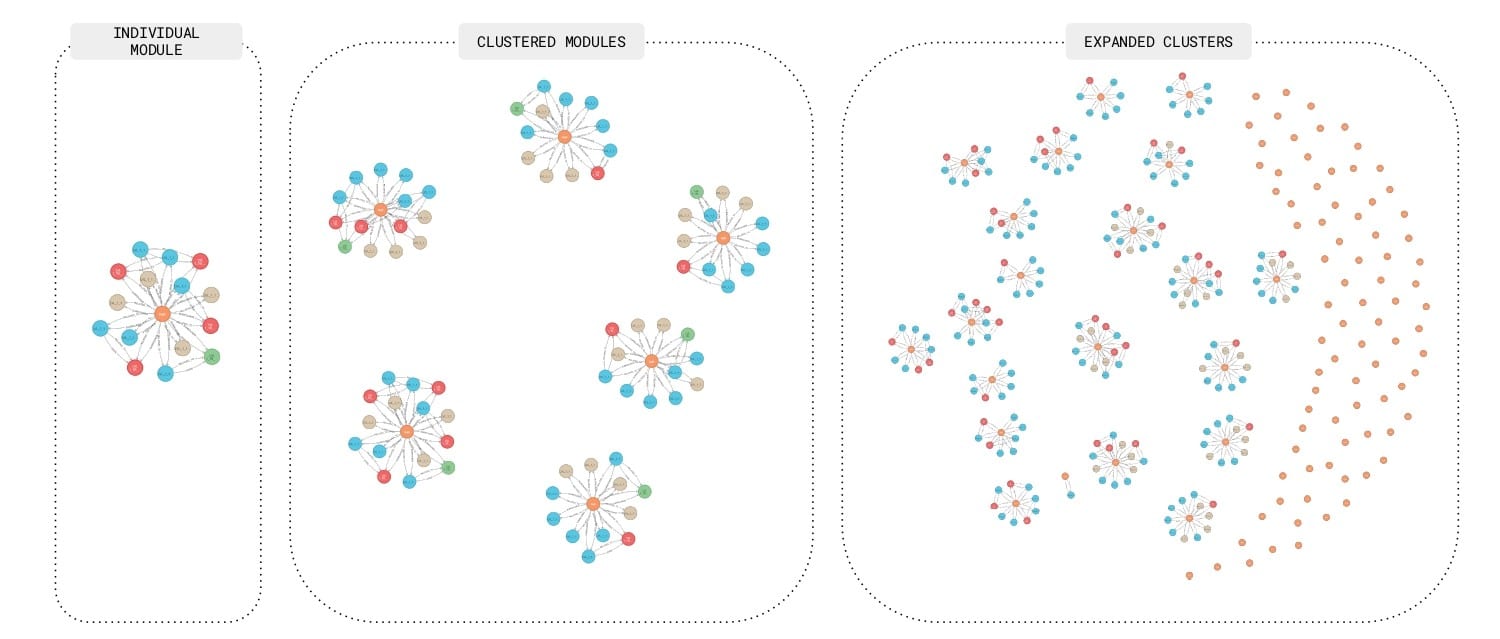
Phase 3: Graph Formulation and Structure The graph formulation logic demonstrates sophisticated understanding of building hierarchies and relationships. The structure organizes elements from individual components (windows, doors) to spatial units (bedrooms, living areas) to complete modules (2B_Module, 3B_Module), creating a multi-layered network that captures both physical and functional relationships.
Phase 4: Neo4j Integration and Graph Analytics The transformation from building model to graph database represents a crucial step in the methodology. Neo4j provides the robust graph analytics capabilities necessary for complex similarity calculations and community detection algorithms. The nodes and edges extracted from the IFC model are imported into Neo4j while preserving all embedded parameters and relationship data. The Neo4j implementation enables sophisticated queries that can identify patterns across multiple building attributes simultaneously. For example, the system can find all windows with similar orientation, WWR, and sDA values, regardless of their physical location in the building. This capability is essential for identifying optimization opportunities that might be missed by traditional analysis methods.
Phase 5: Node Similarity Analysis and Clustering The node similarity analysis represents the project’s most innovative contribution. Using Graph Data Science (GDS) algorithms, the system identifies nodes with similar performance characteristics, particularly focusing on units with low sDA values. This similarity calculation considers multiple attributes simultaneously, including spatial daylight autonomy, view scores, orientation, and window-to-wall ratios.
Phase 6: Cypher Queries and Feature Extraction The Cypher query language enables sophisticated data extraction and pattern matching within the graph structure. The team developed custom queries to identify specific performance scenarios, such as finding all low-sDA units with similar characteristics or locating windows that share performance attributes across different modules.
BDG Customization | IFC & sDA Analysis
Here, we delve into Spatial Daylight Autonomy (sDA), a key metric for WindowLoop. Using a tool called Cyclops, WindowLoop performs sunlight analysis to evaluate the daylight performance of each building module. The results are embedded into the IFC elements of the Building Design Graph (BDG), allowing WindowLoop to track and visualize sDA across the facade. This slide highlights how WindowLoop integrates simulation data to inform its design recommendations, ensuring facades maximize natural light while minimizing glare.
BDG Customization | Additional IFC Features
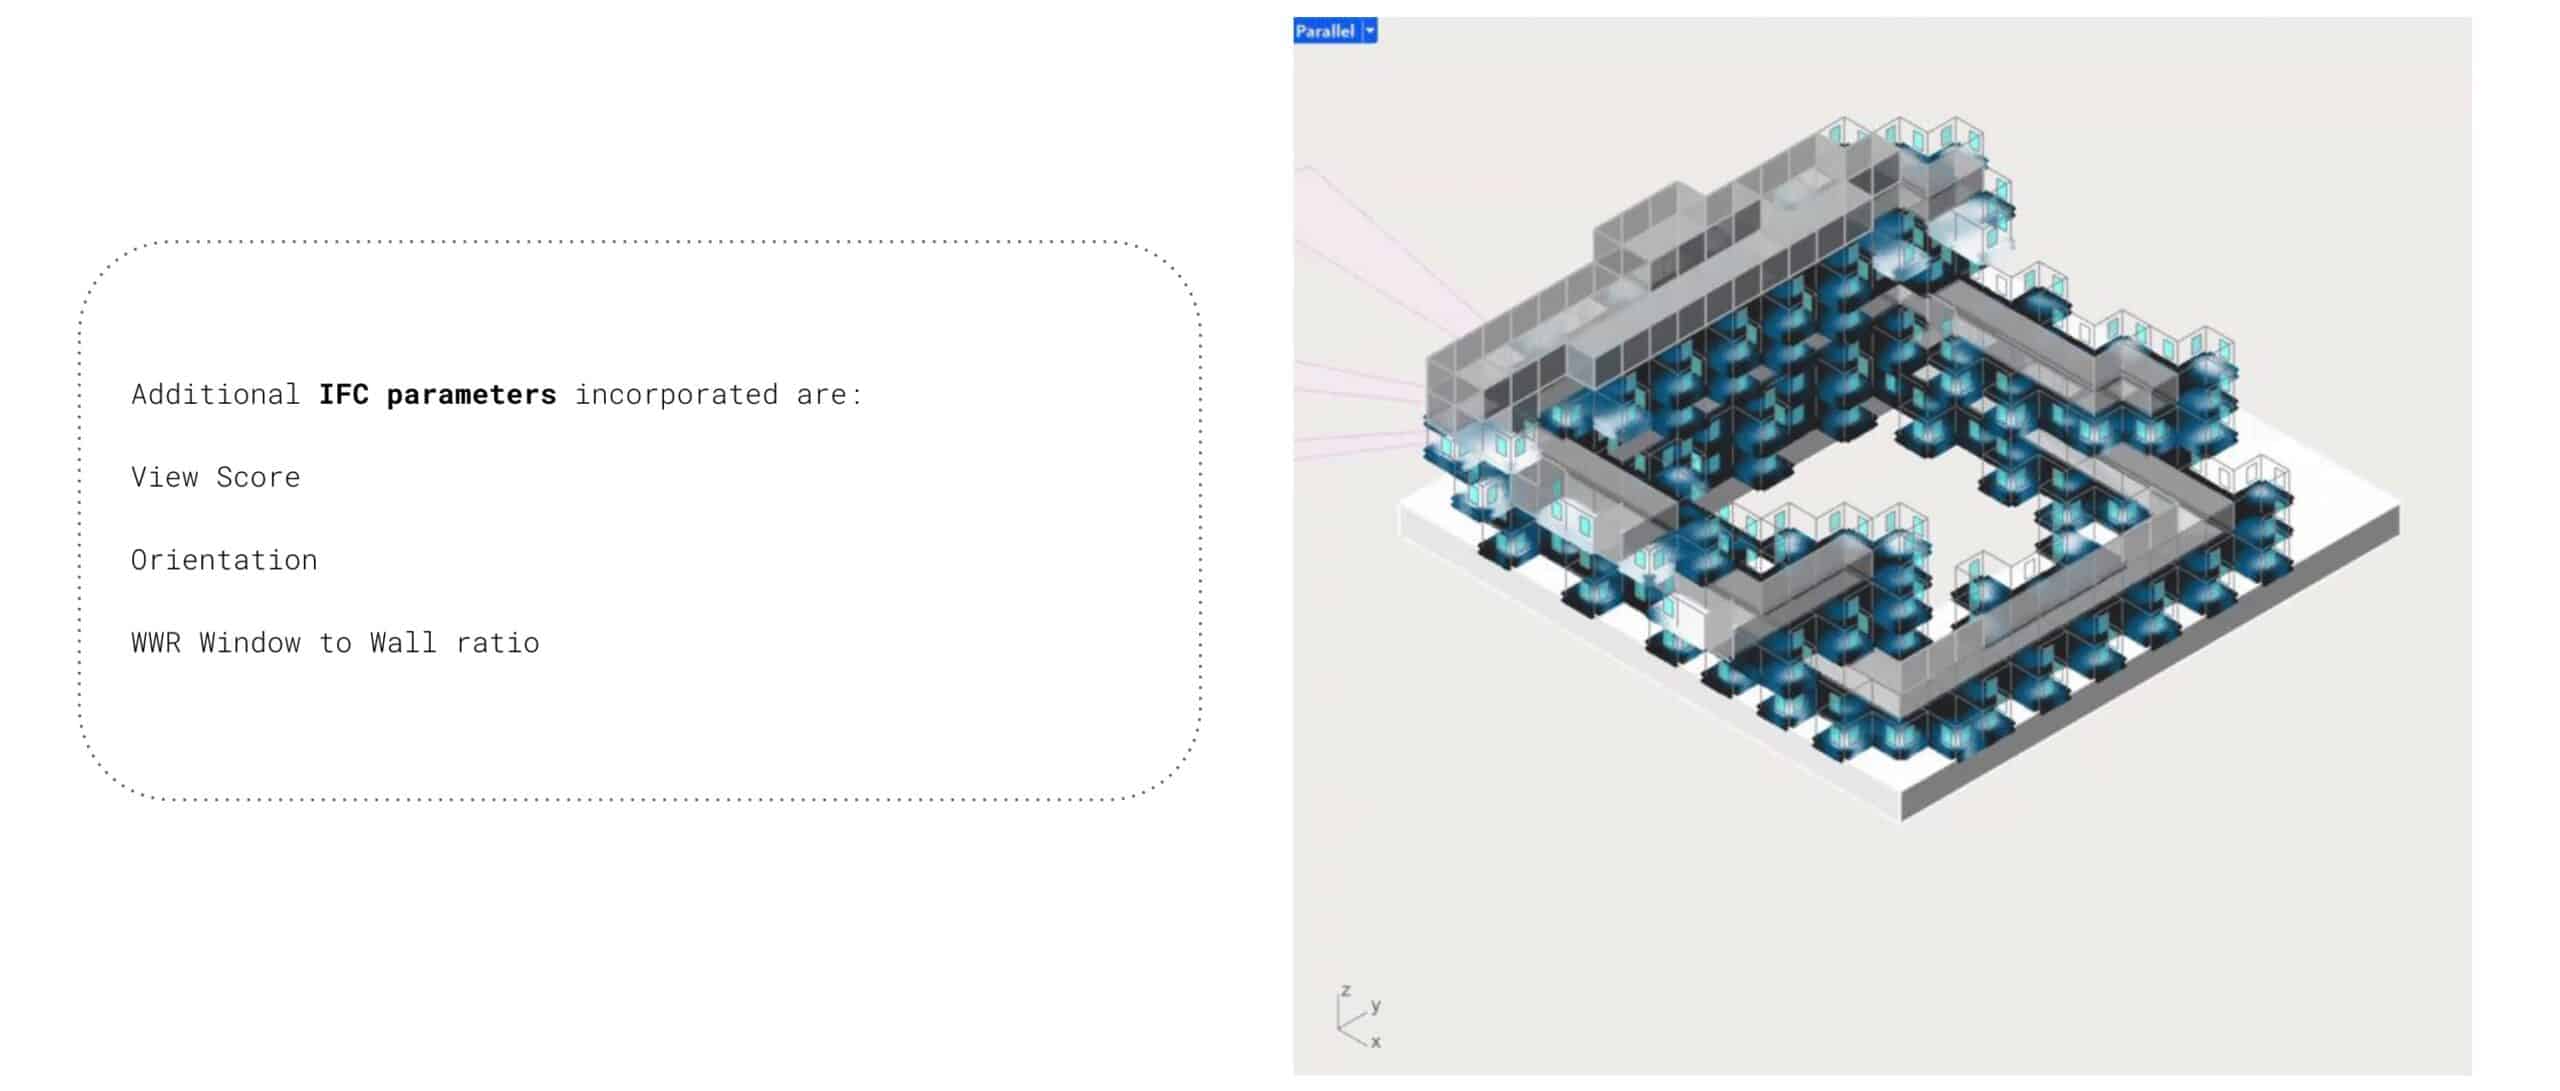
This slide details the additional IFC parameters WindowLoop incorporates:
- View Score: Measures the quality of views from each window.
- Orientation: Tracks the facade’s directional exposure to sunlight.
- Window-to-Wall Ratio (WWR): Quantifies the proportion of glazing to solid wall.
These parameters enable WindowLoop to provide holistic facade optimization. For example, if a low-sDA area has a high WWR but poor orientation, WindowLoop might suggest shading solutions or balcony additions to balance daylight and thermal comfort.
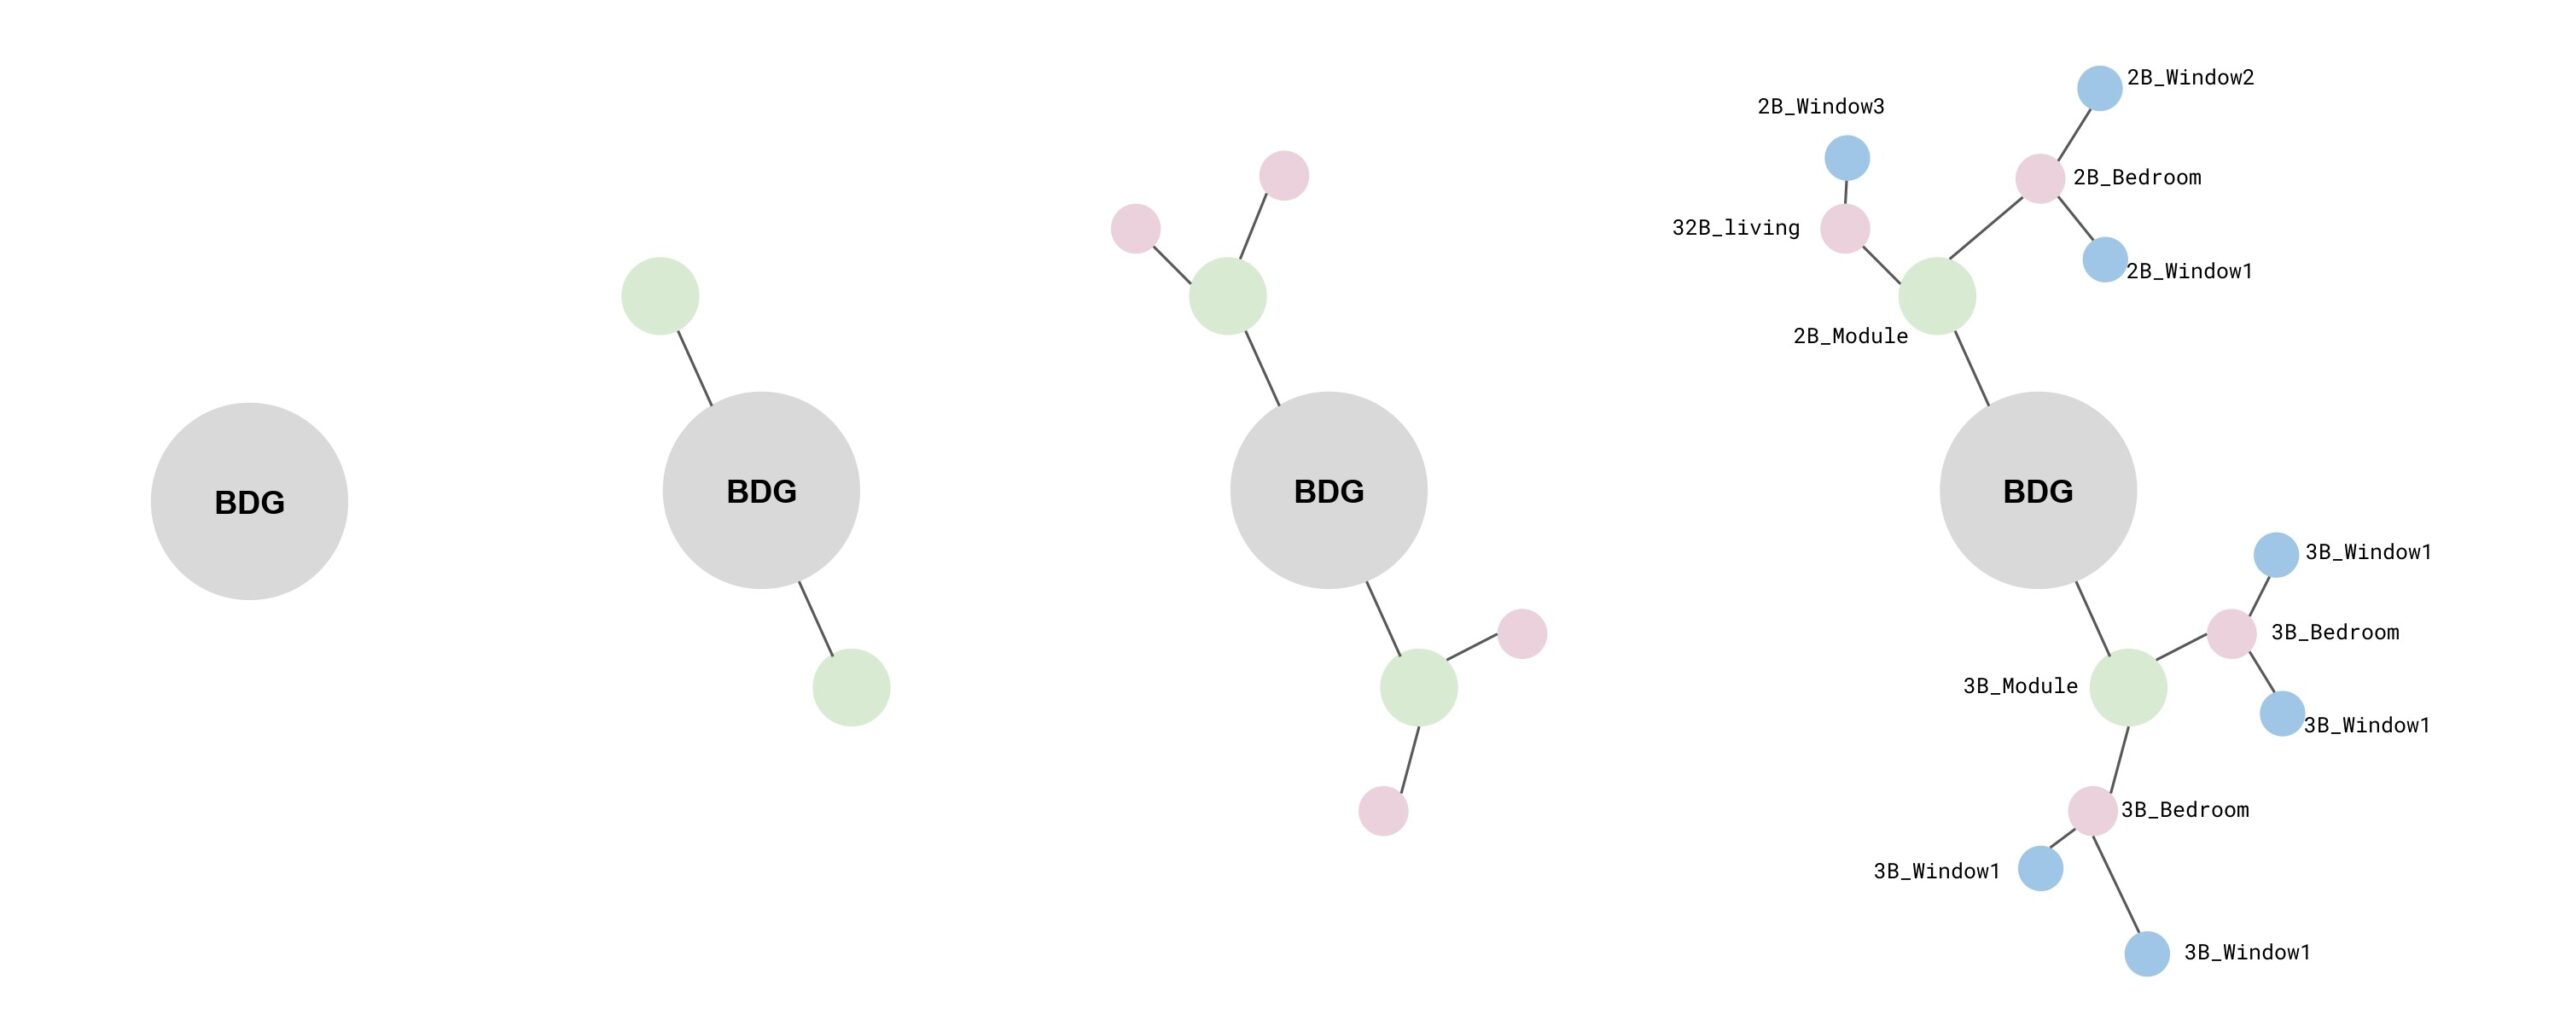
Graph Formulation Logic for BDG
This slide showcases the graph formulation logic, illustrating how WindowLoop represents building elements (e.g., “28_Window1,” “28_Bedroom”) as nodes in a graph. By mapping relationships between windows, rooms, and facades, WindowLoop creates a structured BDG that supports similarity analysis. This logic is critical for identifying clusters of underperforming units, allowing WindowLoop to focus its design interventions on specific facade areas.
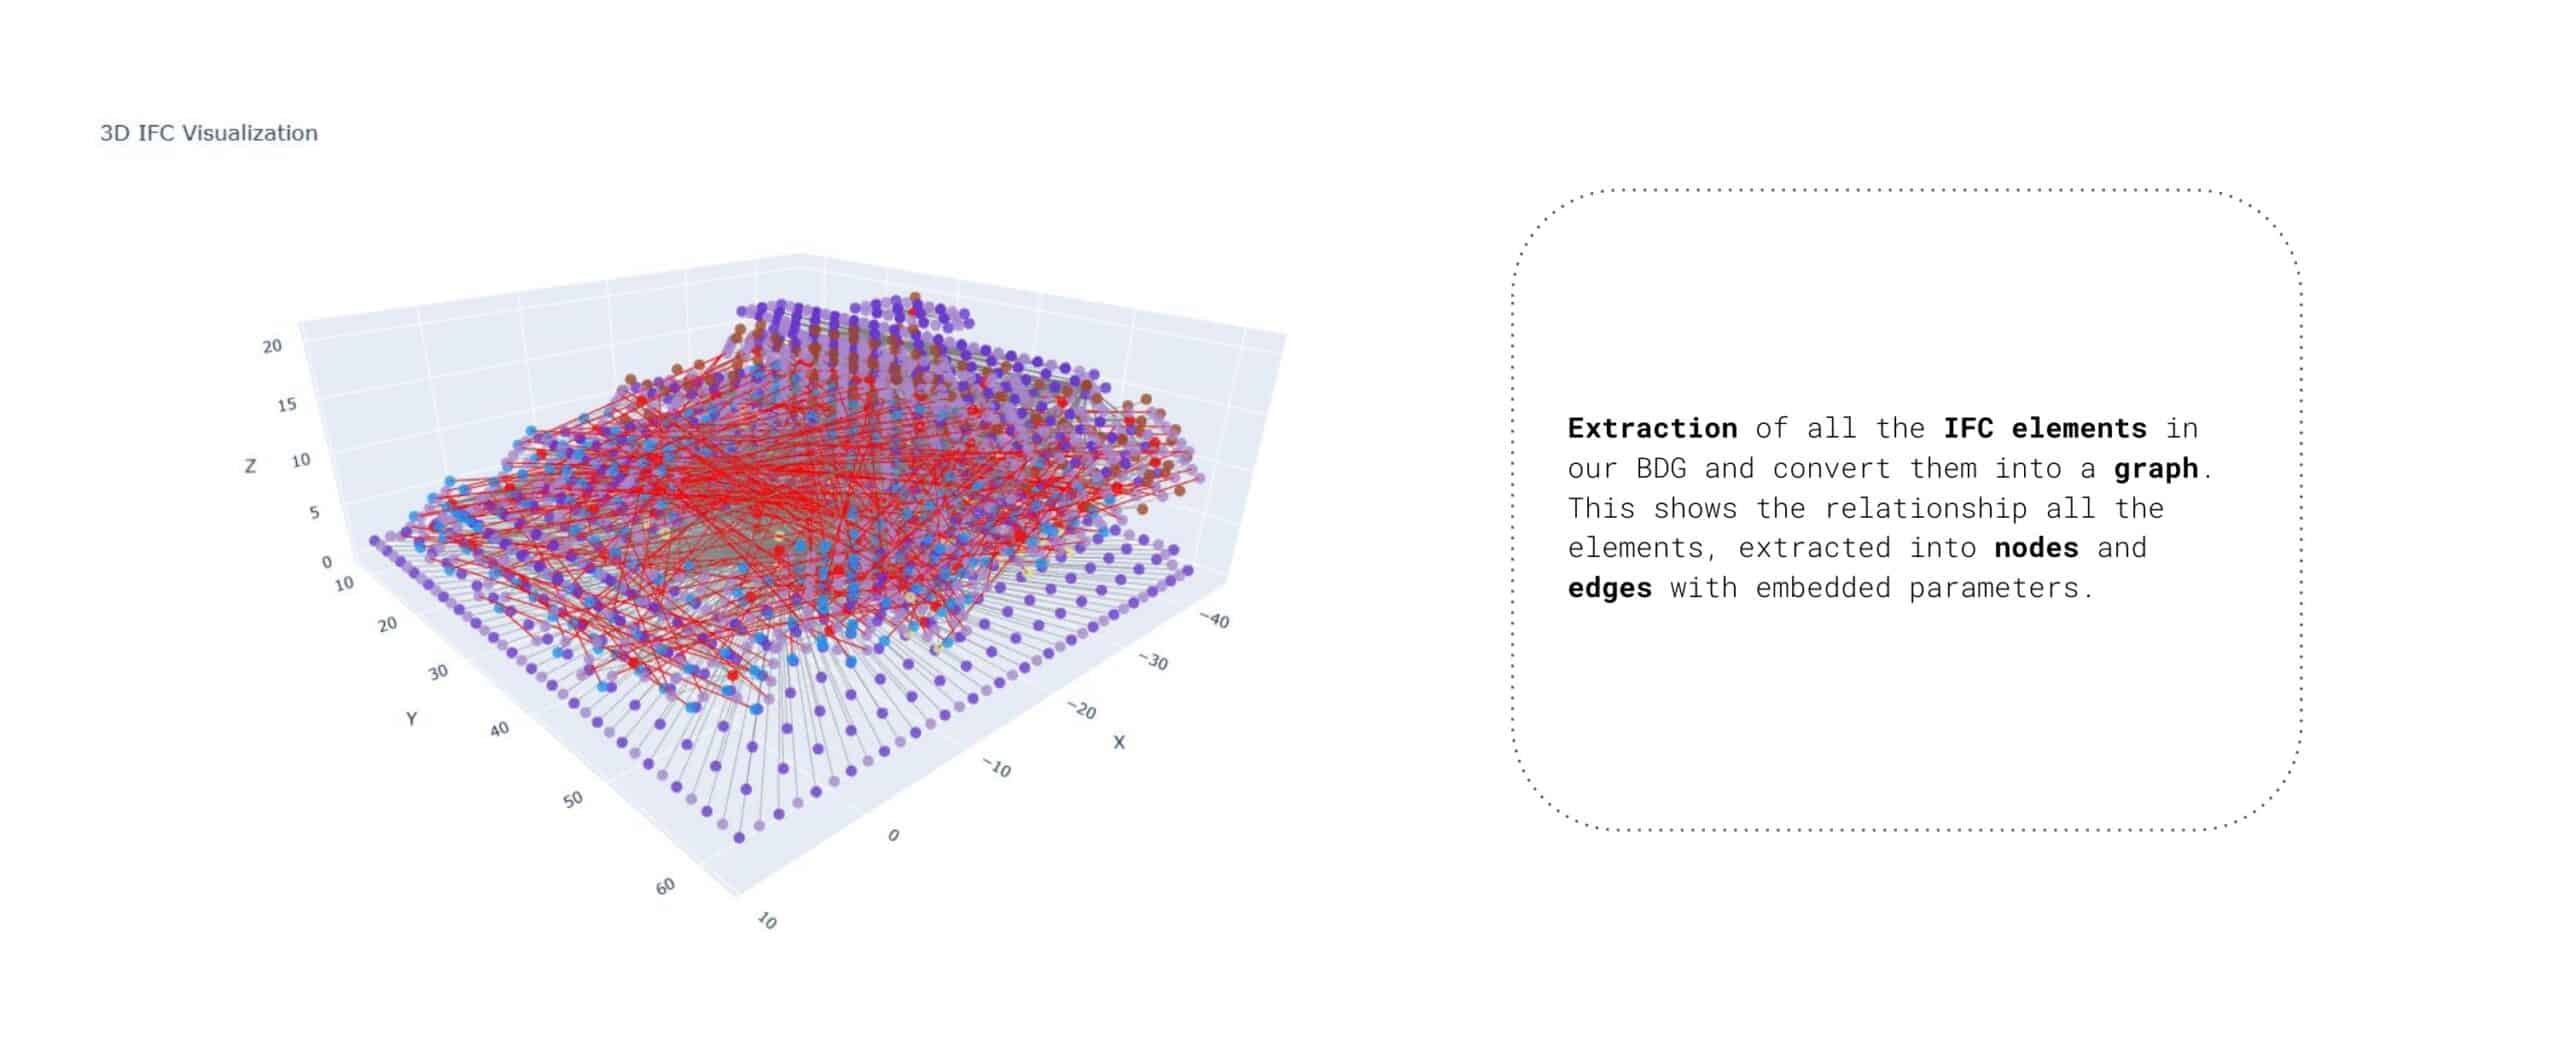
IFC to Graph
The transition from IFC to graph is visualized here, with repeated references to “3D IFC Visualization.” This slide emphasizes WindowLoop’s ability to convert complex building models into interactive graph formats, enabling detailed analysis of facade components. By saving the graph as an HTML file, WindowLoop ensures designers can explore the BDG interactively, aligning with its user-friendly interface for style selection and simulation review.
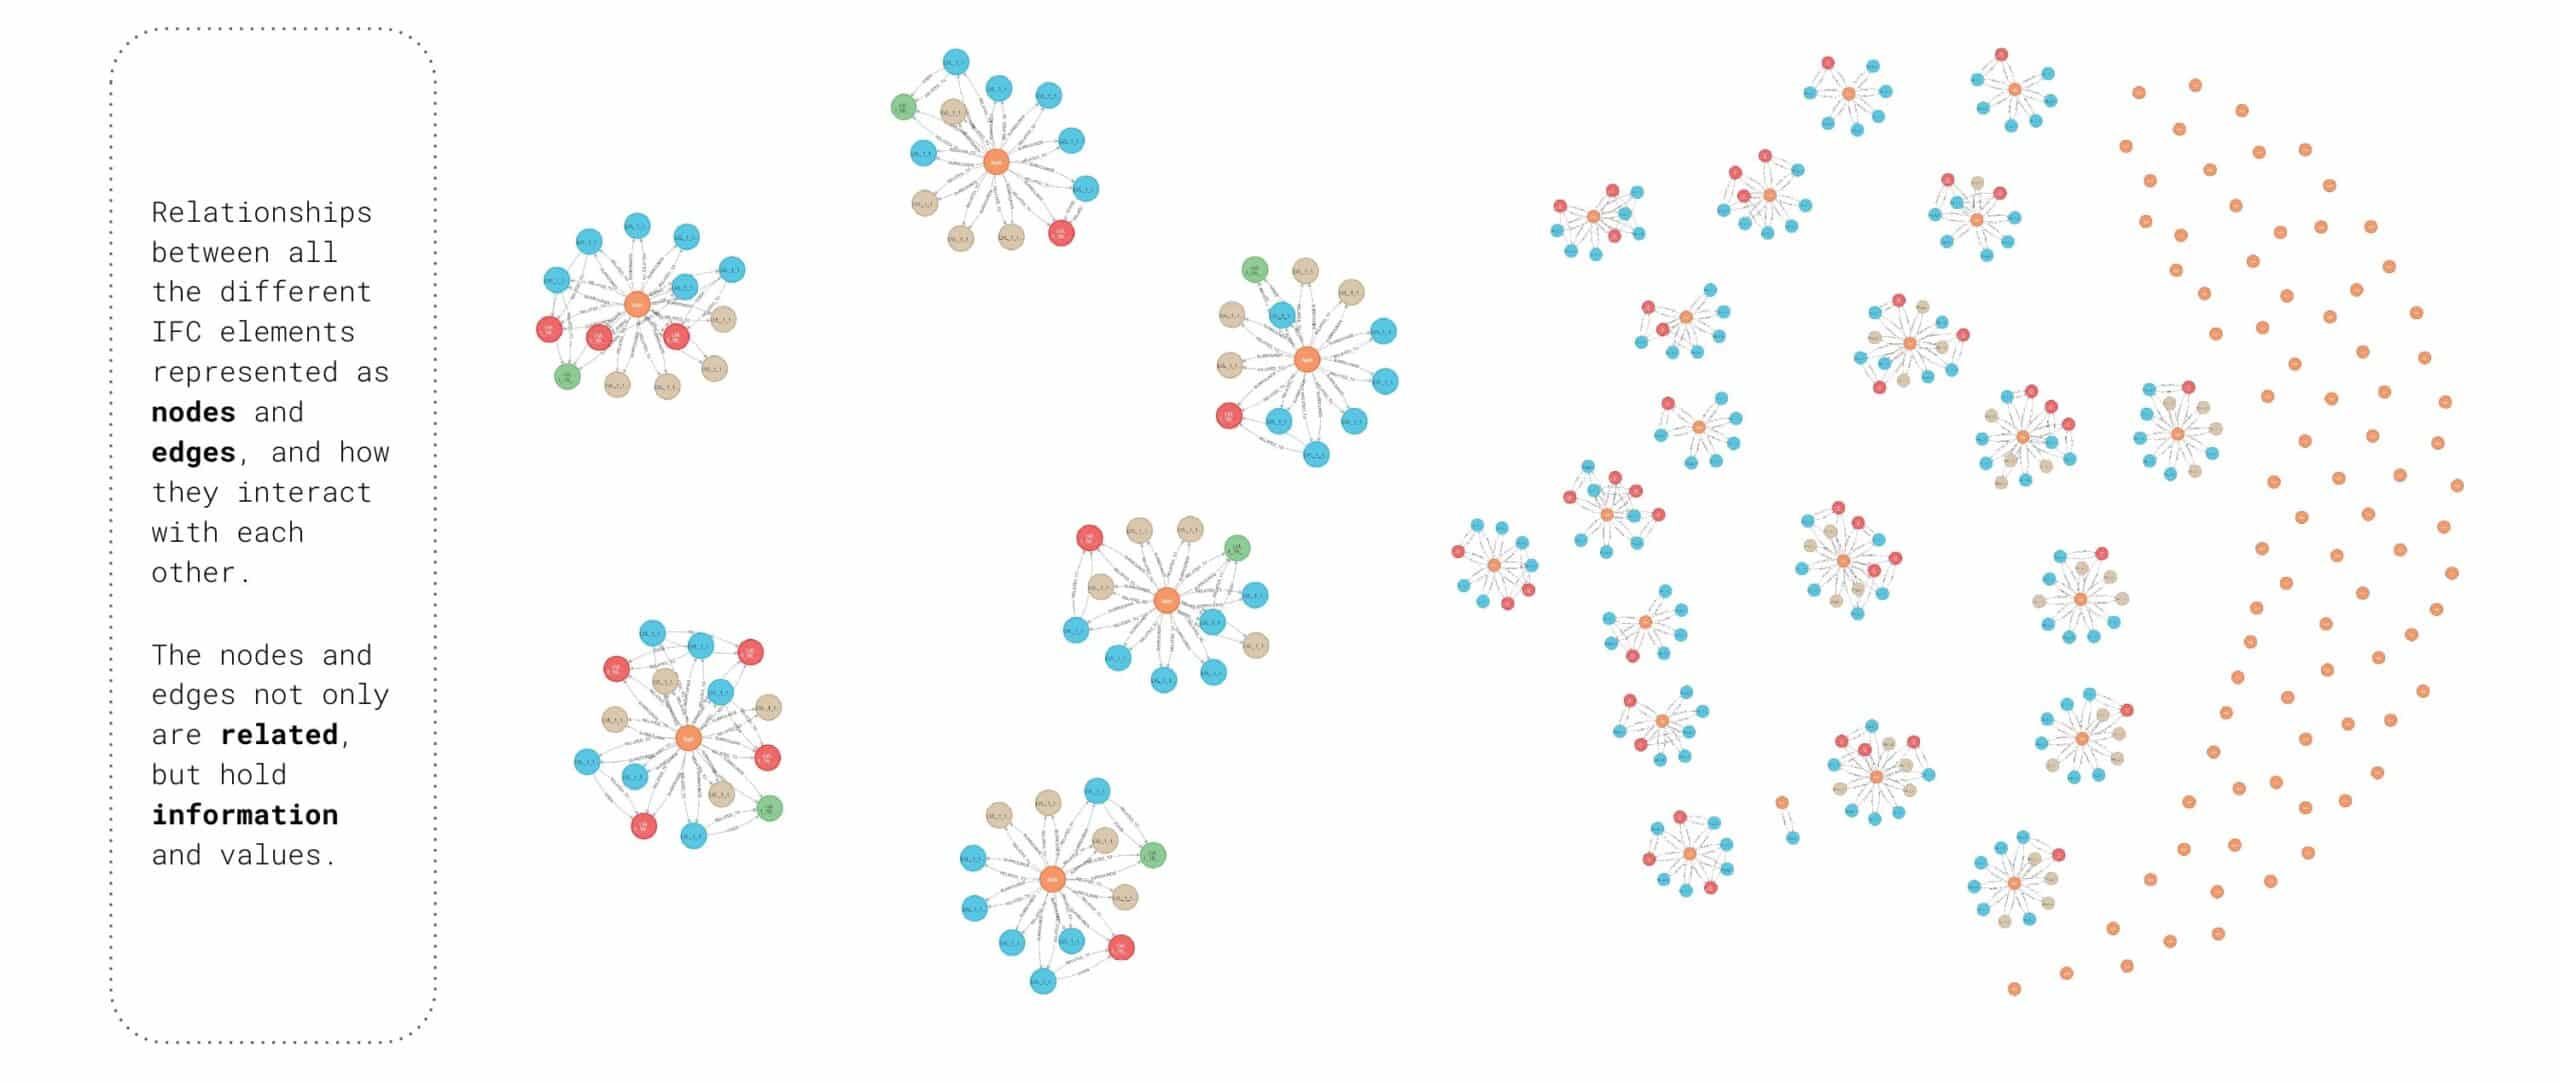
Graph to Neo4j: Nodes and Edges
This slide marks the integration of the BDG into Neo4j, a graph database platform. WindowLoop uses Neo4j to store nodes (e.g., windows, rooms) and edges (e.g., spatial relationships) for advanced querying. This setup enables the node similarity algorithms that identify low-sDA clusters, a key feature of WindowLoop’s iterative design process.
Graph to Neo4j: Analysis
Focusing on analysis within Neo4j, this slide underscores WindowLoop’s use of graph algorithms to process facade data. By analyzing node similarity, WindowLoop groups units with similar daylight issues, streamlining the identification of areas needing design tweaks. This analysis feeds into the copilot’s suggestion engine, which proposes solutions like adjusting WWR or adding external shading.
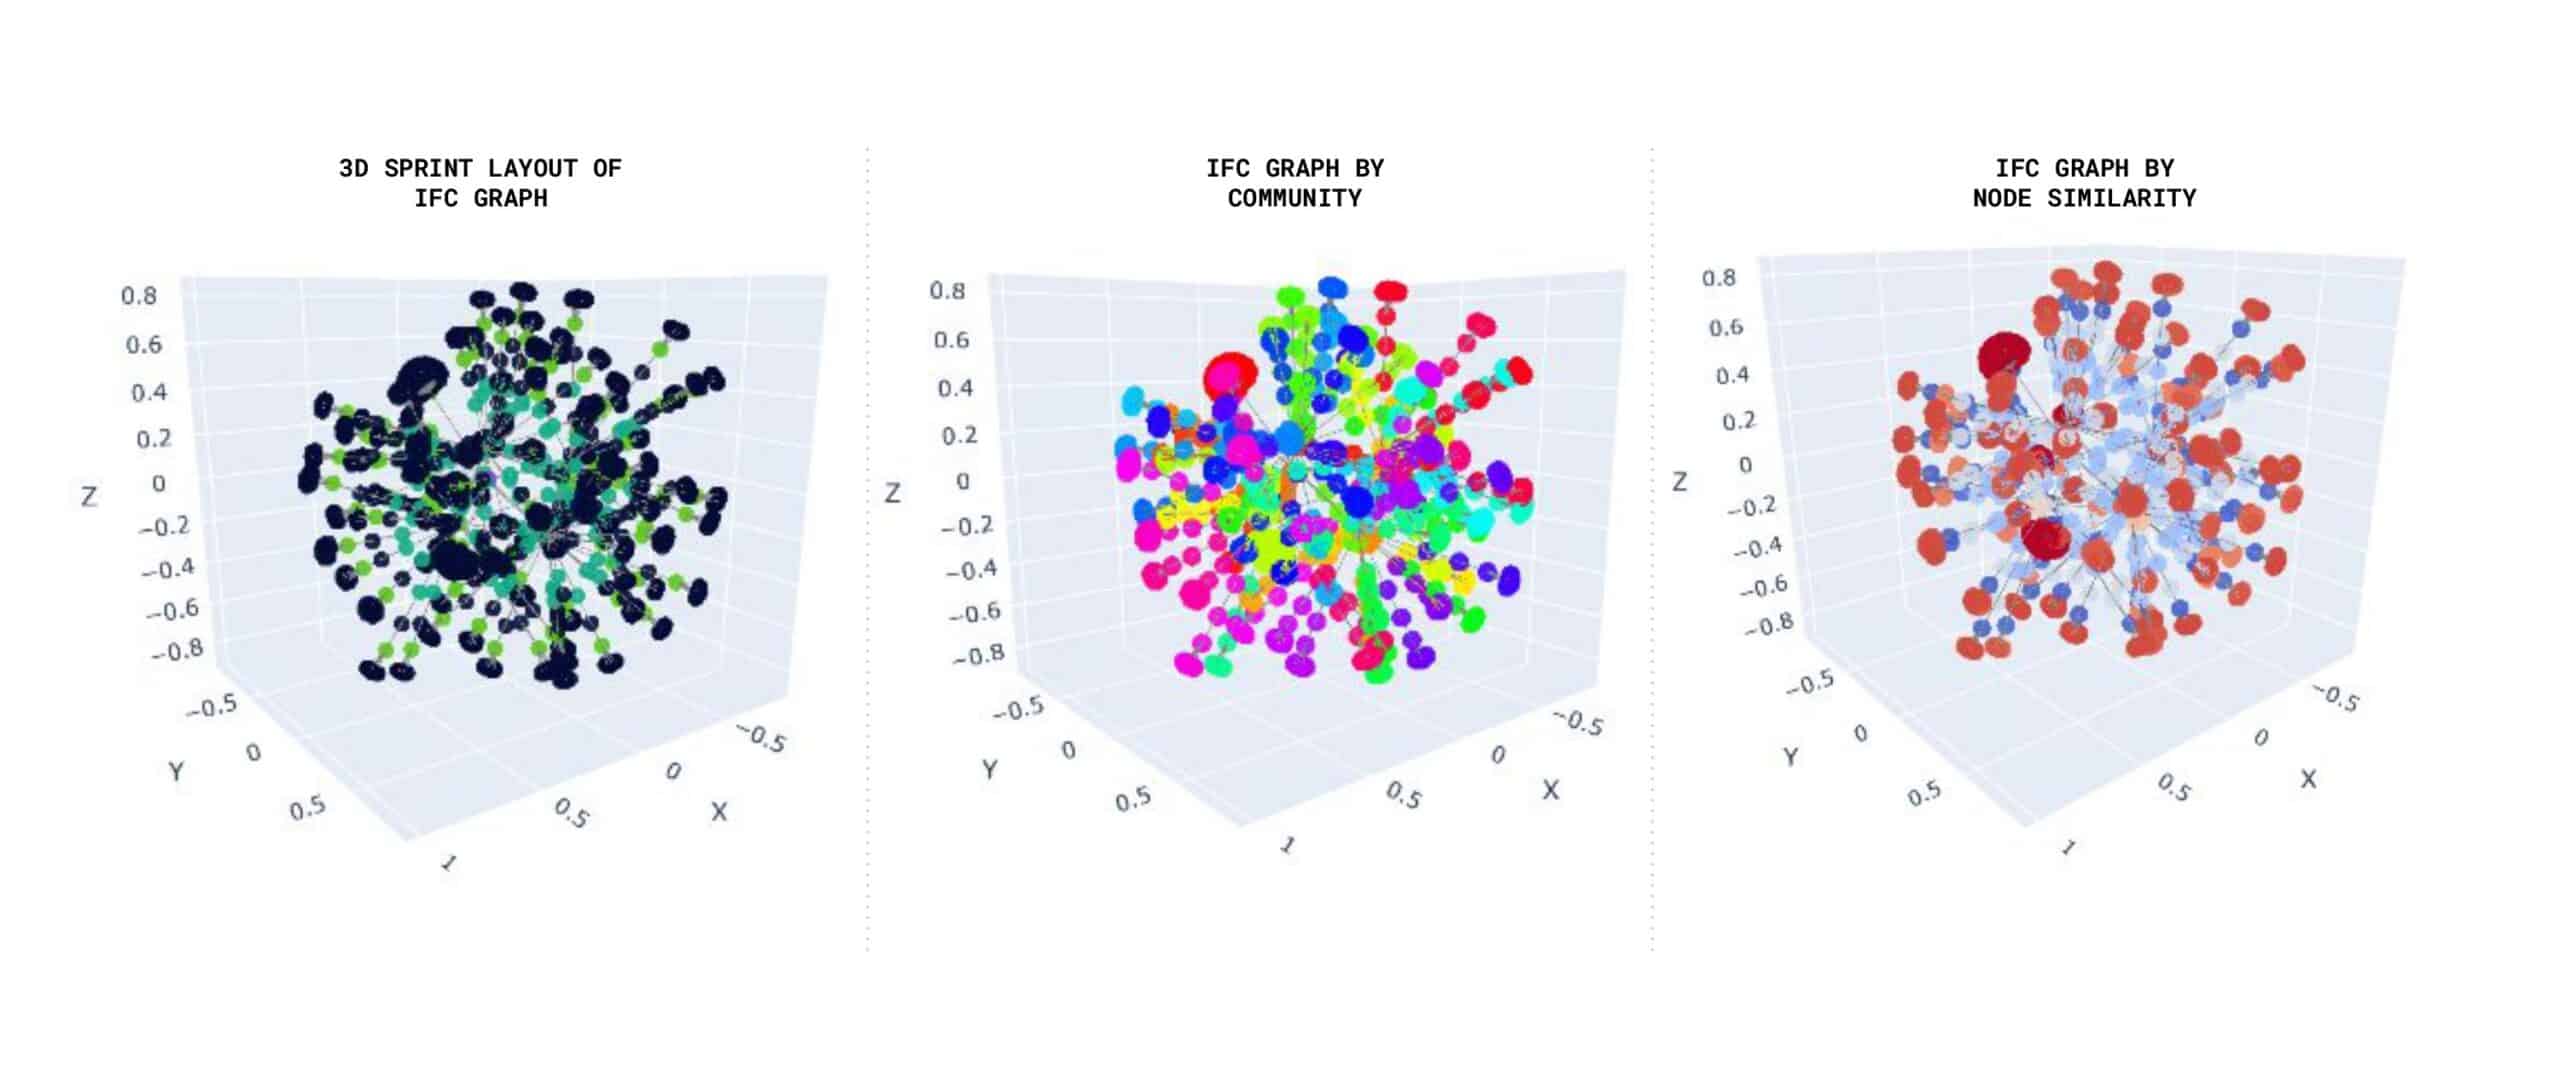
Neo4j: Cypher Extracted Features
This slide presents the Cypher query results from Neo4j, showcasing extracted features like sDA, view score, orientation, and WWR. Visualizations include 3D sprint layouts and graphs by community and node similarity. WindowLoop leverages these outputs to flag high- and low-performing facade areas, providing designers with clear, data-driven insights for optimization.
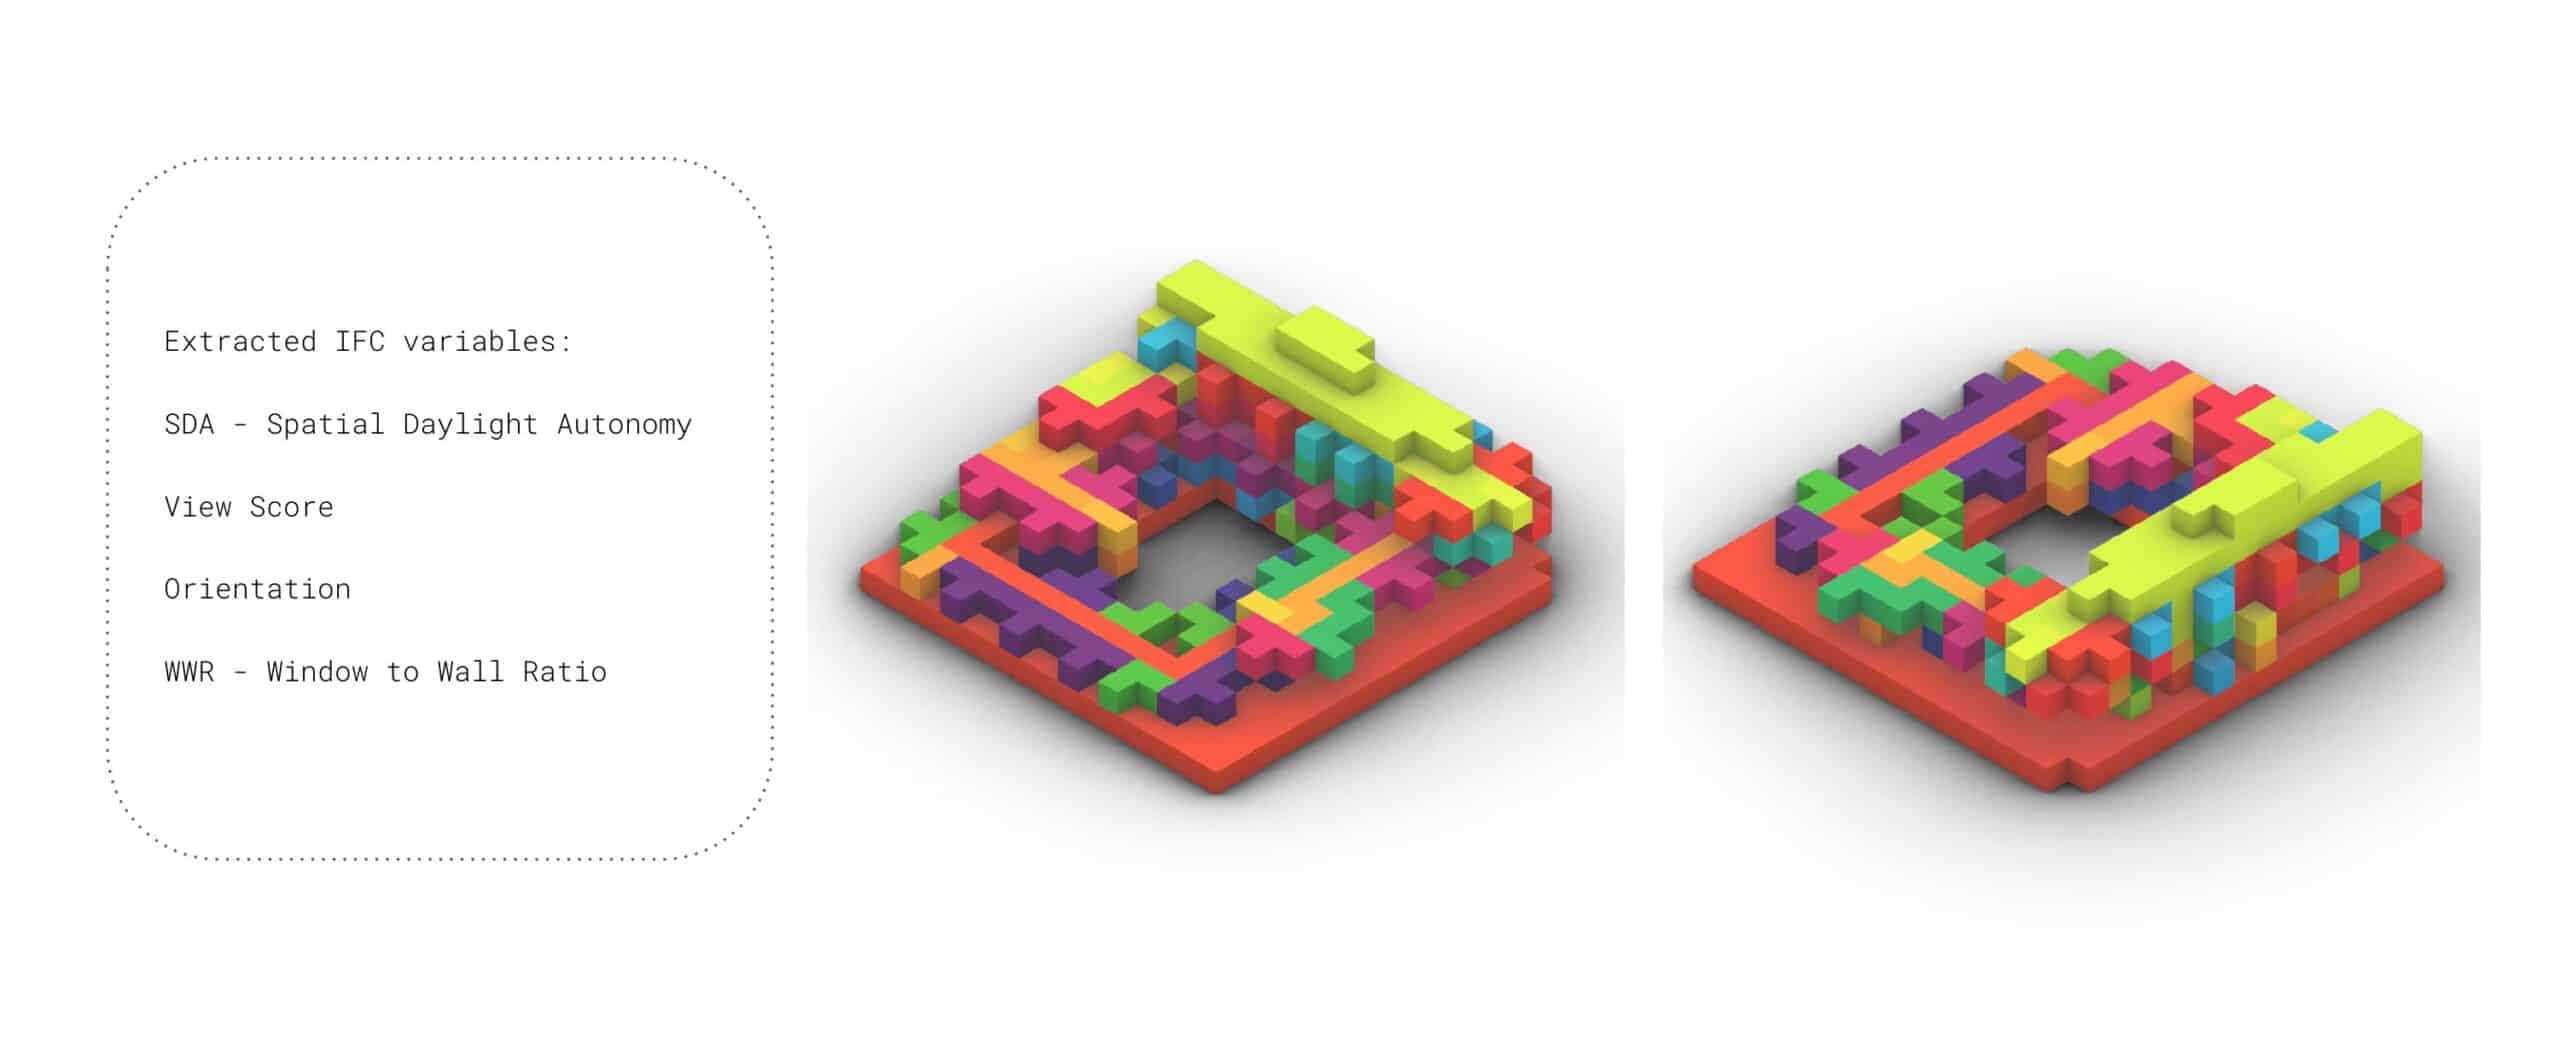
Cypher & GDS: Node Communities
This slide revisits the extracted IFC variables (sDA, view score, orientation, WWR) and emphasizes Graph Data Science (GDS) in Neo4j. WindowLoop uses GDS to identify node communities—groups of facade elements with similar performance characteristics. This clustering enhances the copilot’s ability to suggest targeted improvements, such as reducing WWR in overheated south-facing facades.
Graph & GDS: Cypher Identification of sDA Clusters
Graph & GDS: Cypher Identification of sDA Clusters
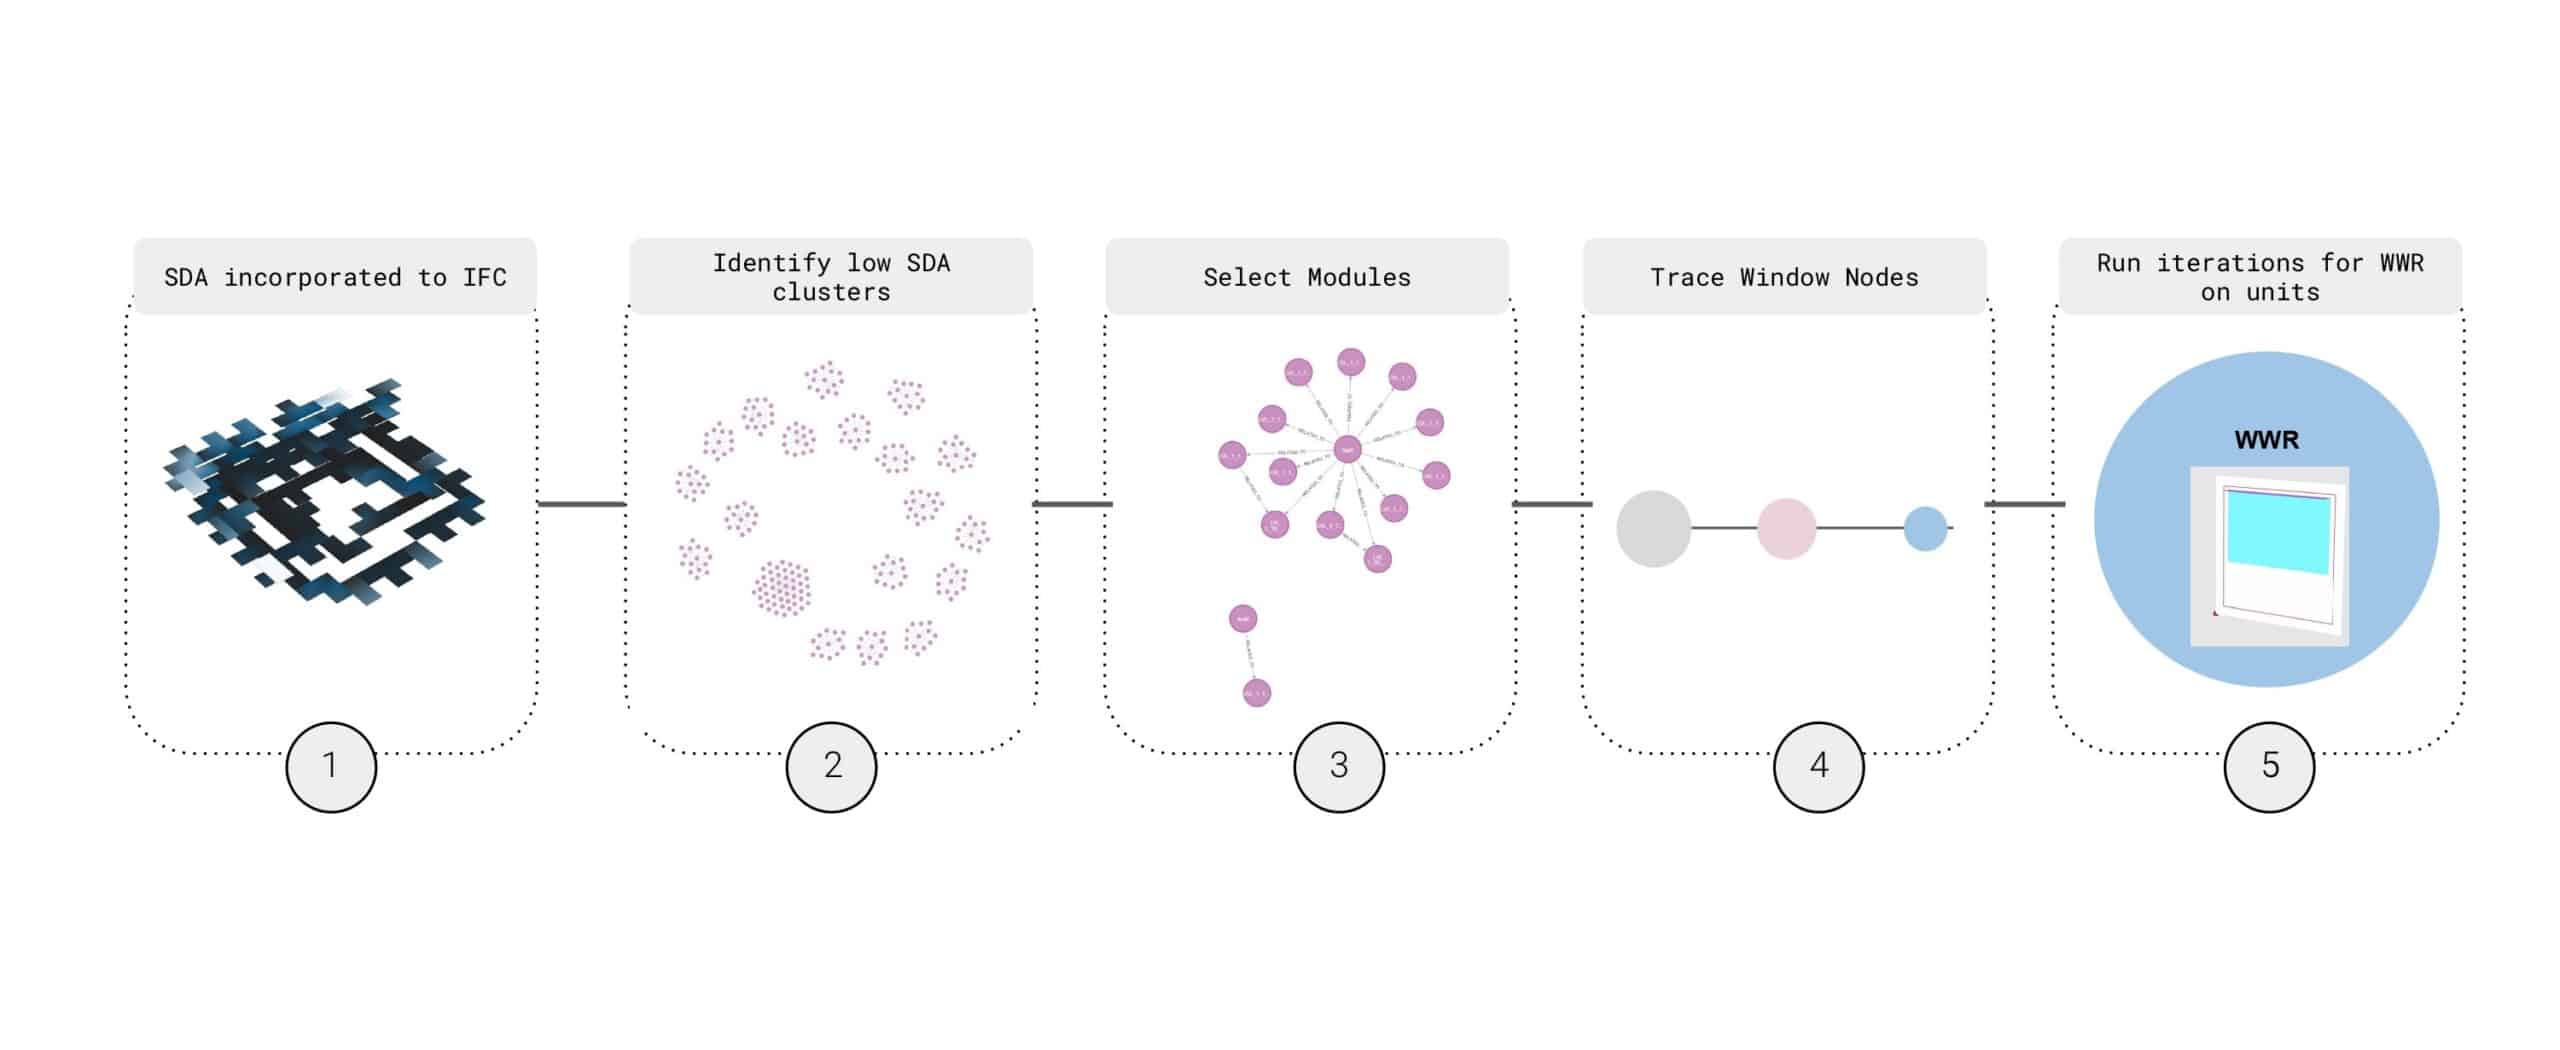
Here, WindowLoop’s process for modifying low-sDA clusters is detailed:
- Incorporate sDA into IFC elements.
- Identify low-sDA clusters using Cypher queries.
- Select affected modules (e.g., rooms with poor daylight).
- Trace window nodes linked to these modules.
- Run iterations to optimize WWR.
This slide showcases WindowLoop’s iterative approach, where designers can test multiple WWR configurations and receive real-time feedback on daylight performance.