Abstract
This thesis explores experimental approaches when addressing sea level rise challenges , the impacts of land loss due to sea rise and population growth. It delves into considerations associated with innovative approaches while emphasizing the integration of urban syntax and graph machine learning. Drawing upon case studies and open data, underscoring the importance of sustainable development, innovative architecture and inclusive urban planning. Aiming to secure refuge and optimize land usage by exploiting coastal waterways, alleviating the lack of living space, by combining urban syntax and graph machine learning approaches may significantly improve the planning investigates reallocation of vulnerable populations and the possible re-densification and land use restructuring as support for planning of public policies. This
scenario is created by the exploratory integration of urban syntax and graph machine learning with emphasis in the relevance of conscious development and inclusive urban planning for effective implementation.
The exploration includes the reevaluation of zones with vulnerable populations, considering the possibility of densifying living settlements and reimagining land use structure are crucial elements in shaping effective public policies. The experimental integration of urban syntax and graph machine learning underscores the importance of conscious development and inclusive urban planning for practical implementation. The proposed restructuring of mixed-use zoning and compact development as the initial steps in a broader plan that could shorten travel distances, reduce congestion, and mitigate gas emissions. These principles align with sustainable urban measures that New York is implementing in the latest years, promoting walkability, active transportation, and public transit utilization, echoing the global trend toward people-centric urban environments. This thesis outlines an innovative roadmap to address the multifaceted issues of sea level rise, land loss, and population growth. It invites us to embrace a future where ingenuity and inclusivity lead the way to shape urban environment
Keywords: Graph Machine Learning, GNN, Urban Transformation, Densification Patterns, Sea Level Rise, Adaptation Strategies, Resilient Cities, Blue Revolution, Geospatial Data, Rising Tides
Introduction
Human nature is adaptive, therefore created in complex communities in order to survive. City is the definition of a permanent and densely settled place with administratively defined boundaries, yet the concept of urban resilience became an intrinsic part of the understanding of city, which refers to the capacity of cities to withstand, adapt to, and recover from possible threats and shocks while maintaining its essential functions. Despite the broad range of factors intrinsic to that concept, all stand at the grounds of anthropocentrism. The concept of urban resilience has surfaced as a response to challenges such as climate change, natural disasters, population growth and socioeconomics disparities, for example. The core concept of urban resilience entails long term planning, resource management and design response in order to avoid and/or recover from disruptive events as global temperatures rise, ice caps and glaciers melt, causing an increase in the volume of water in the oceans. The imminence of a disruptive future, such as population growth and land loss due to sea rise present a crucial challenge, mainly for small coastal countries in the imminence of whole cities slowly disappearing.
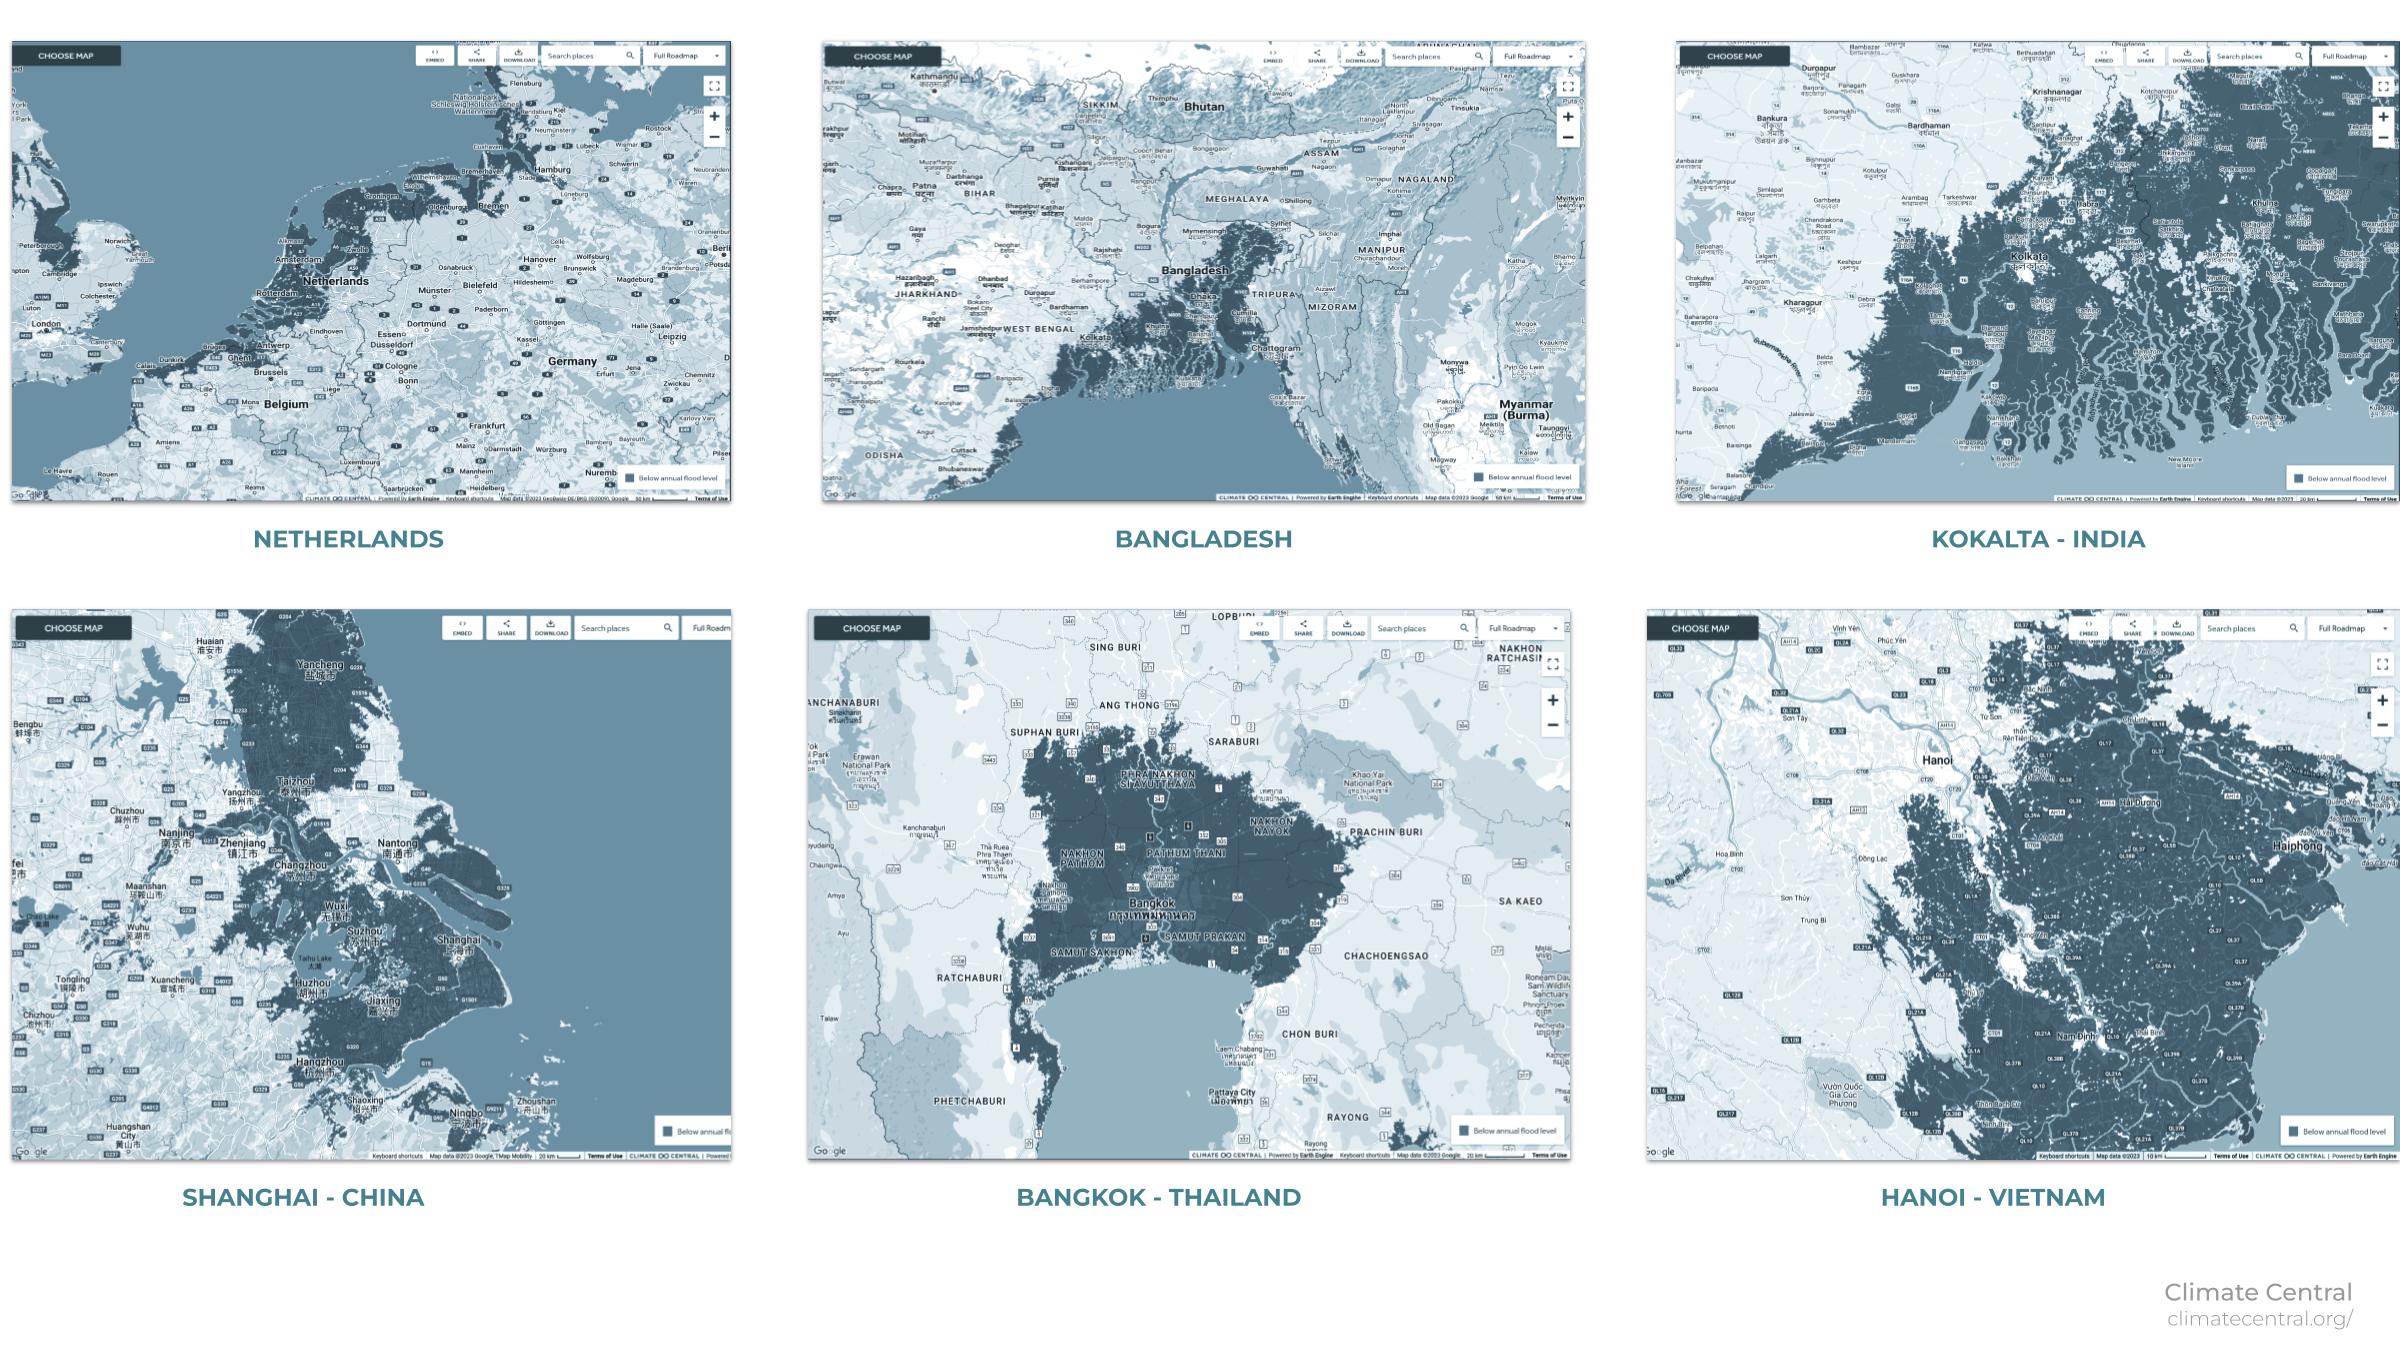
A range of small countries around the globe starts to face multiple consequences: Singapore is a especially vulnerable example, according to Singapore Height Datum (NCCS, 2022), around 30% of Singapore land extension is under 5 meters higher than sea level, while it’s population growth projection presents relative stability in the next 30 years. A total sea level rise of only 10 meters would vanish cities like Miami, Hanoi and Amsterdam, while cities with expressive populational numbers, such as Rio de Janeiro, New York, Copenhagen, Hong Kong, Singapore, Tokio, Nagoya and many others would be partially submerged, causing a expressive seek for resettlement. The relevance becomes more apparent when contextualized in countries with smaller land extent, when the urgency of resettlement has no availability of land, catalyzing a wave of stateless citizens.
Technological explorations and advancements play a crucial role in enabling responsible mitigatory measures aligned with sustainable development for future generations. Additionally, technological explorations aim for data-driven insights to inform the decision making process. The aim of this experiment is the exploration of graph machine learning to enhance the understanding of spatial and functional relationships within the concept of a sustainable settlement and its connections to the remains of a city.
Architecture carries the weight of cultural significance through generations, while urbanism teaches about the authenticity and complexity of human behavior developed along historical systemic developments. The understanding of urban typologies and cultural aspects is the key to understanding people, also, to unveil the particularities of each period of development in history. In times of global warming, overpopulation and sea rise: what have we learnt from urban relations to sustainable development, expansion, modernization, adaptation and resilience in ancient cities?
The incorporation of sustainable measures can break global warming and provide a wider spectrum of stability for humanity, however, the challenge is to establish a balance between technology, development, environmental consciousness and human safety. The concept of 20 minutes city emphasizes a mixed use and compact development through sustainable measures to maximize the access to amenities infrastructure, while reducing the carbon. An important aspect of this concept is the connectivity between neighborhoods within short traveling time and access to other clusters in an effective manner considering environmental sustainability, social equity, and economic viability in the design and development of urban areas.
The spatial organization of a cohesive and functional city or neighborhood refers to the analytical organization of elements, goals and cultural requirements based on distance, priority, density and integrative distribution arranged cohesively.The processes involved in cohesive urban design involves a series of parameters, besides pure technicalities; artificial intelligence and graphs to model the cities semantics through intersections of nodes and edges with embed information is an emerging exploratory field. The image below is an example extracted from “ Graph Representation of 15 minute city : A comparison between Rome, London and Paris”, where Barbieri states the node f considered as a service or amenity and the shortest path from any other node to the service is calculated to find the pedestrian travel time based on the distance. The 20 minute city zone was formed and this was followed by
locating another service. By repeating the same process it can be seen that some of the nodes can access both the services within 20 minutes. A 20 minute city index provides a measure of the city’s adherence to the 20 minute city concept based on the connectivity of the 20 minute city zones and inclusion of services.The researchers showed that Paris and London have a stronger 20 minute city characterization than compared to Rome.
Hypothesis
The integration of urban syntax along with graph machine learning techniques will result in optimized resource allocation, better connectivity and livability when facing inevitable environmental challenges . It is expected that the identification of endangered areas will enable orinet the redistribution of the population and inform the land use functional reassignment to facilitate the development of smarter neighborhoods. The research aims to be the start of a a multi-factor analysis, since urban design is a complex science.
Research Question
How can the integration of urban syntax and graph machine learning techniques contribute to the design and planning of adaption resilient communities as a response to sea level rise and population growth?
Methodology
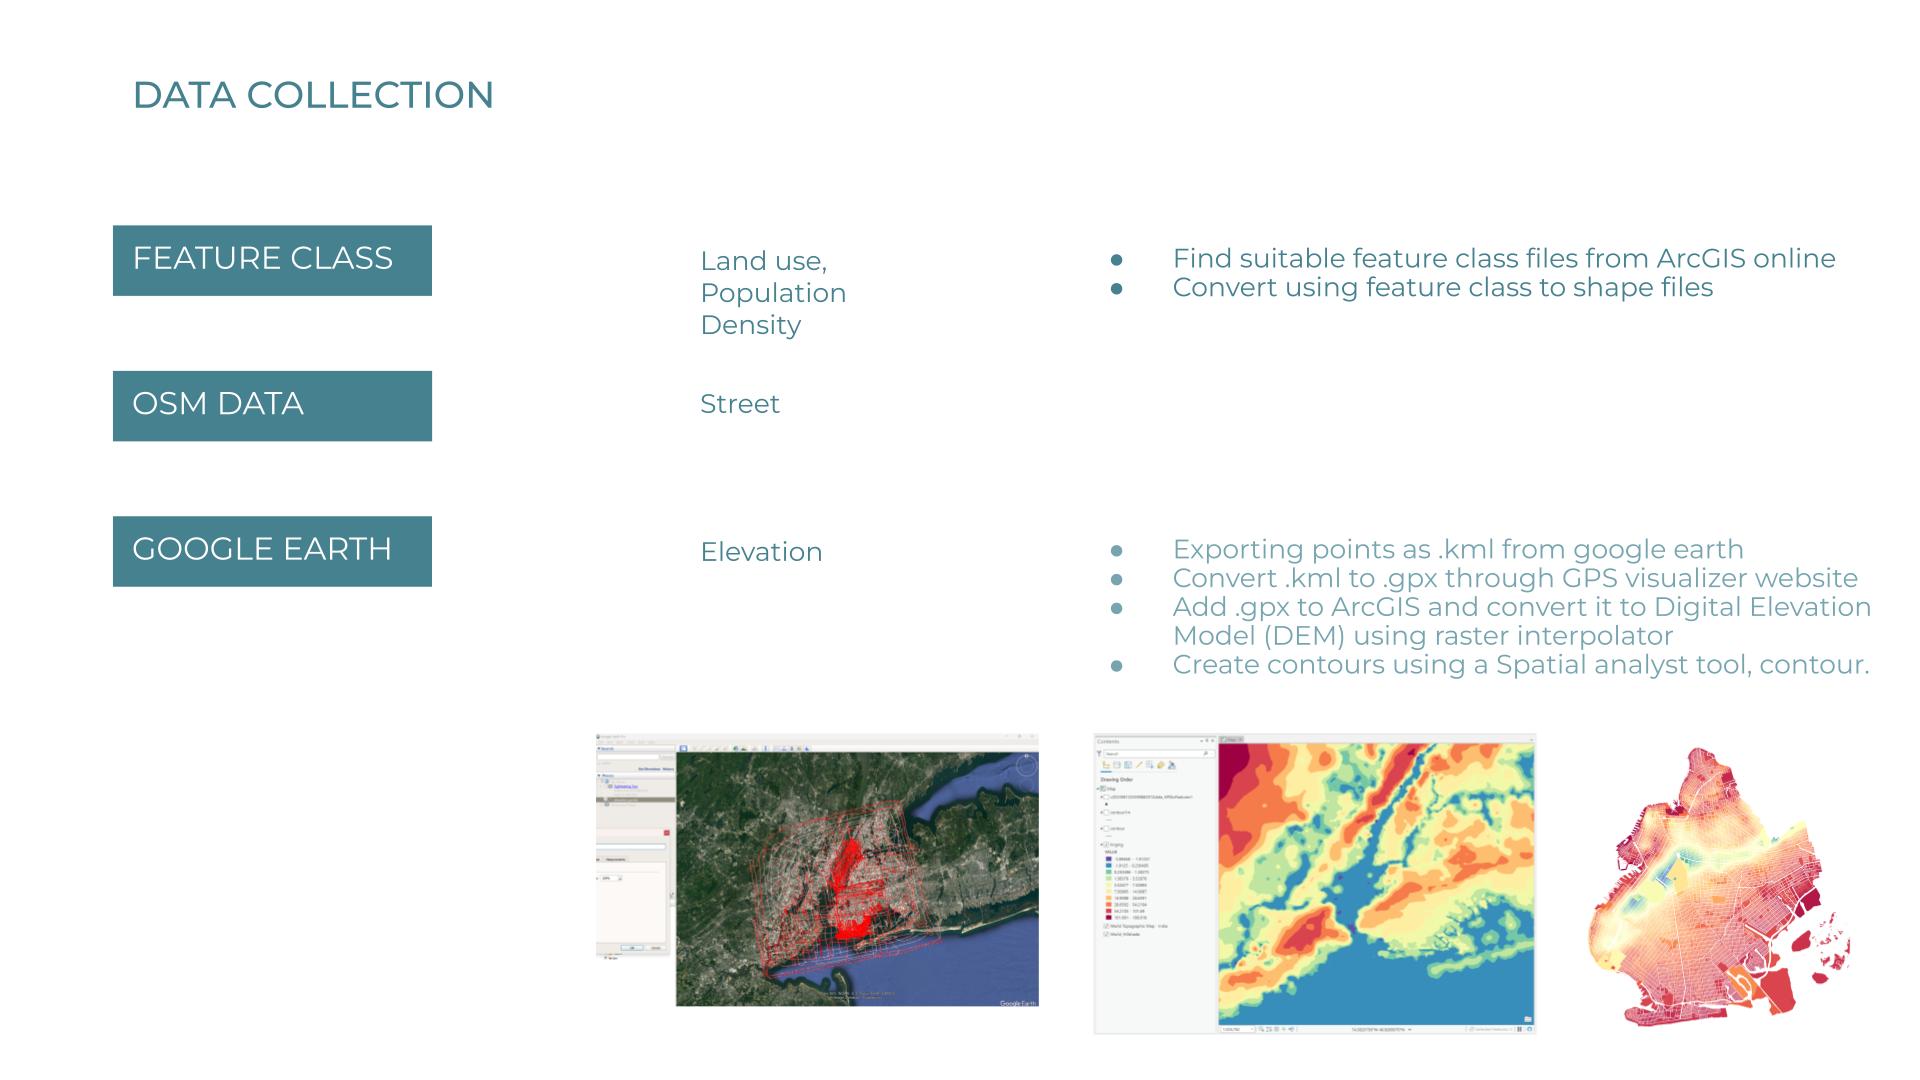
The methodology is divided in 3 major steps: data exploration,Redensification and Land use reassignment.Data exploration: This step comprehends the acquisition and cleaning datasets relevant to sea level rise problematic and the land use - population growth projection, in order to visualize and conduct an evaluation of relevance of a region. Redensification: Comprehends the analysis and processing of datasets to obtain the available land after leas level rise projections are applied, sucesseded by the usage of a edge classification model in order to learn and understand the redensification pattern.+ Land use reassignment: The experiment aims to train a inductive link prediction model, which can predict the changing connections between the plots, as it reassigns land use attributes.
Data
Data exploration entailes the shallow analysis of sea level rise projection along multiple location, as examplified in the next page, along with information crossing about availability of data for each location and the relevance to this project needs. It is specially challenging and time consuming to find consistent datasets which are complete enought for the project to be executed.
DATA
The availability and accessibility to data was a key piece to land New York as the case study of this thesis. The high volume of data and dense urban networks led to chose of scoping the Brooklyn outlines as the primary work zone.
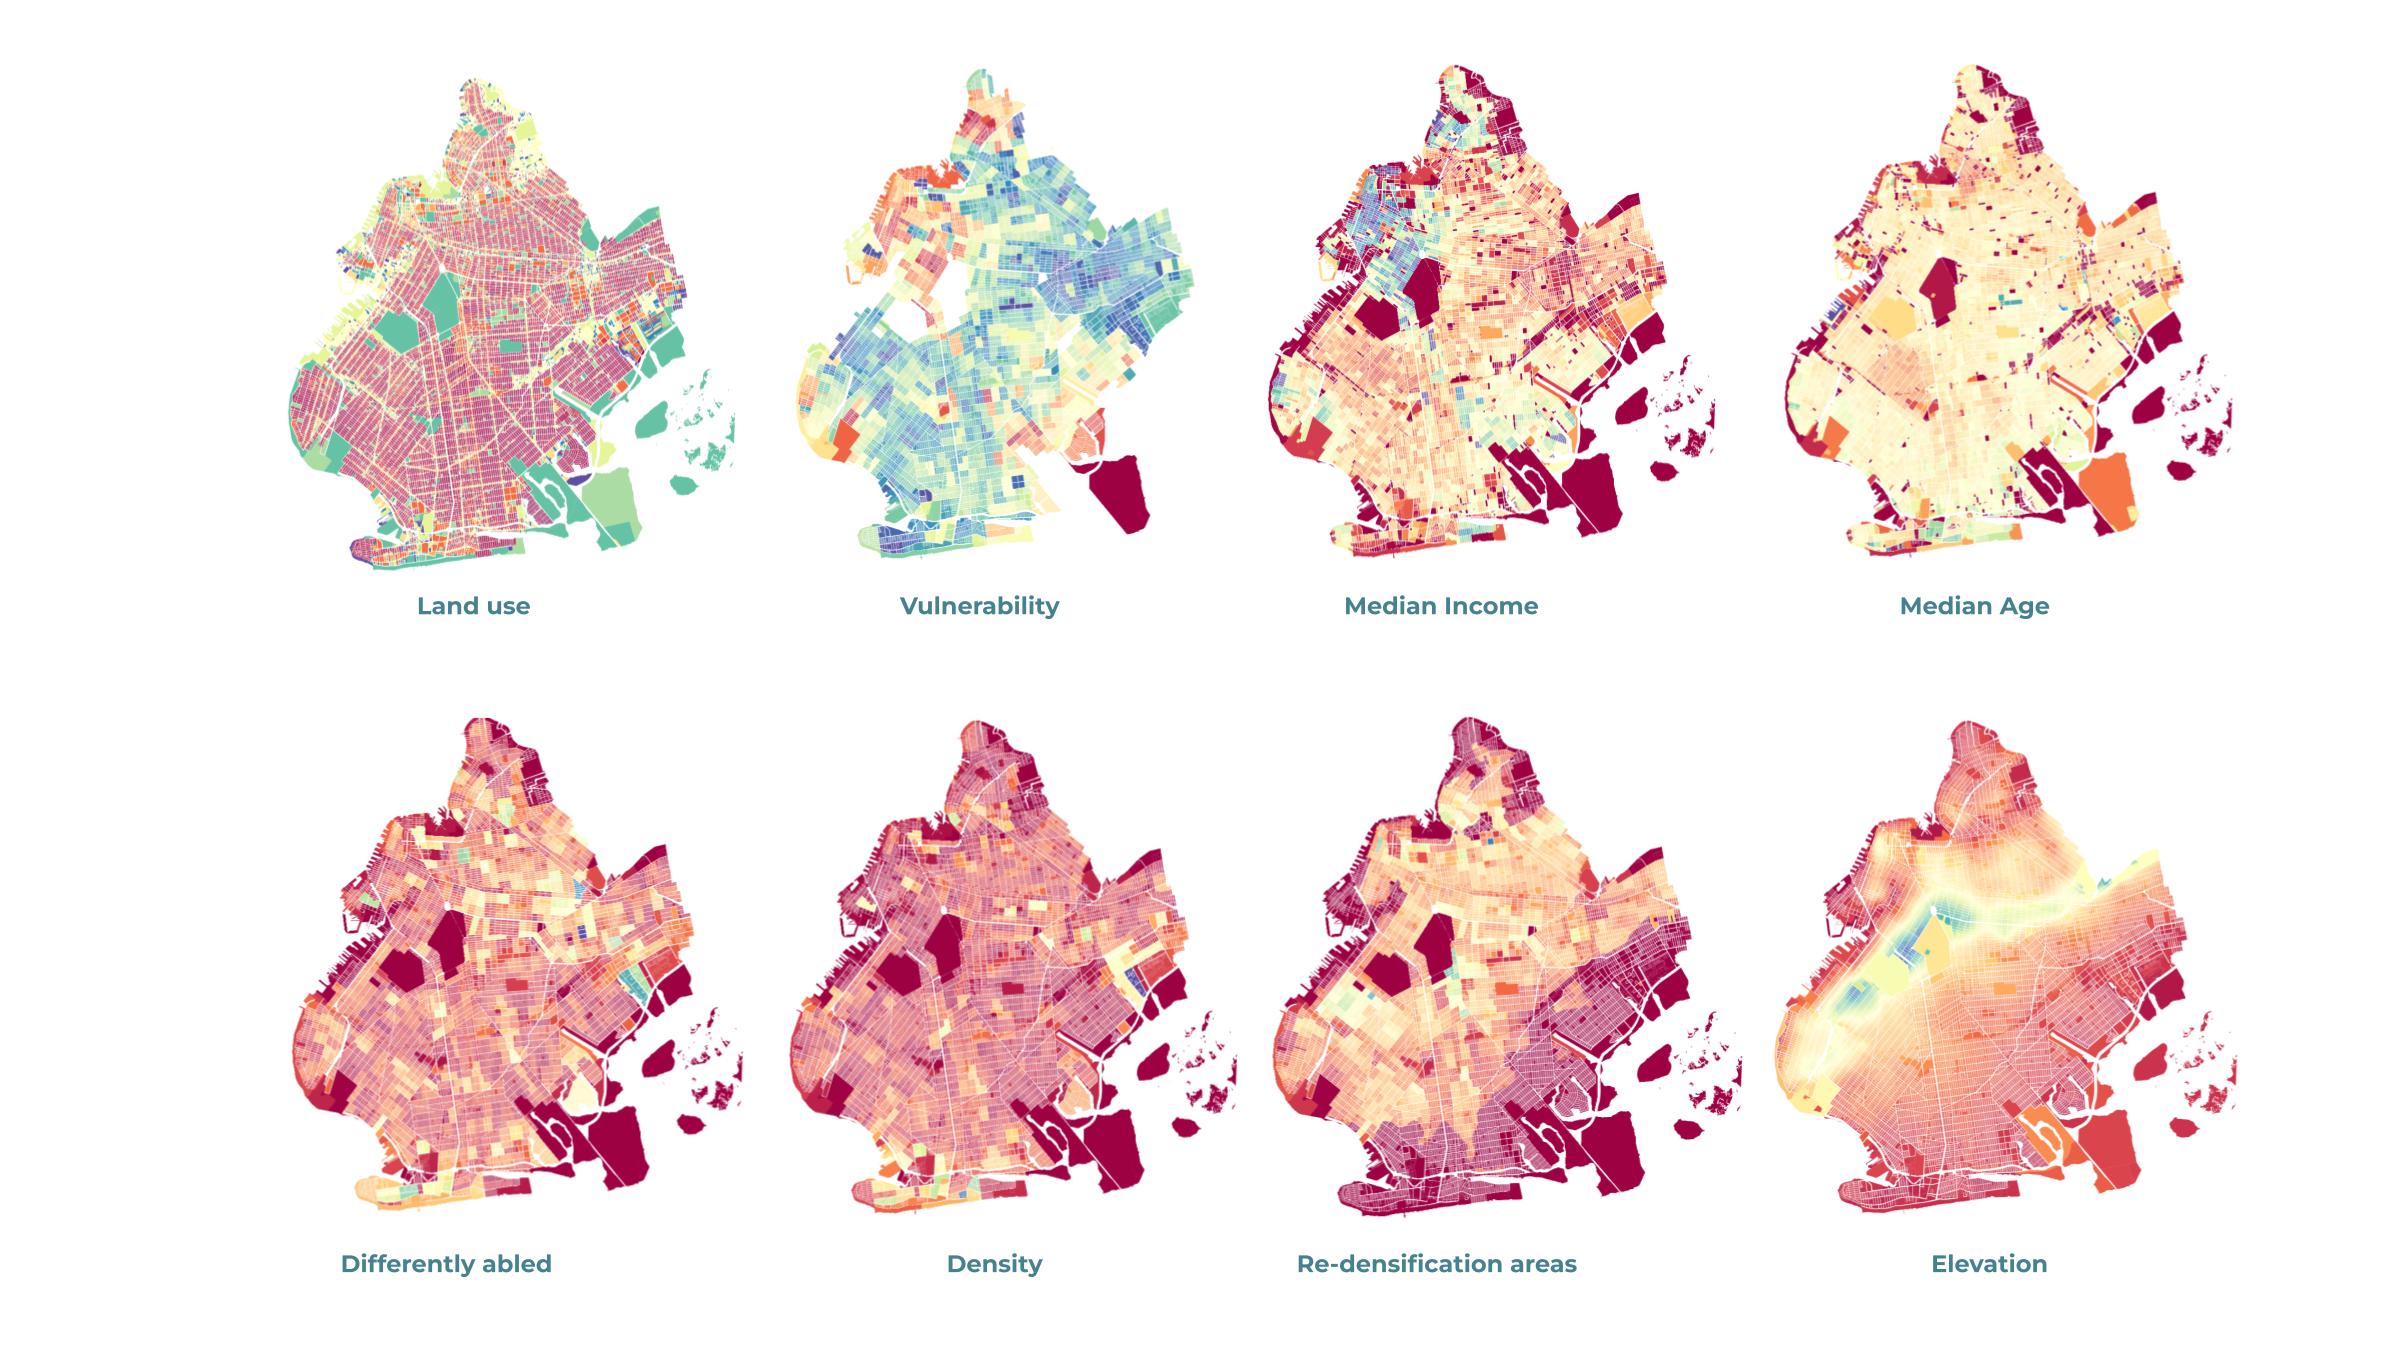
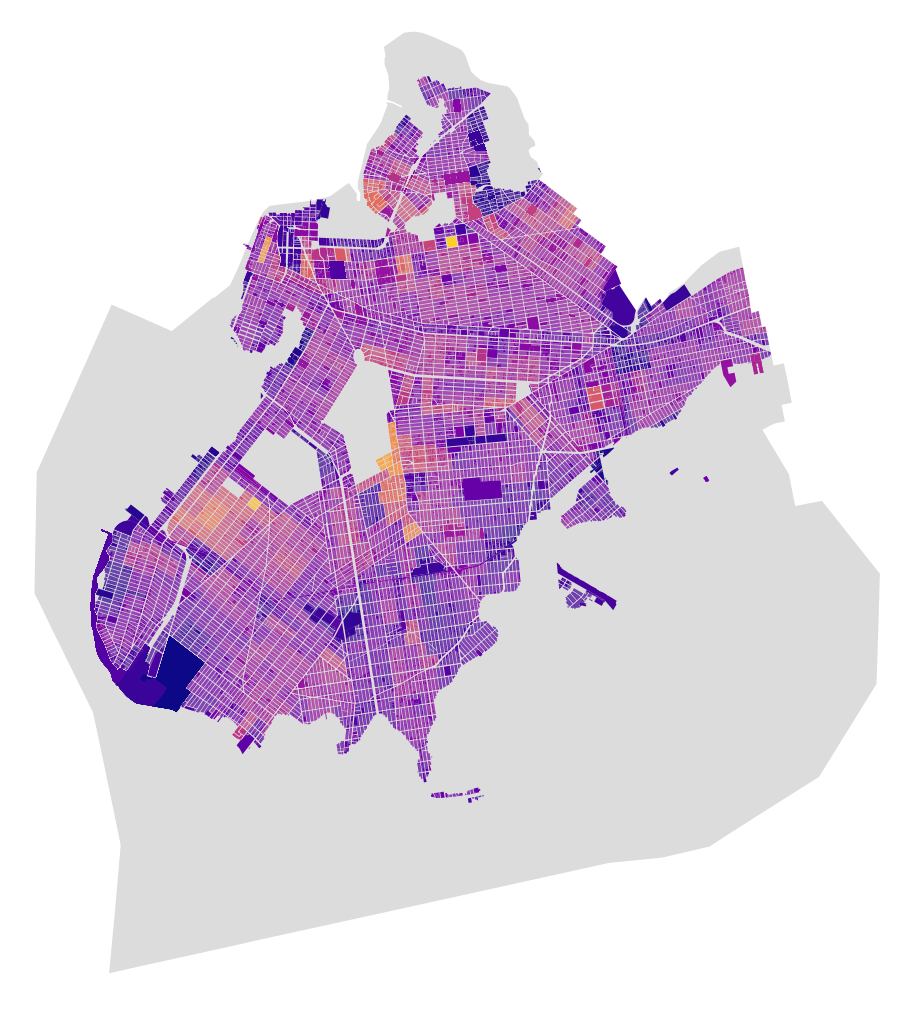
The acquired data was restructured into a interactive map ruled by the elevation, where the flooded areas loose attributes, edges and nodes, becoming a smaller polygon.
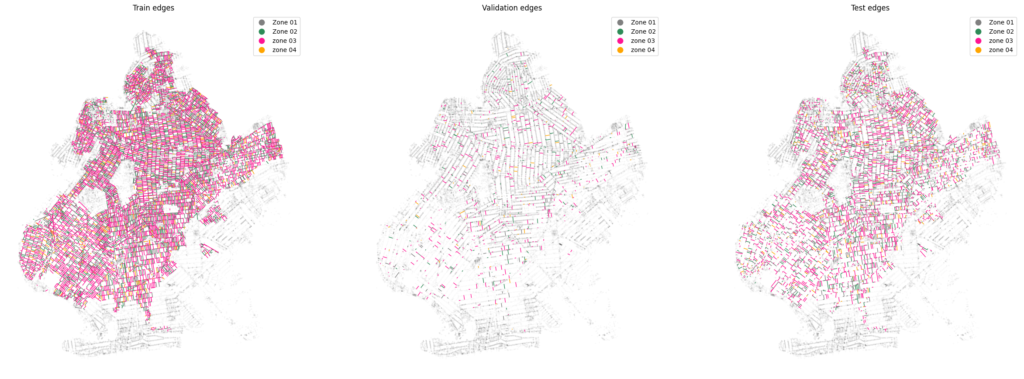
Data Splitting Setup: Three dictionaries are created: train_eid, validation_eid, and test_eid. These dictionaries are used to store information about the edges in each dataset
Training Set Creation: The selection of 40% the labeled edges from the original dataset and stores them in the train_graphs_keys list. These edges will be used to train machine learning models.For each edge in the train_graphs_keys list, the code records its class label in the train_eid dictionary.
Validation Set Creation: The remaining edges (not included in the training set) are stored in the rest_of_edges list.The code then randomly selects 10% of the edges from rest_of_edges to create the validation set, and the edge IDs and their corresponding class labels are stored in the validation_eid dictionary.
Test Set Creation: The edges that were not included in either the training or validation sets are added to the test set. These edges are stored in the test_graphs_keys list.Class labels for each edge in the test set are recorded in the test_eid dictionary.
Prediction Set Identification: A prediction set is created, consisting of edges that have no associated class labels. These edges are identified by checking if they are not present in the class_edges_dict. The edge IDs of the prediction set are stored in the prediction_eid list.
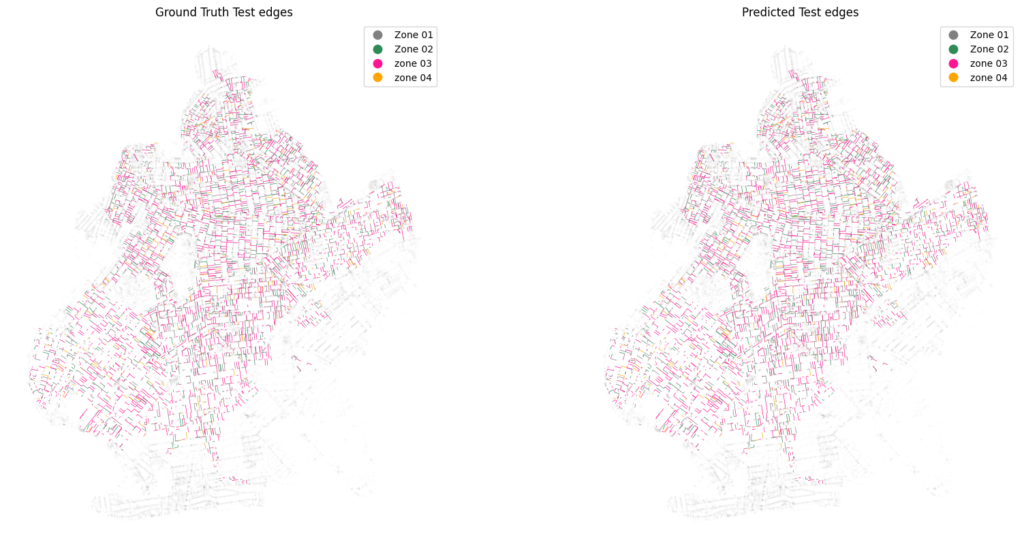
Visualization : The GeoDataFrames for the training, validation, and test sets, which can be useful for visualizing the data geospatially. These DataFrames include information about edge geometries, edge IDs, class labels, and human-readable class representations.
in_features =32
n_hidden =4
out_feat = 32
num_classes = 5 #features
lr = 0.0003 #learning rate
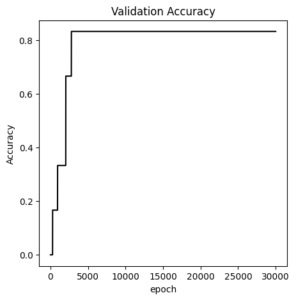
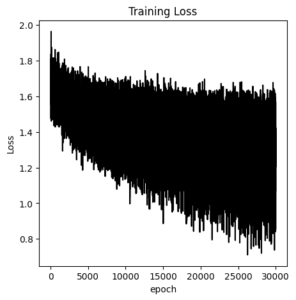
n_epochs = 30000 #Number of epoch run
dropout = 0.5 # Dropout rate
patience = 100 #Early stopping patience
Experiment 2
Resettlement becomes a pivotal solution and it not only includes relocating affected population but also redesigning urban areas. Land use must adapt to these changing circumstances. Some plots may need to be repurposed for green spaces or as a buffer zone for sea level rise. A link prediction inductive model can analyze and predict the evolving connectivity within these reshaped urban landscapes.
The experiment no. 2 aims to train a inductive link prediction model, which can predict the changing connections between the plots as the policy makers change its attribute land use. The graph with all the link predicted will show the importance of each node, in other words, it will portray the importance of a node in an urban neighborhood. The commercial, retail, institutional and public transit plots will be the important ones among a group of residential plots because they contribute to the idea of walkable cities.
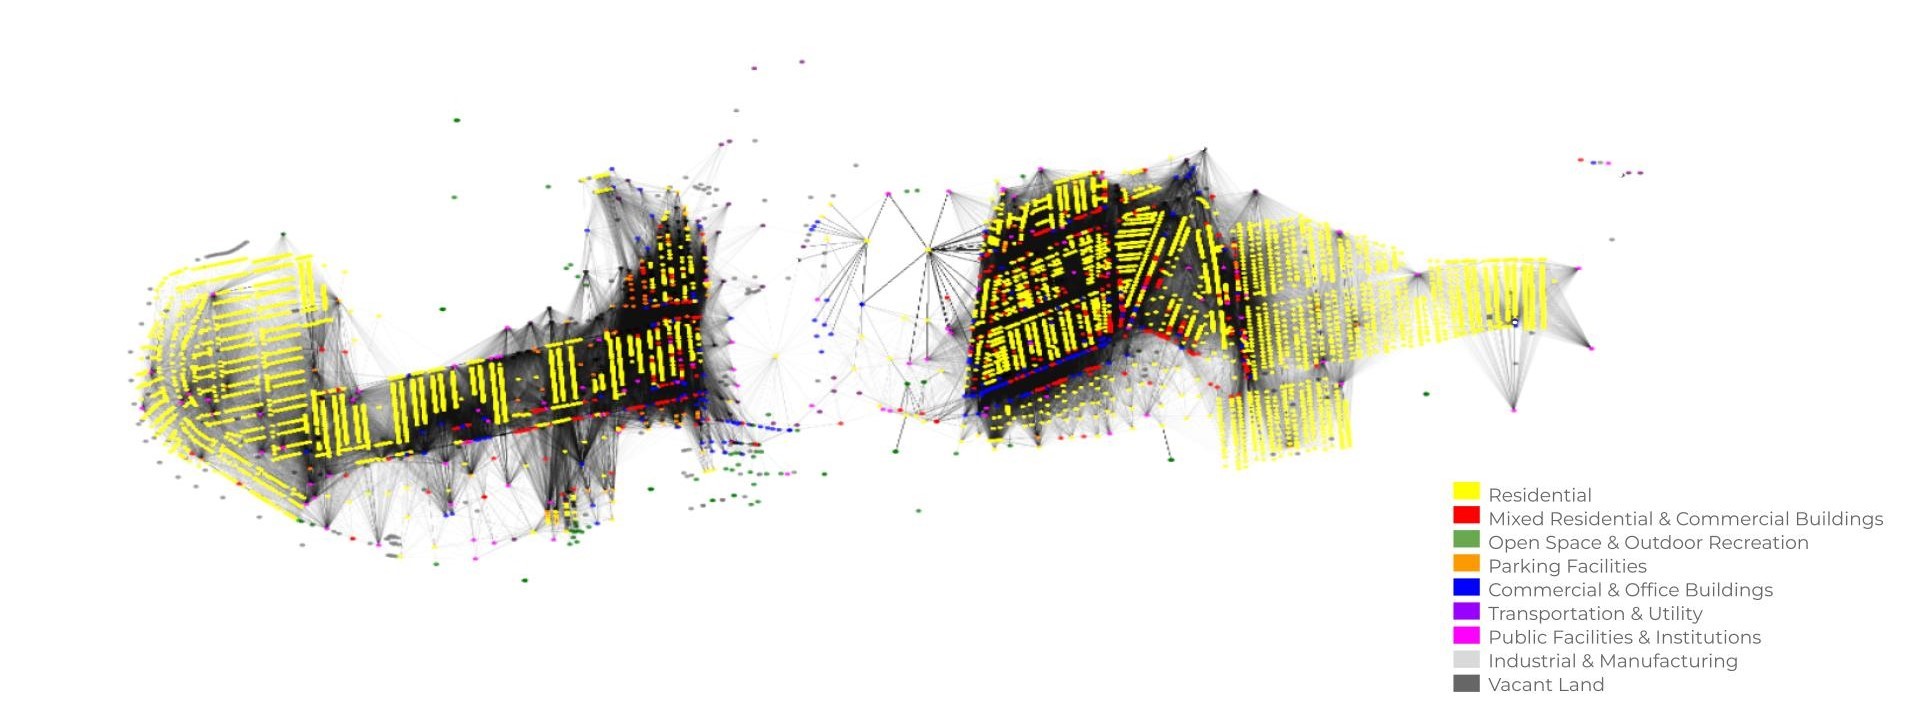
The model was trained on a large graph with 6406 nodes and 221779 edges. For, creating a graph we used plots from coney Island. The reasons for selection are as follows – A clear separation or discontinuity cause by canals and bays, diversity of land use and diversity of connections. The urban building plots formed the nodes and the connections between them based on proximity form the edges. An average walking speed on 1.4m/s was considered.
Graph Creation
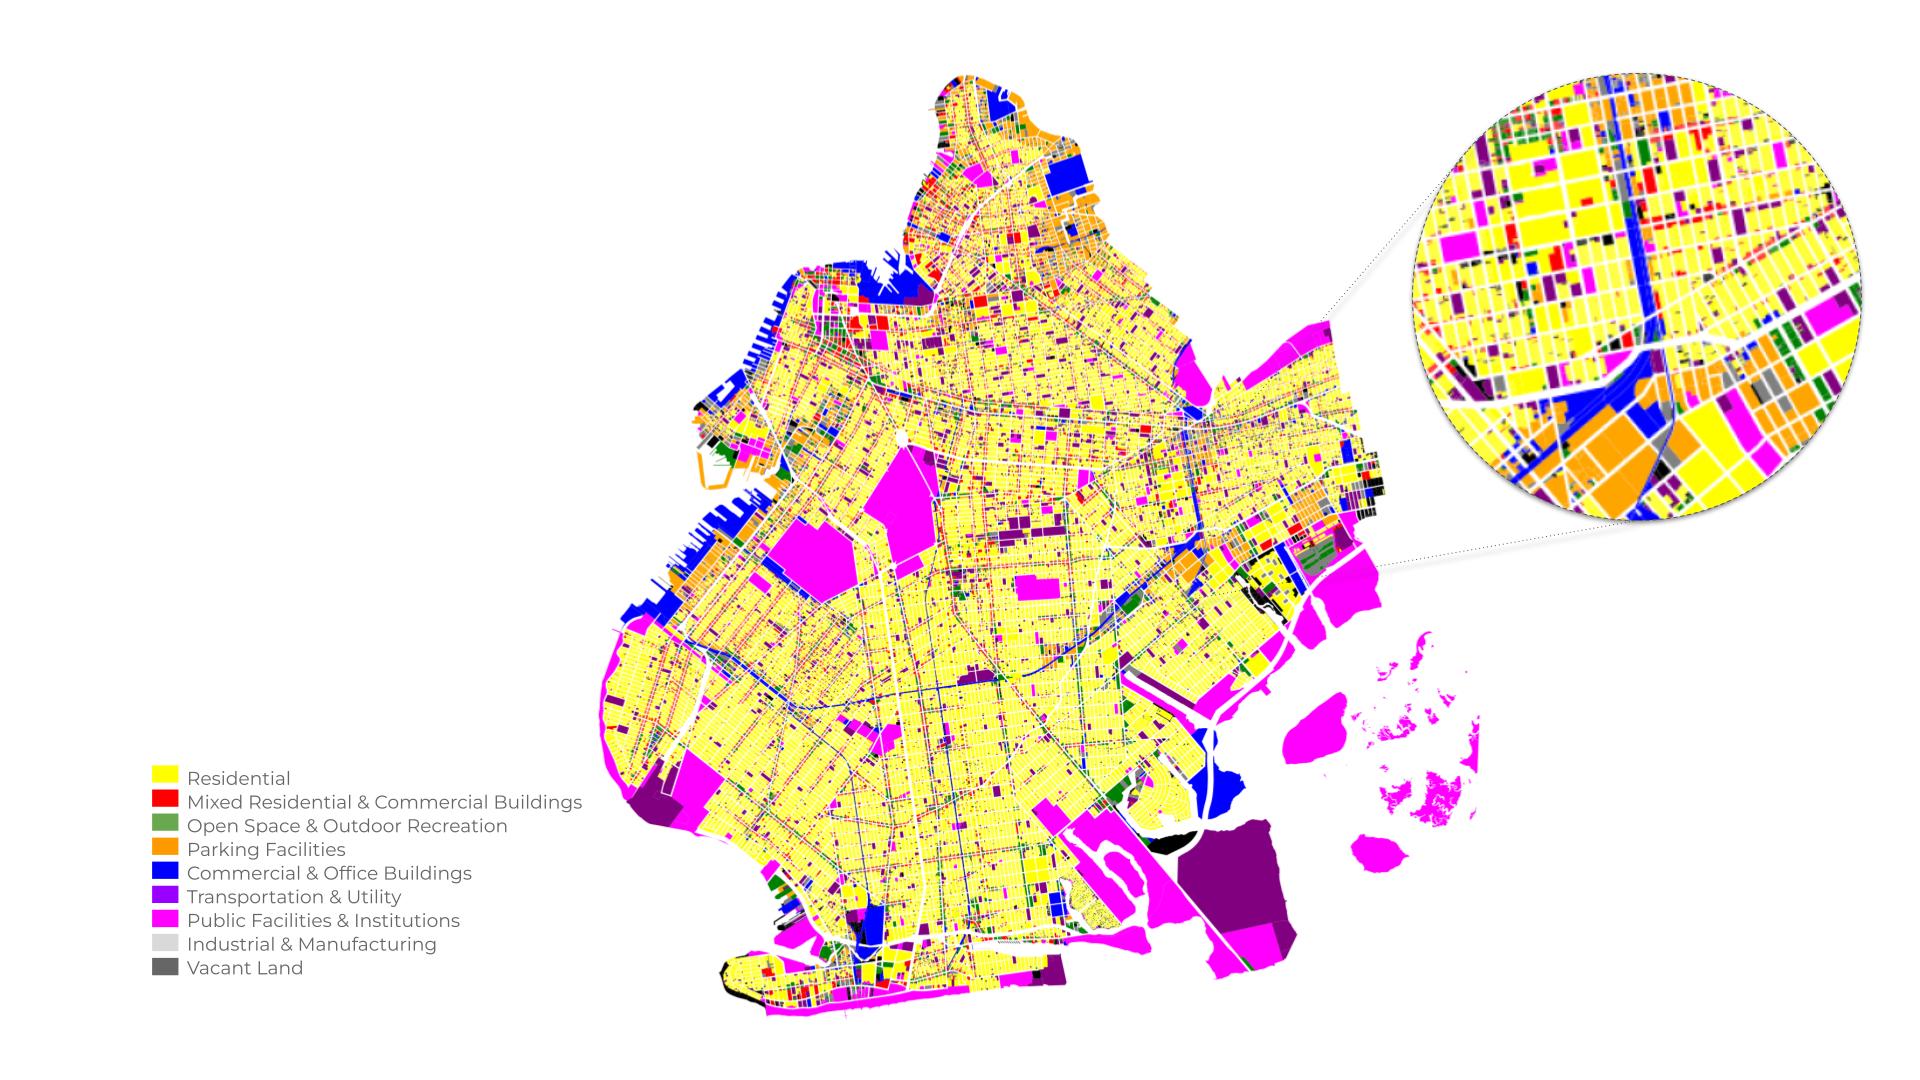
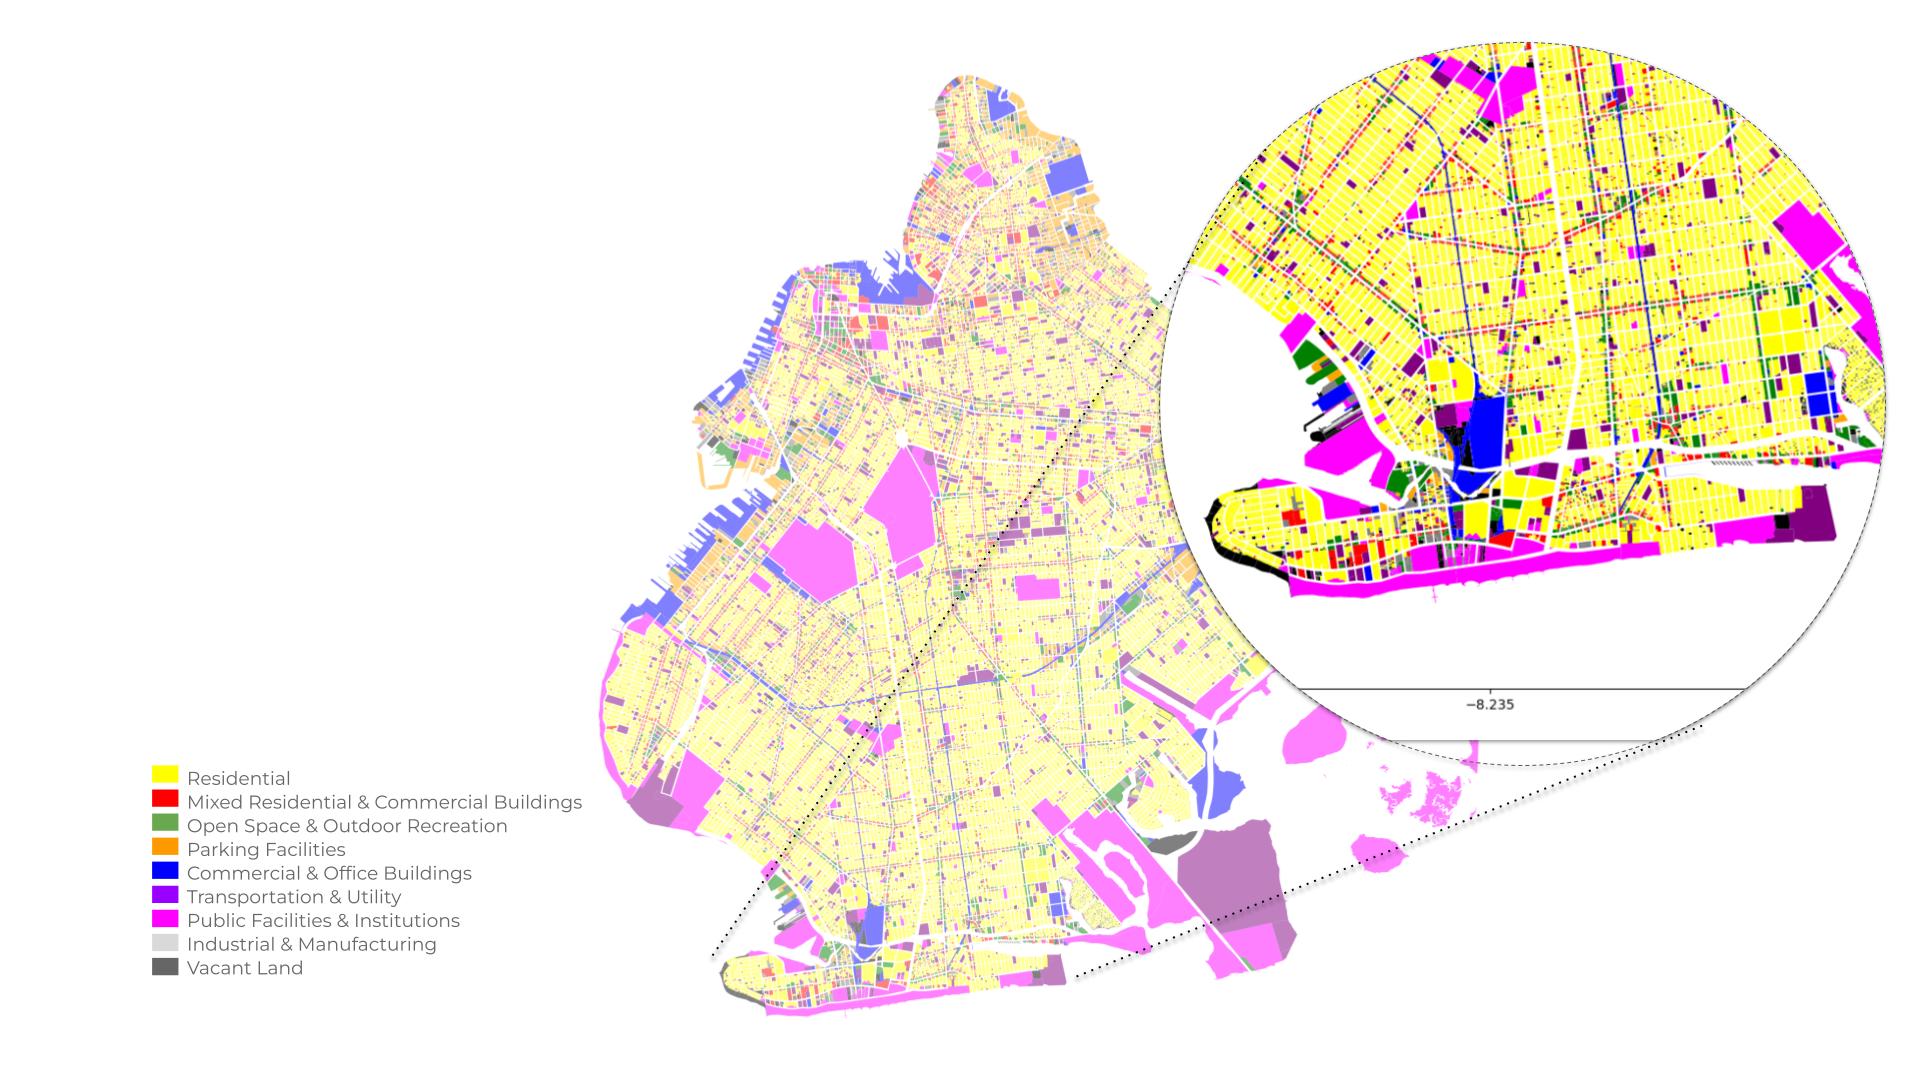
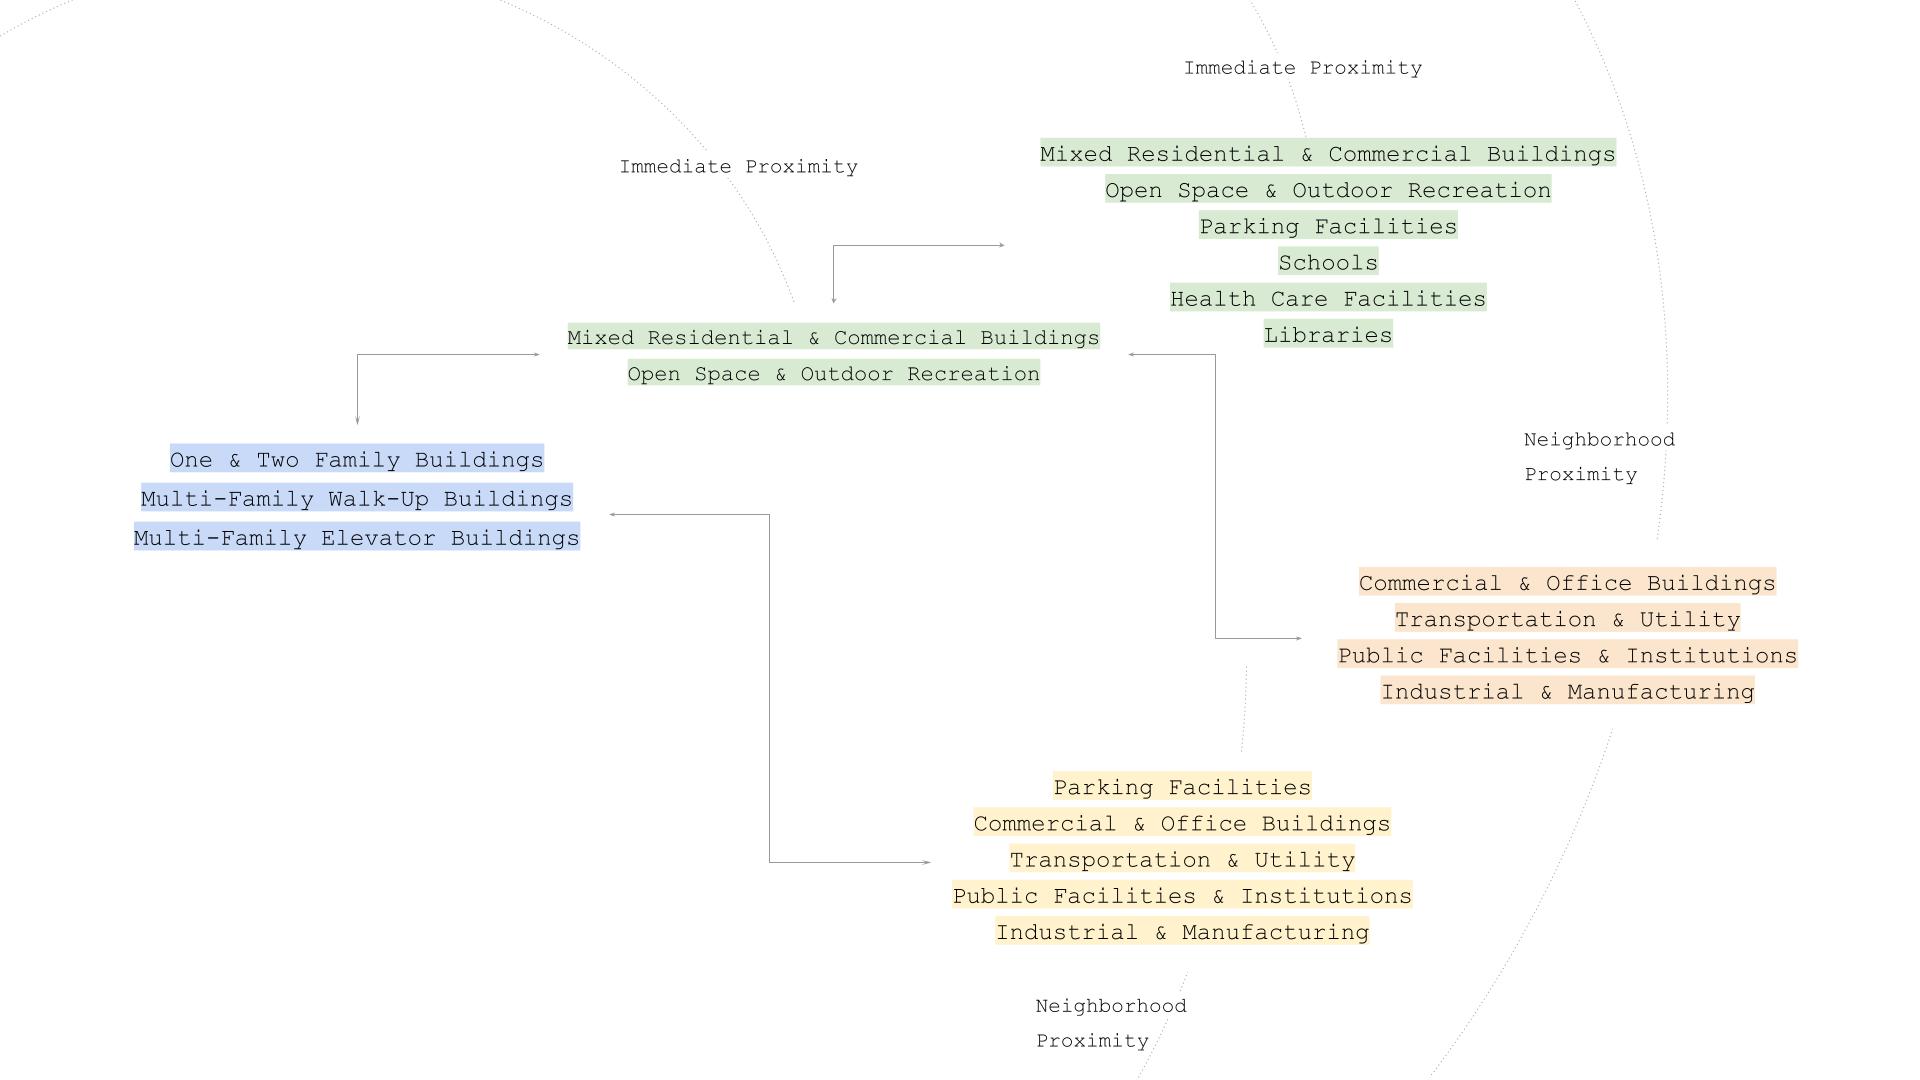
The first three types of land use which fall under residential category are highlighted in blue in the image below. If one can reach a mixed residential and commercial building or an open recreational space then within 5 minutes of walking then an edge is created between the plots.
Similarly, from the residential plot if you can walk to a transport station, public facilities, commercial or office buildings, parking spaces or factories within 10 minutes an edge created
Similarly edges are created for the Mixed residential areas depending on the proximity to the other land use types.
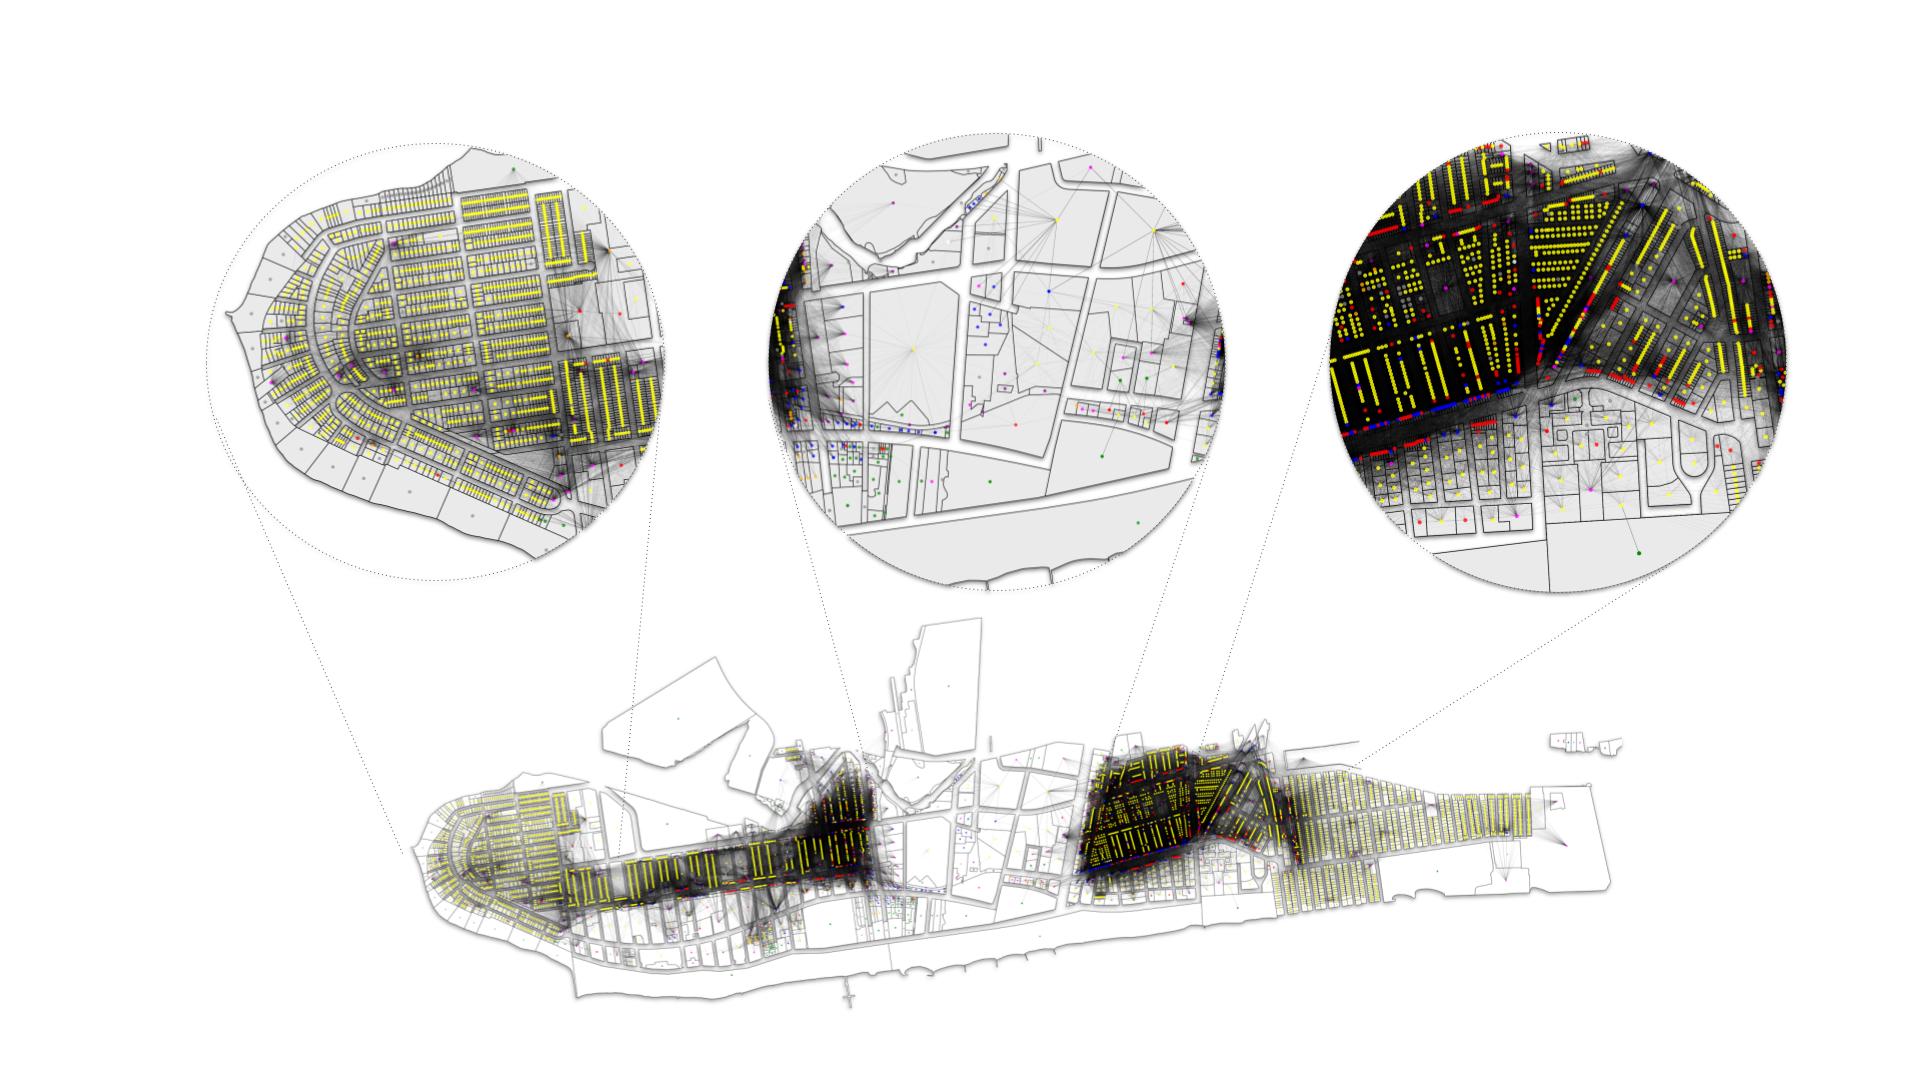
The graph created displays the diversity of its nodes and edges. The first image on the left shows a residential area with some connections to the nearest public facilities and commercial spaces. The next image shows large plots and hence less connections and the last one shows high connectivity due to the presence of more commercial plots.
Node Attributes
The different land use included in the network are One & Two Family Buildings, Multi-Family Walk-Up Buildings, Multi-Family Elevator Buildings, Mixed Residential & Commercial Buildings, Open Space & Outdoor Recreation, Parking Facilities, Commercial & Office Buildings, Transportation & Utility, Public Facilities & Institutions, Industrial & Manufacturing and Vacant Land.
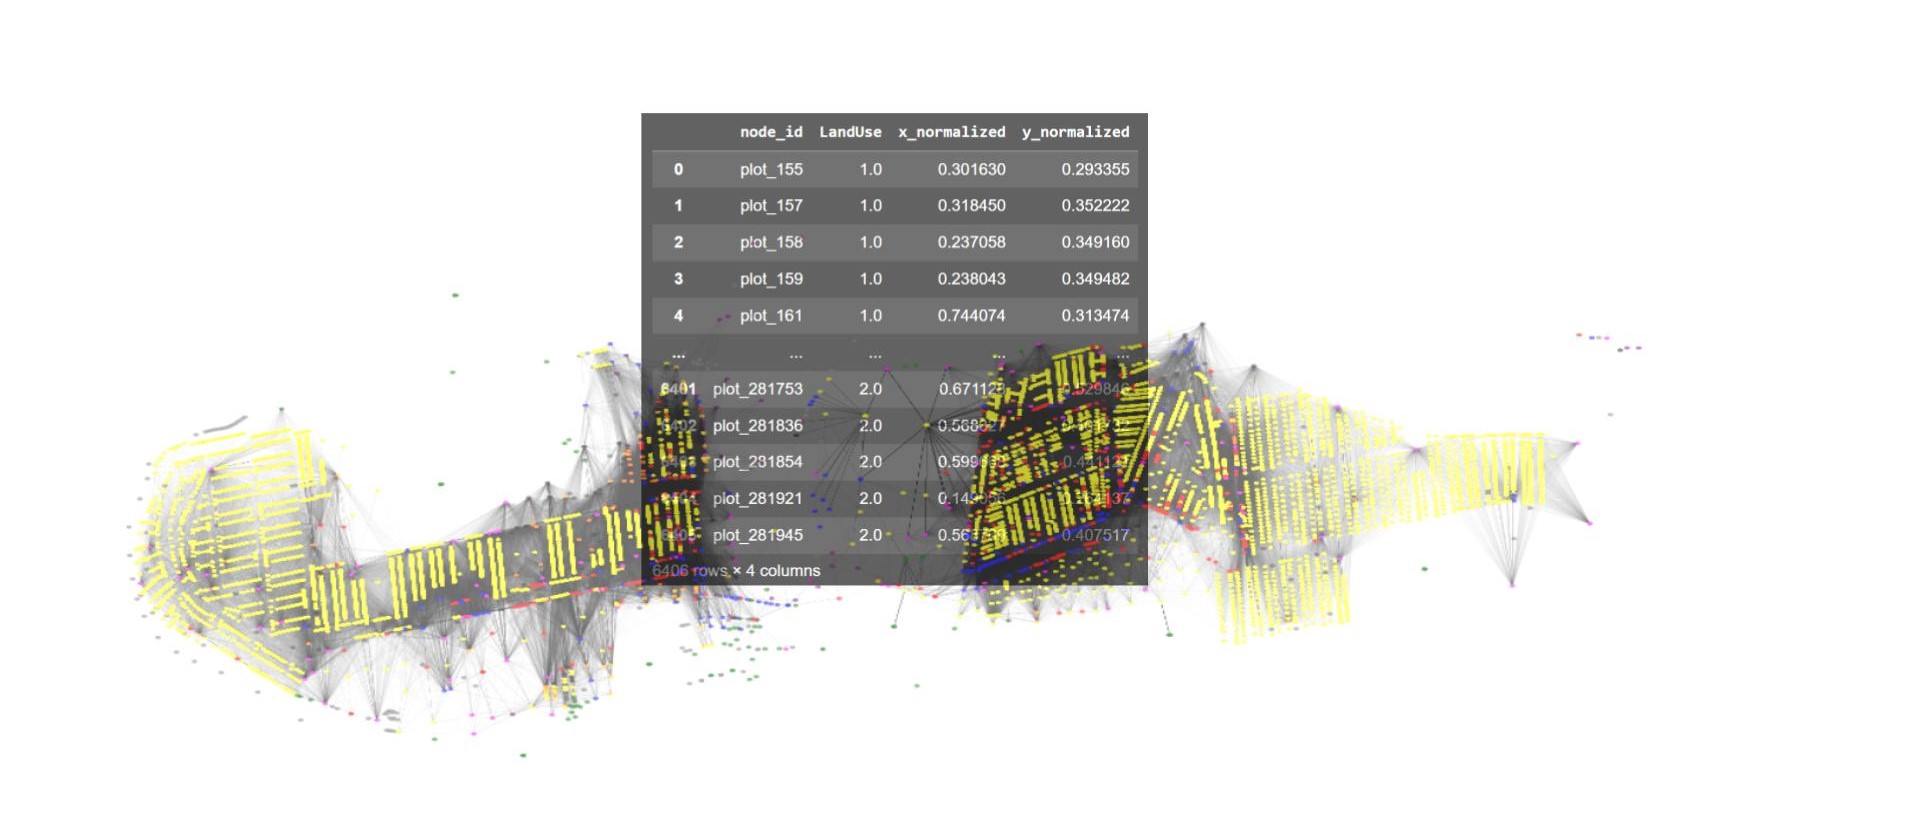
The x and y coordinates of the centroid of each plot marks the location of the nodes. The coordinates were normalized for better computation
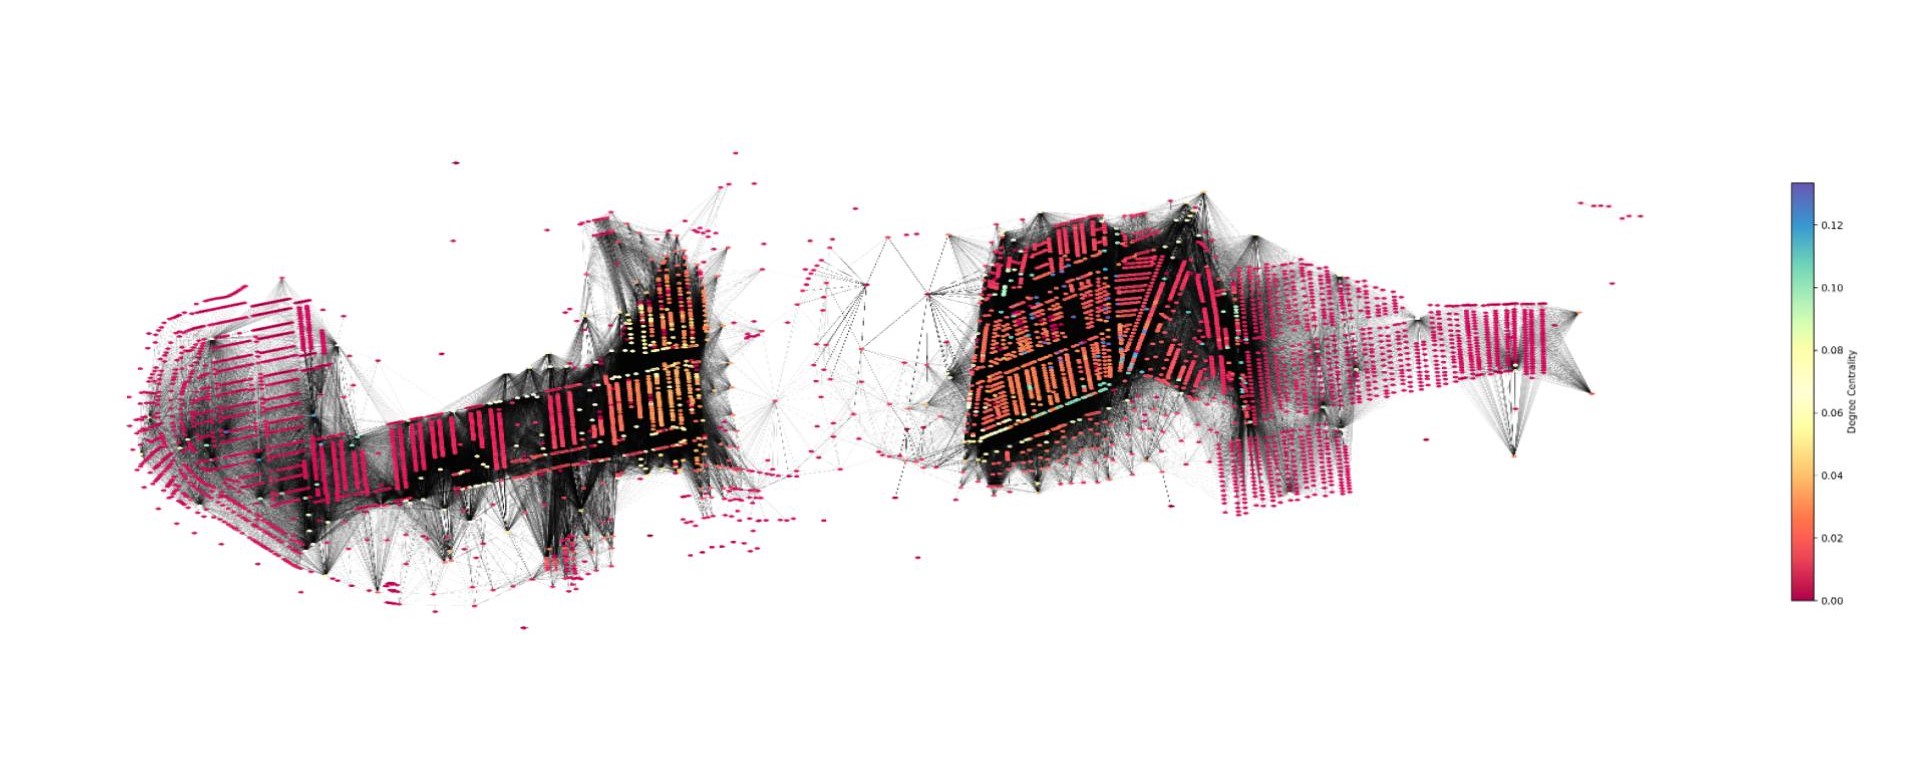
Degree centrality measures the importance of a node in a graph network based on the number of direct connections it has. It is useful in identifying nodes that play a central role in spreading information in a network
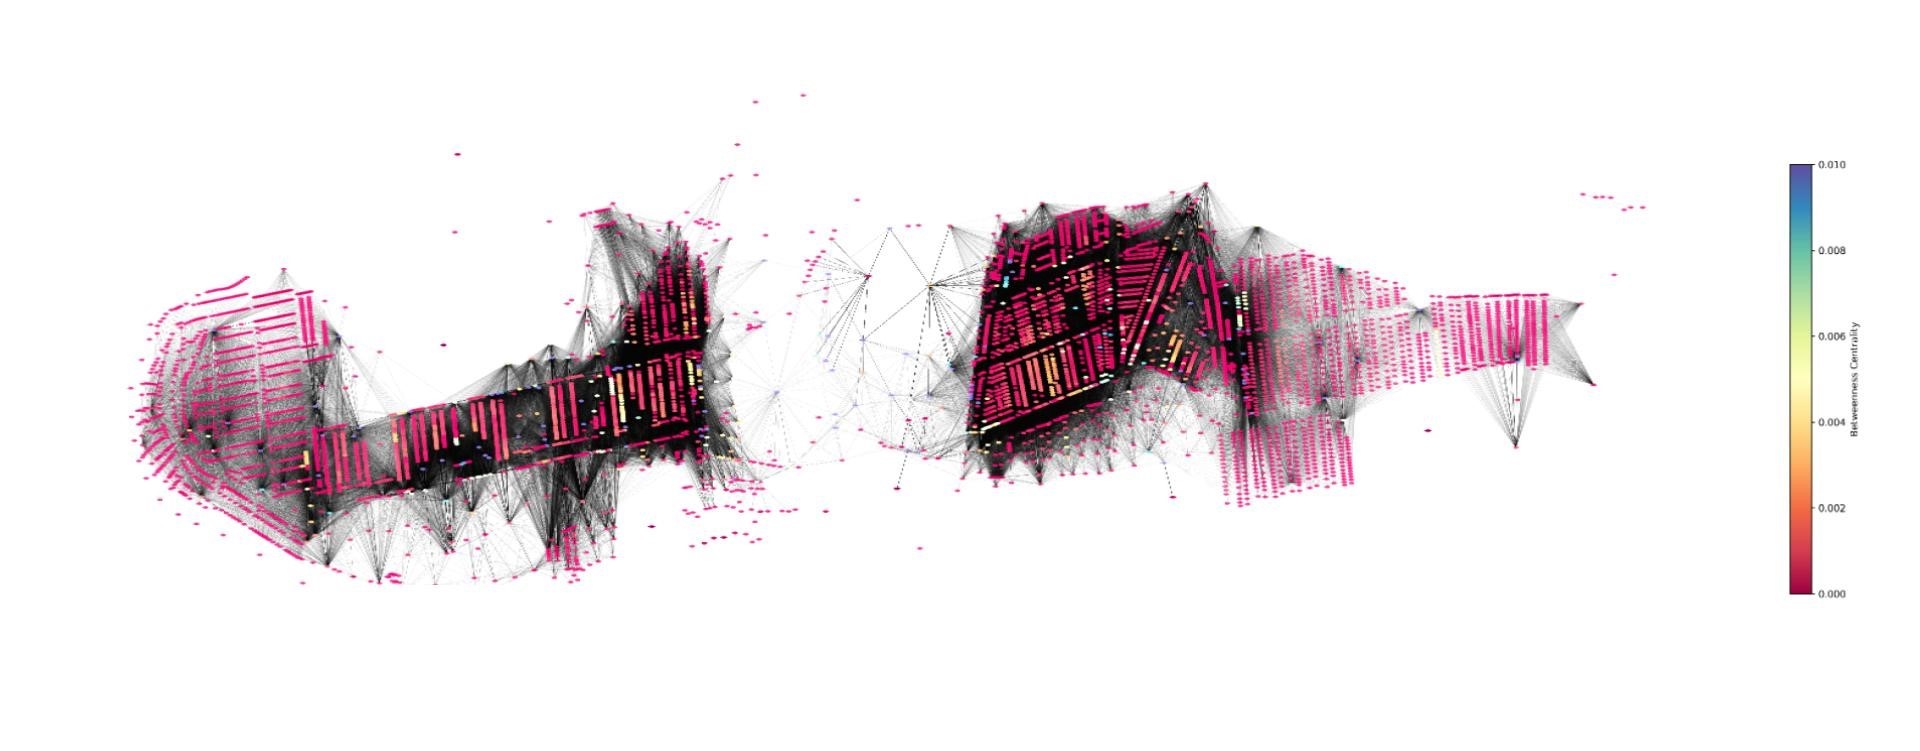
Betweenness centrality measure captures the importance of a node in transferring information from one part of a graph to another. It does so by calculating the number of shortest paths between pairs of nodes in the network that pass through that node. Nodes with high betweenness centrality act as bridges or connectors in the network. This centrality measure helps identify nodes that control the flow of information.
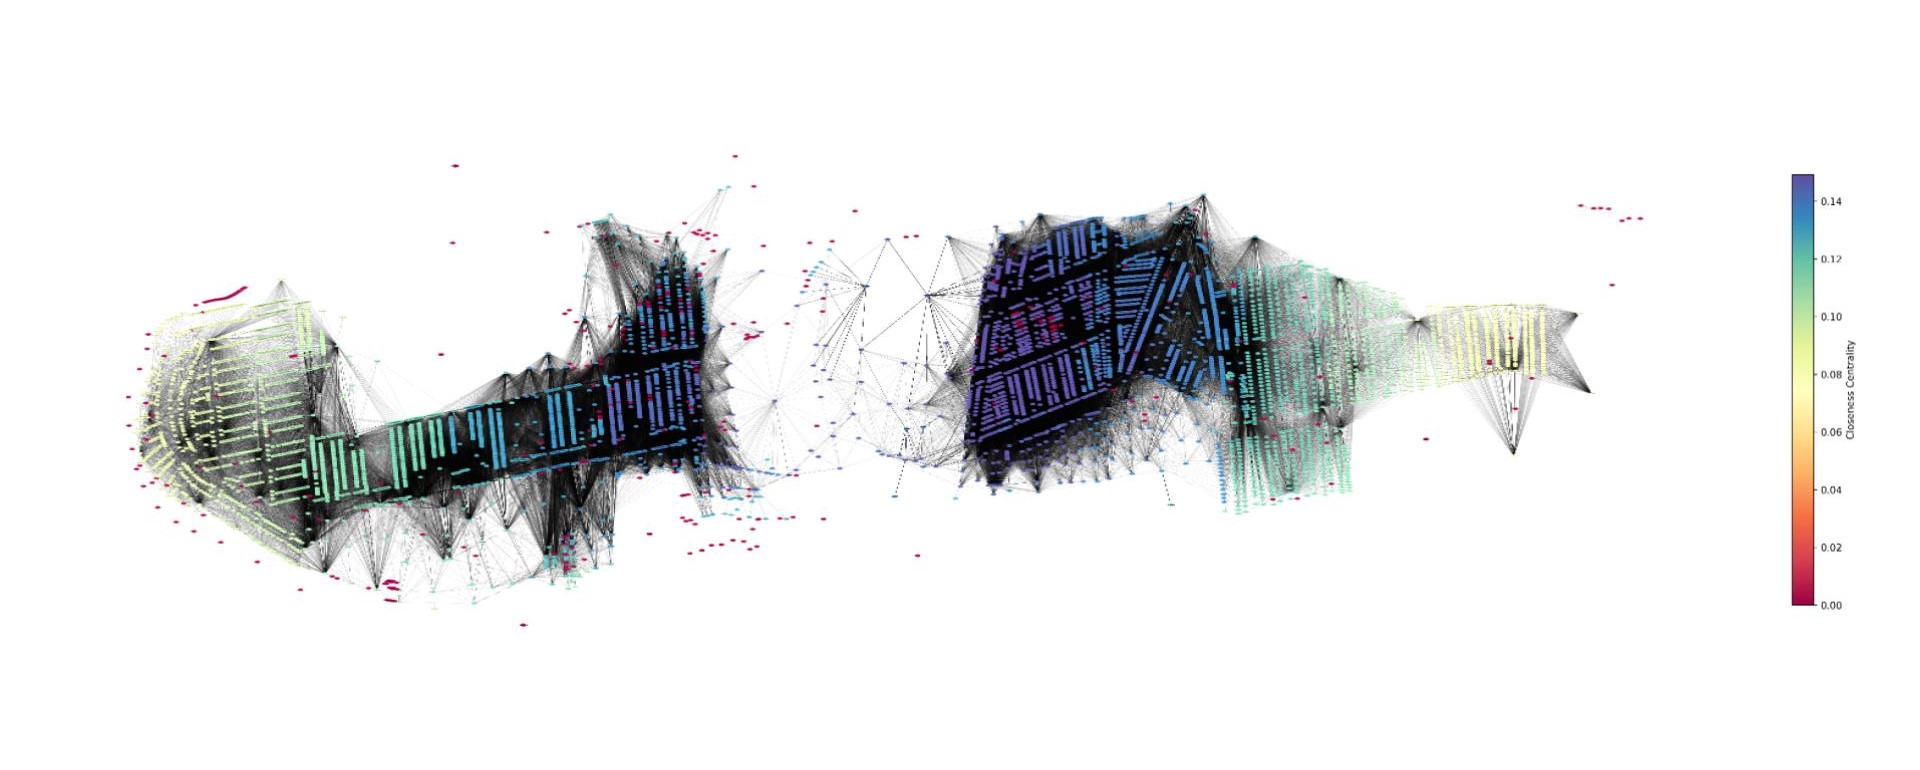
Closeness centrality shows how close the node is to all the other nodes in terms of shortest path length. High closeness centrality nodes can reach other nodes in the network quickly. It can identify nodes that can efficiently disseminate information or interact with others.
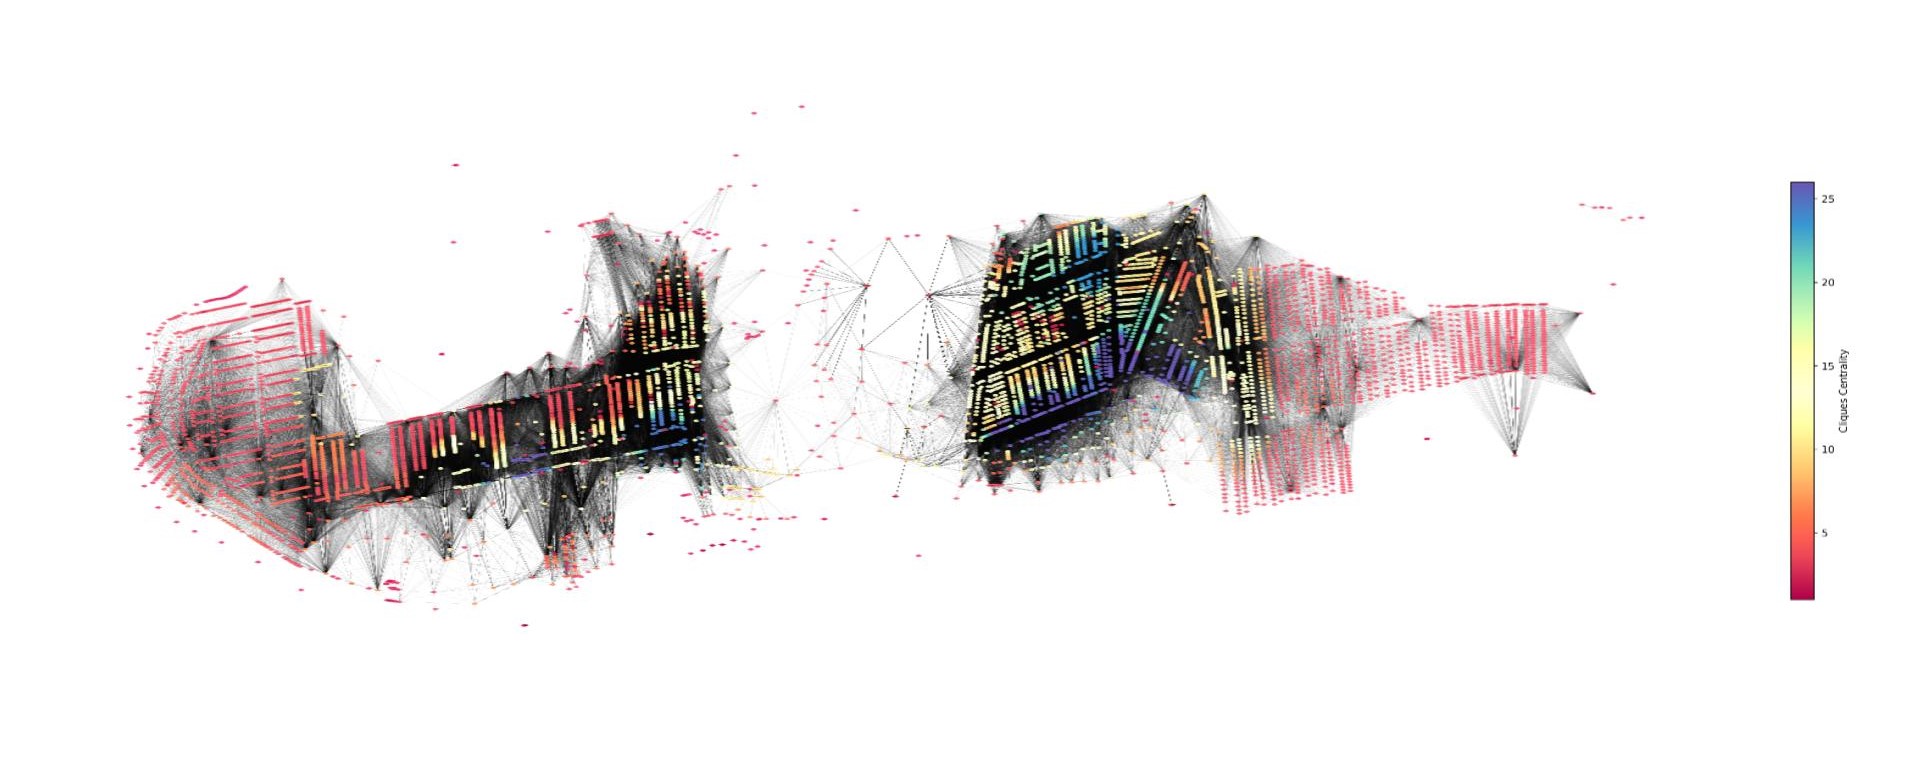
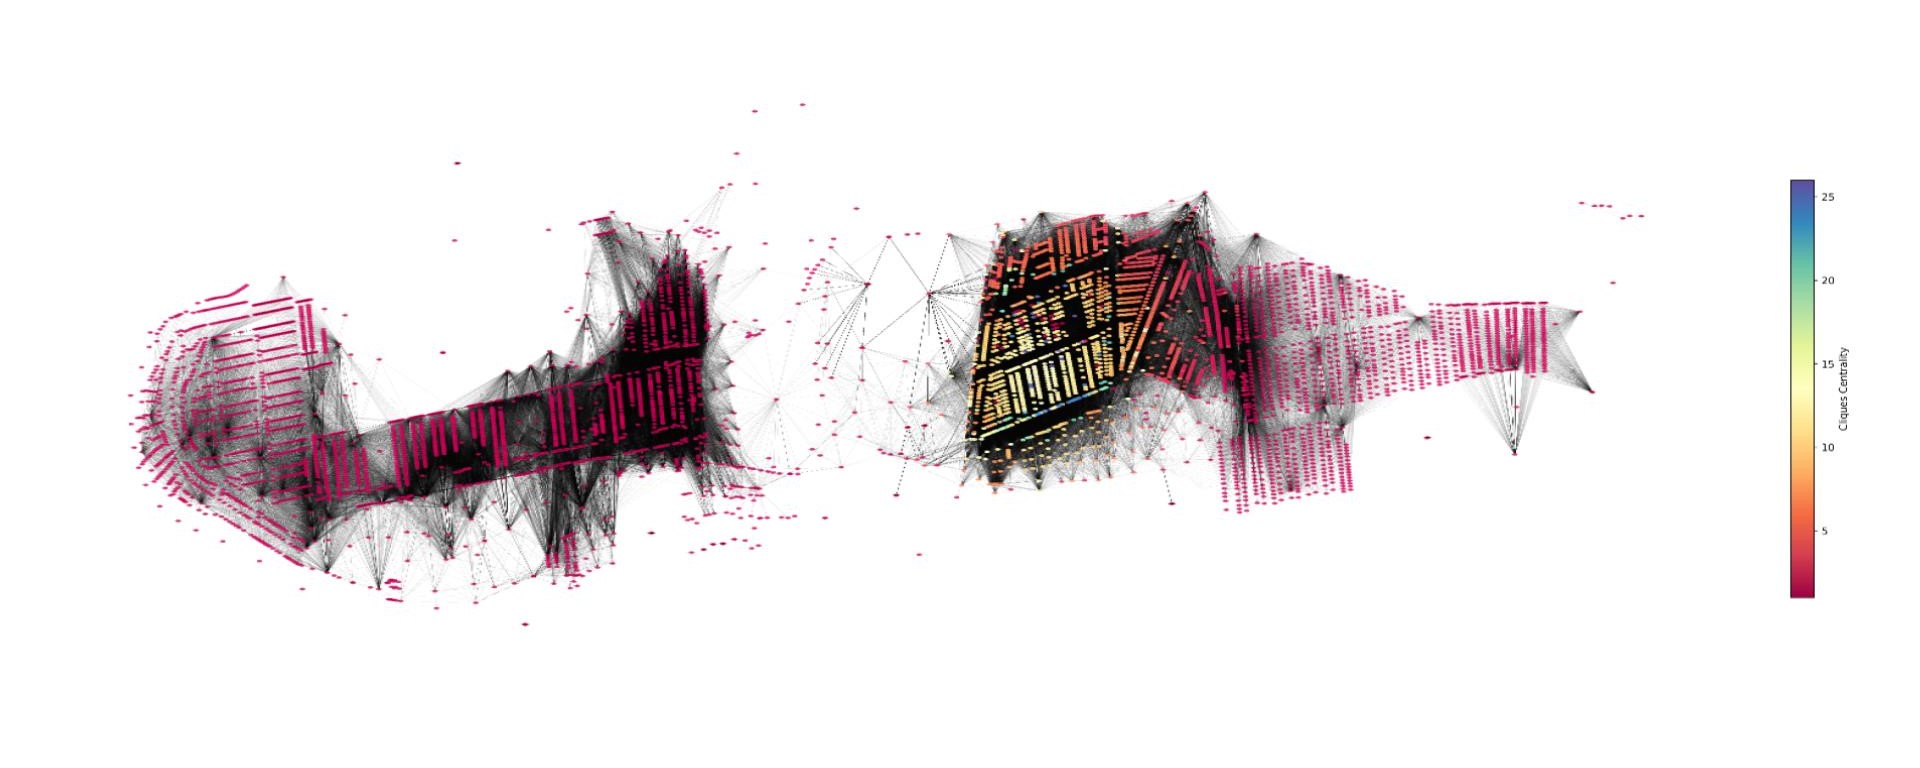
Cliques centrality is a measure of how central a node is within a clique, which is a subset of nodes in the network. Nodes that are a part of larger cliques or connect multiple cliques have higher cliques centrality. It help identify the nodes that form and connect subgroups with a network.
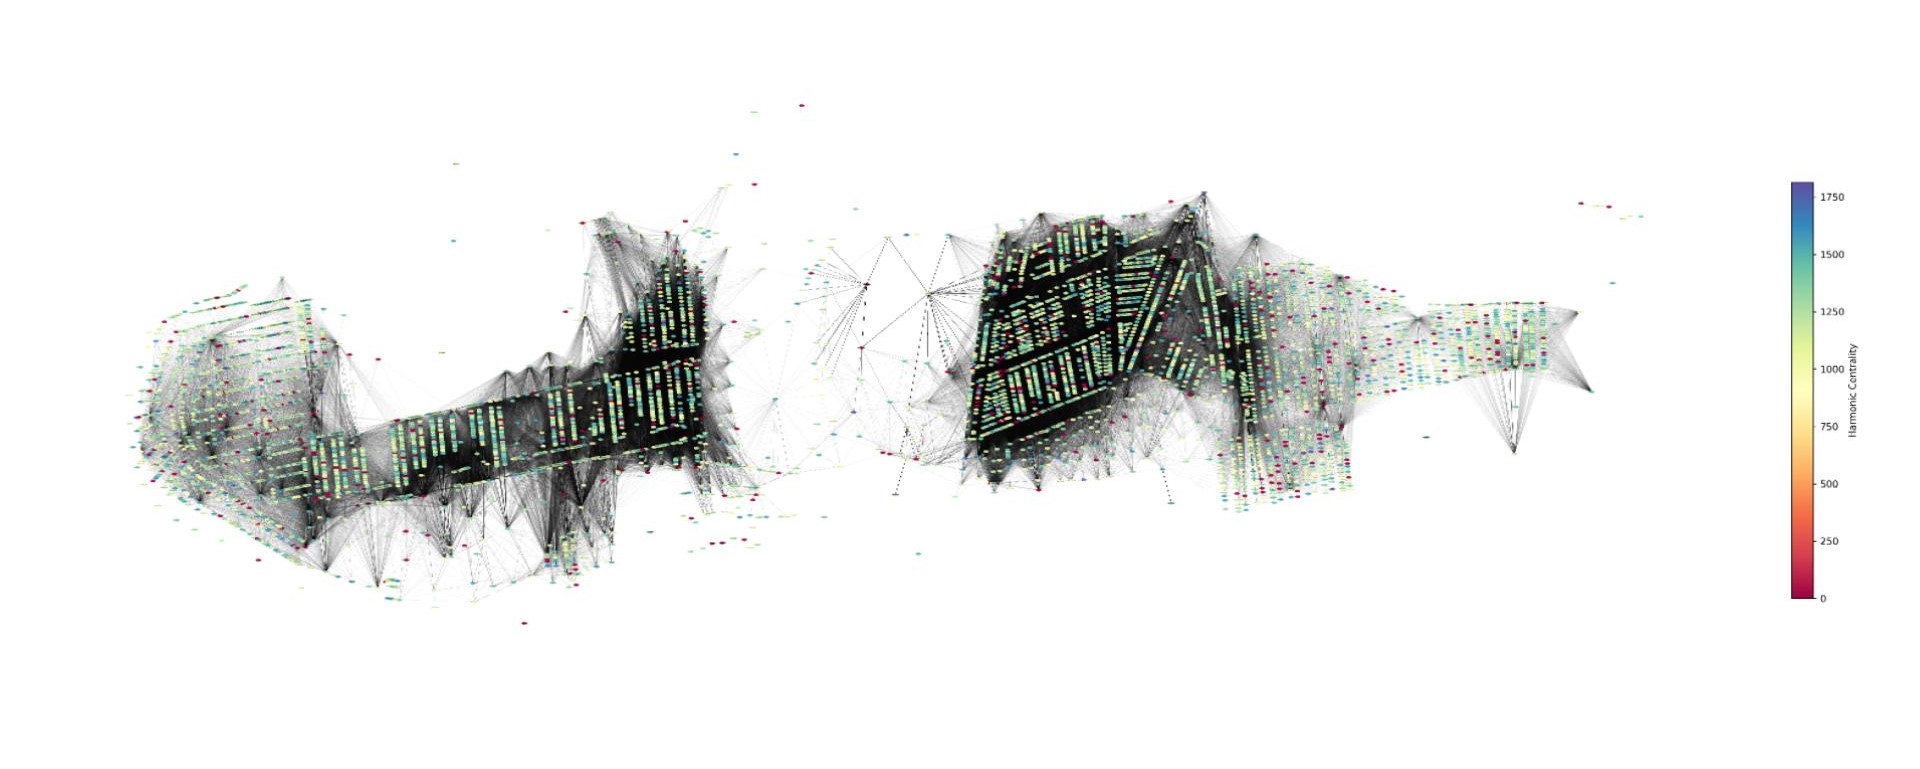
Harmonic centrality uses harmonic mean, it finds the distances from a node to all the other nodes in the network.
Eigenvector centrality measures the importance of a node based on the principle that a node is important if it is connected to other important nodes. It identifies nodes that are connected to other well connected nodes, hence helping in finding influential nodes
Load centrality calculates the sum of traffic flow that passes through a node in the network.
Graph Processing
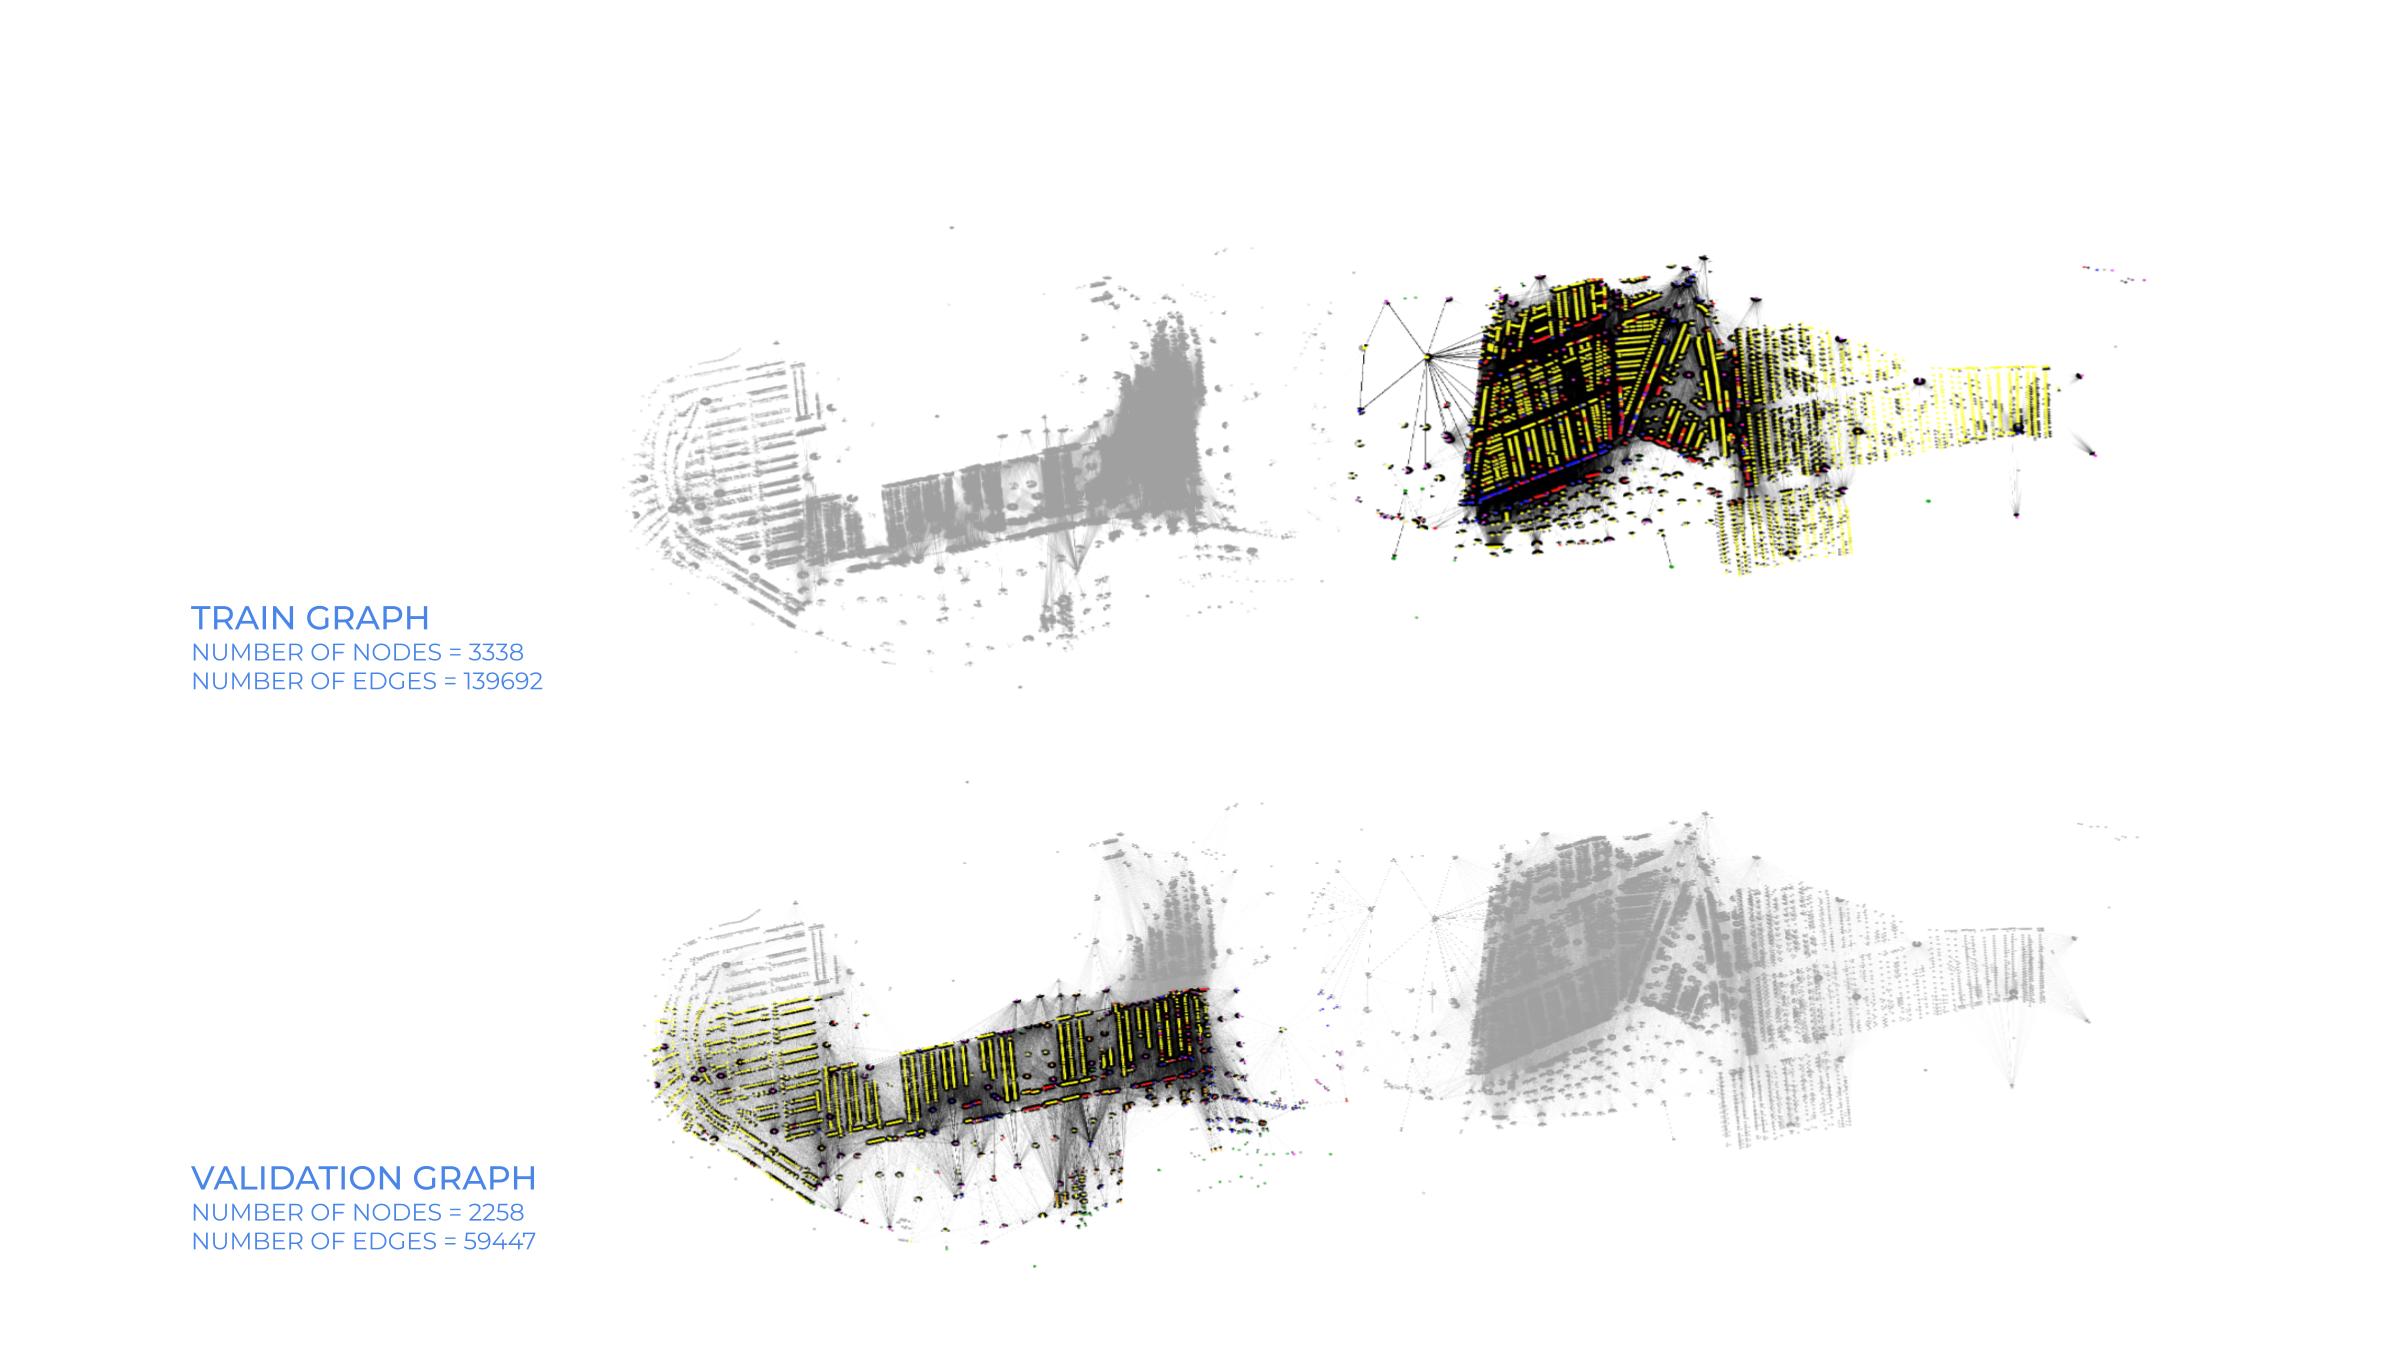
The large graph created needed to be divided for training and validation purposes. A train mask and a valid mask was created by clustering the graph.Clusters were created by intersecting the nodes with a polygon. The largest one is allotted to train graph, while the one with second highest number of edges is made to validation graph.
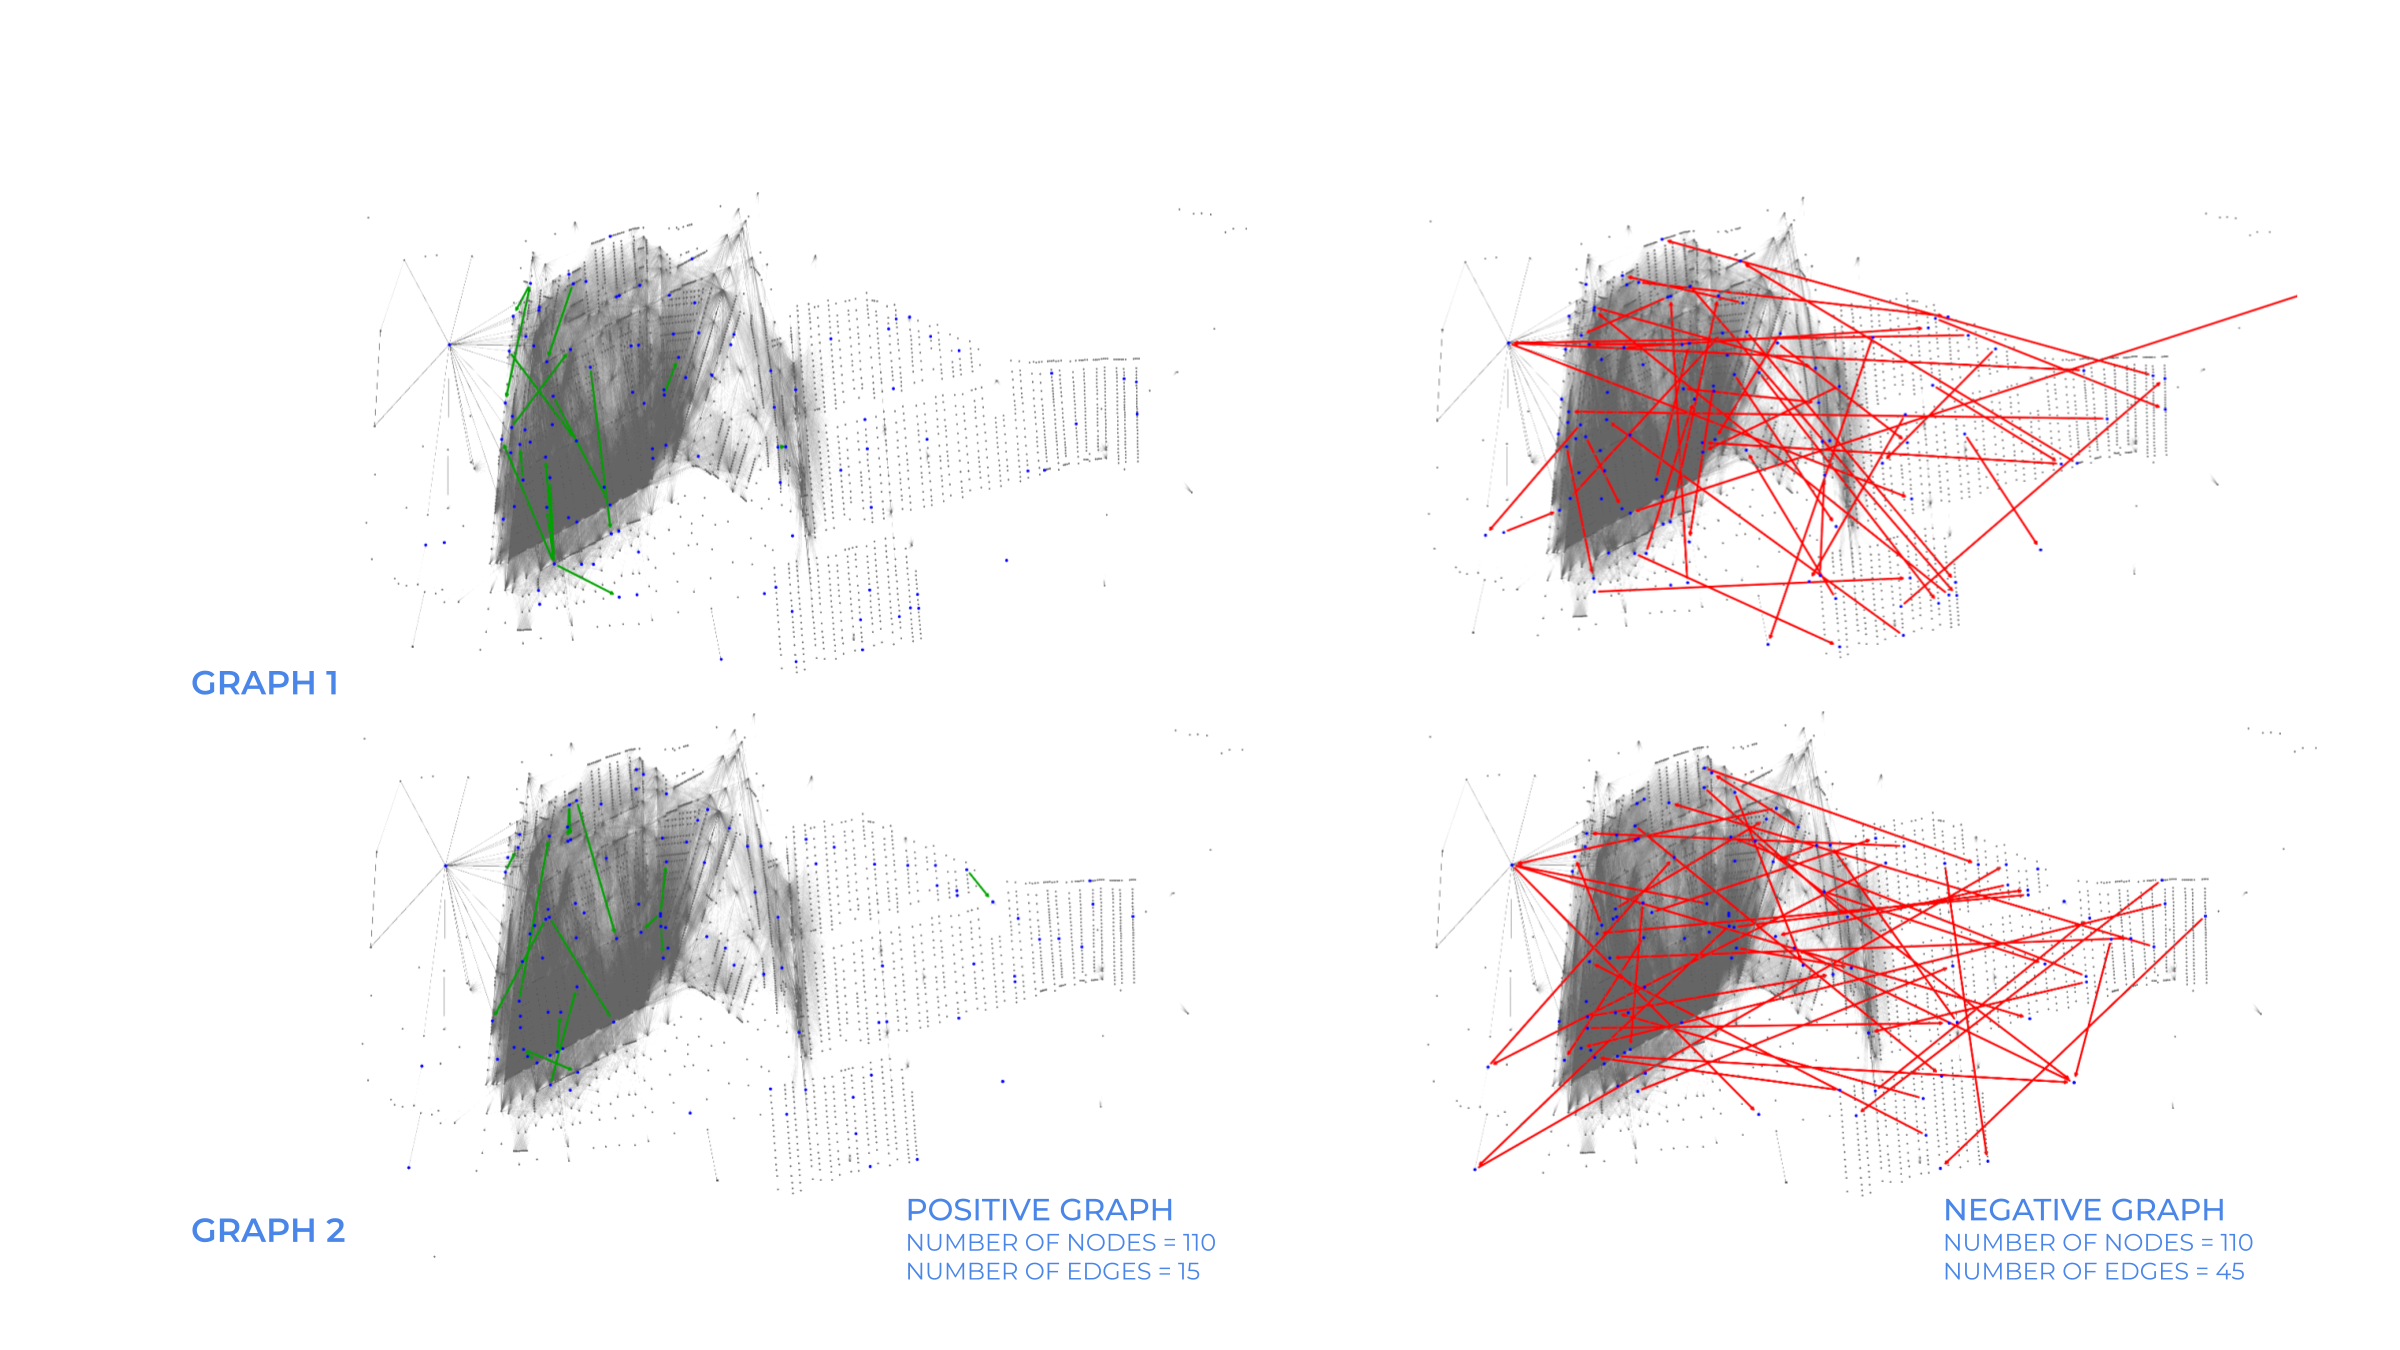
For negative sampling of sub graphs for training, a batch size of 15 was considered. So, the positive graph as 15 edges and negative graph has 45 as a global uniform of 3 was used. With changing batch size the number of sub graphs created also change. With the batch size of 15, 223 sub graphs were created for the purpose of training.
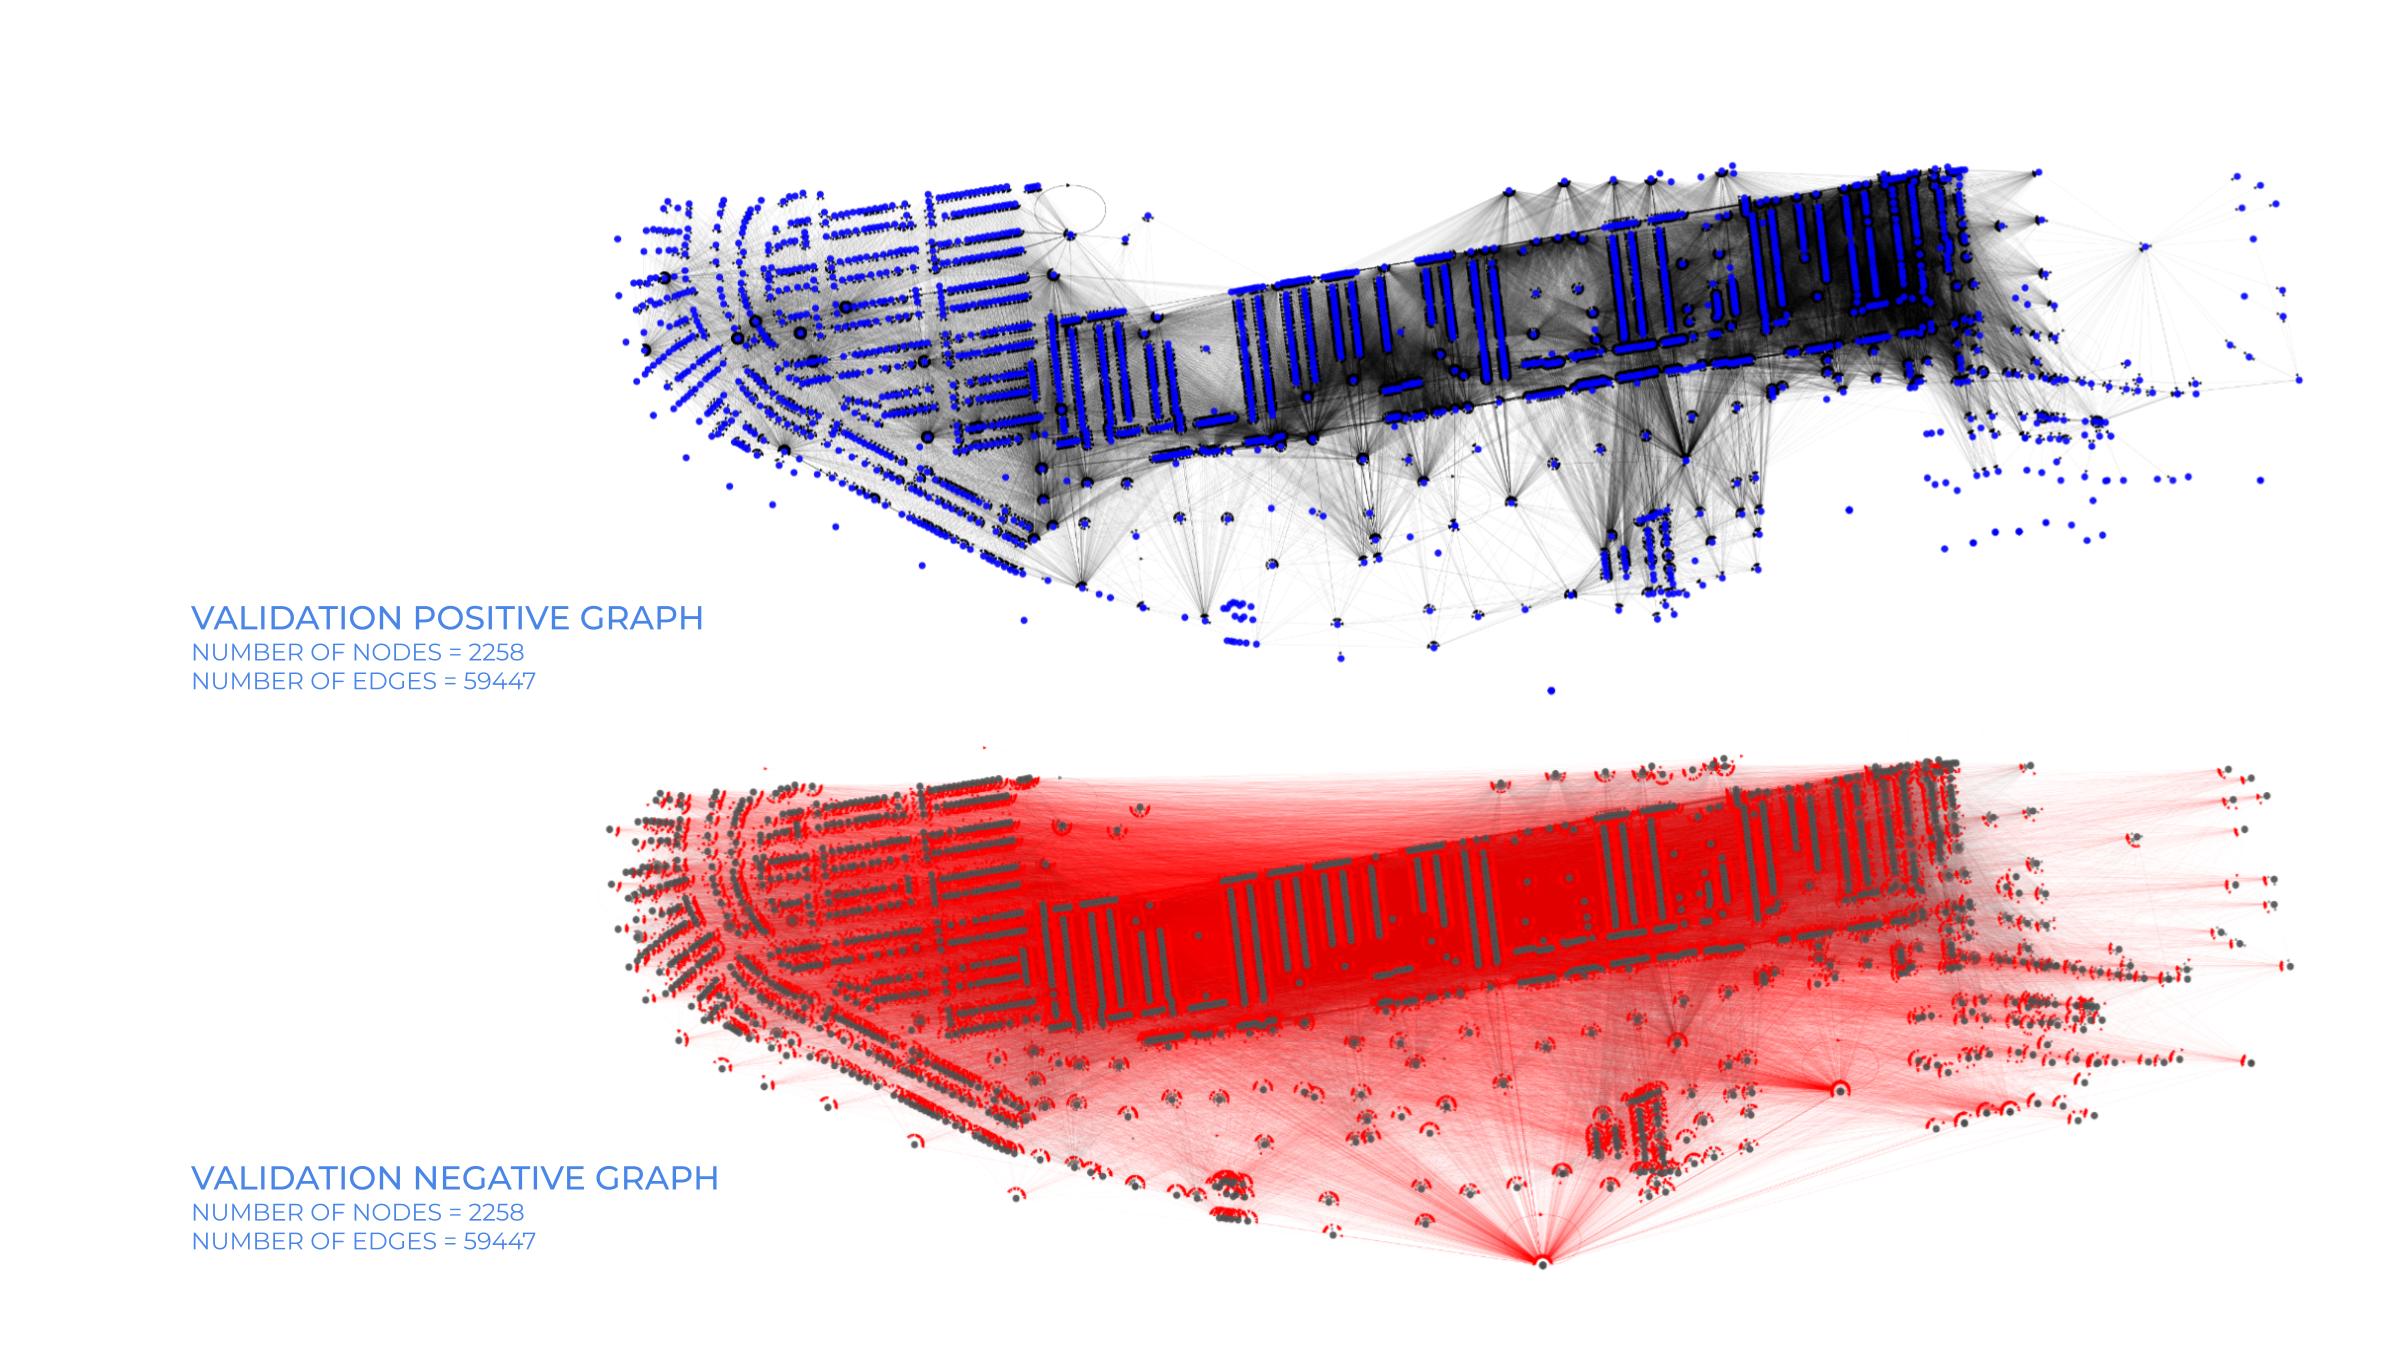
The validation graph was processed differently using sparse adjacency matrix, where each entry represents an edge between nodes. The existing edges form a part of validation graph while a negative adjacency matrix is created where self edges and positive edges are differentiated from all the other negative ones. It is ensured that the number of negative edges match the positive edges, so out of all the possible negative edges only the required number are picked. Since the nodes are connected based on proximity, the negative graph has edges connecting the nodes that are far away.
Graph Node Representation Model : A PyTorch neural network model is used to learn and extract meaningful representation of nodes in a graph. The model processes graph structured data using 2 GraphSAGE layers. It takes different MetaGraphs for different blocks, updating node features through each block. ReLU activation function was applied between blocks.
Edge Scoring Model : Another PyTorch neural network model is used for predicting scalar scores for edges in a graph. It takes as input a graph and node features and computes a scalar score for each edge in the graph. This is done by concatenating features from source and destination nodes, passing them through two linear layers with a ReLU activation, and returning the edge scores.
The model is trained using a binary classification objective, typically binary cross-entropy loss. It learns to distinguish between positive edges and the negative edges. Throughout training, the model’s performance is monitored on a separate validation graph, helping to ensure that the model generalizes well to unseen data and can accurately predict links in new situations.
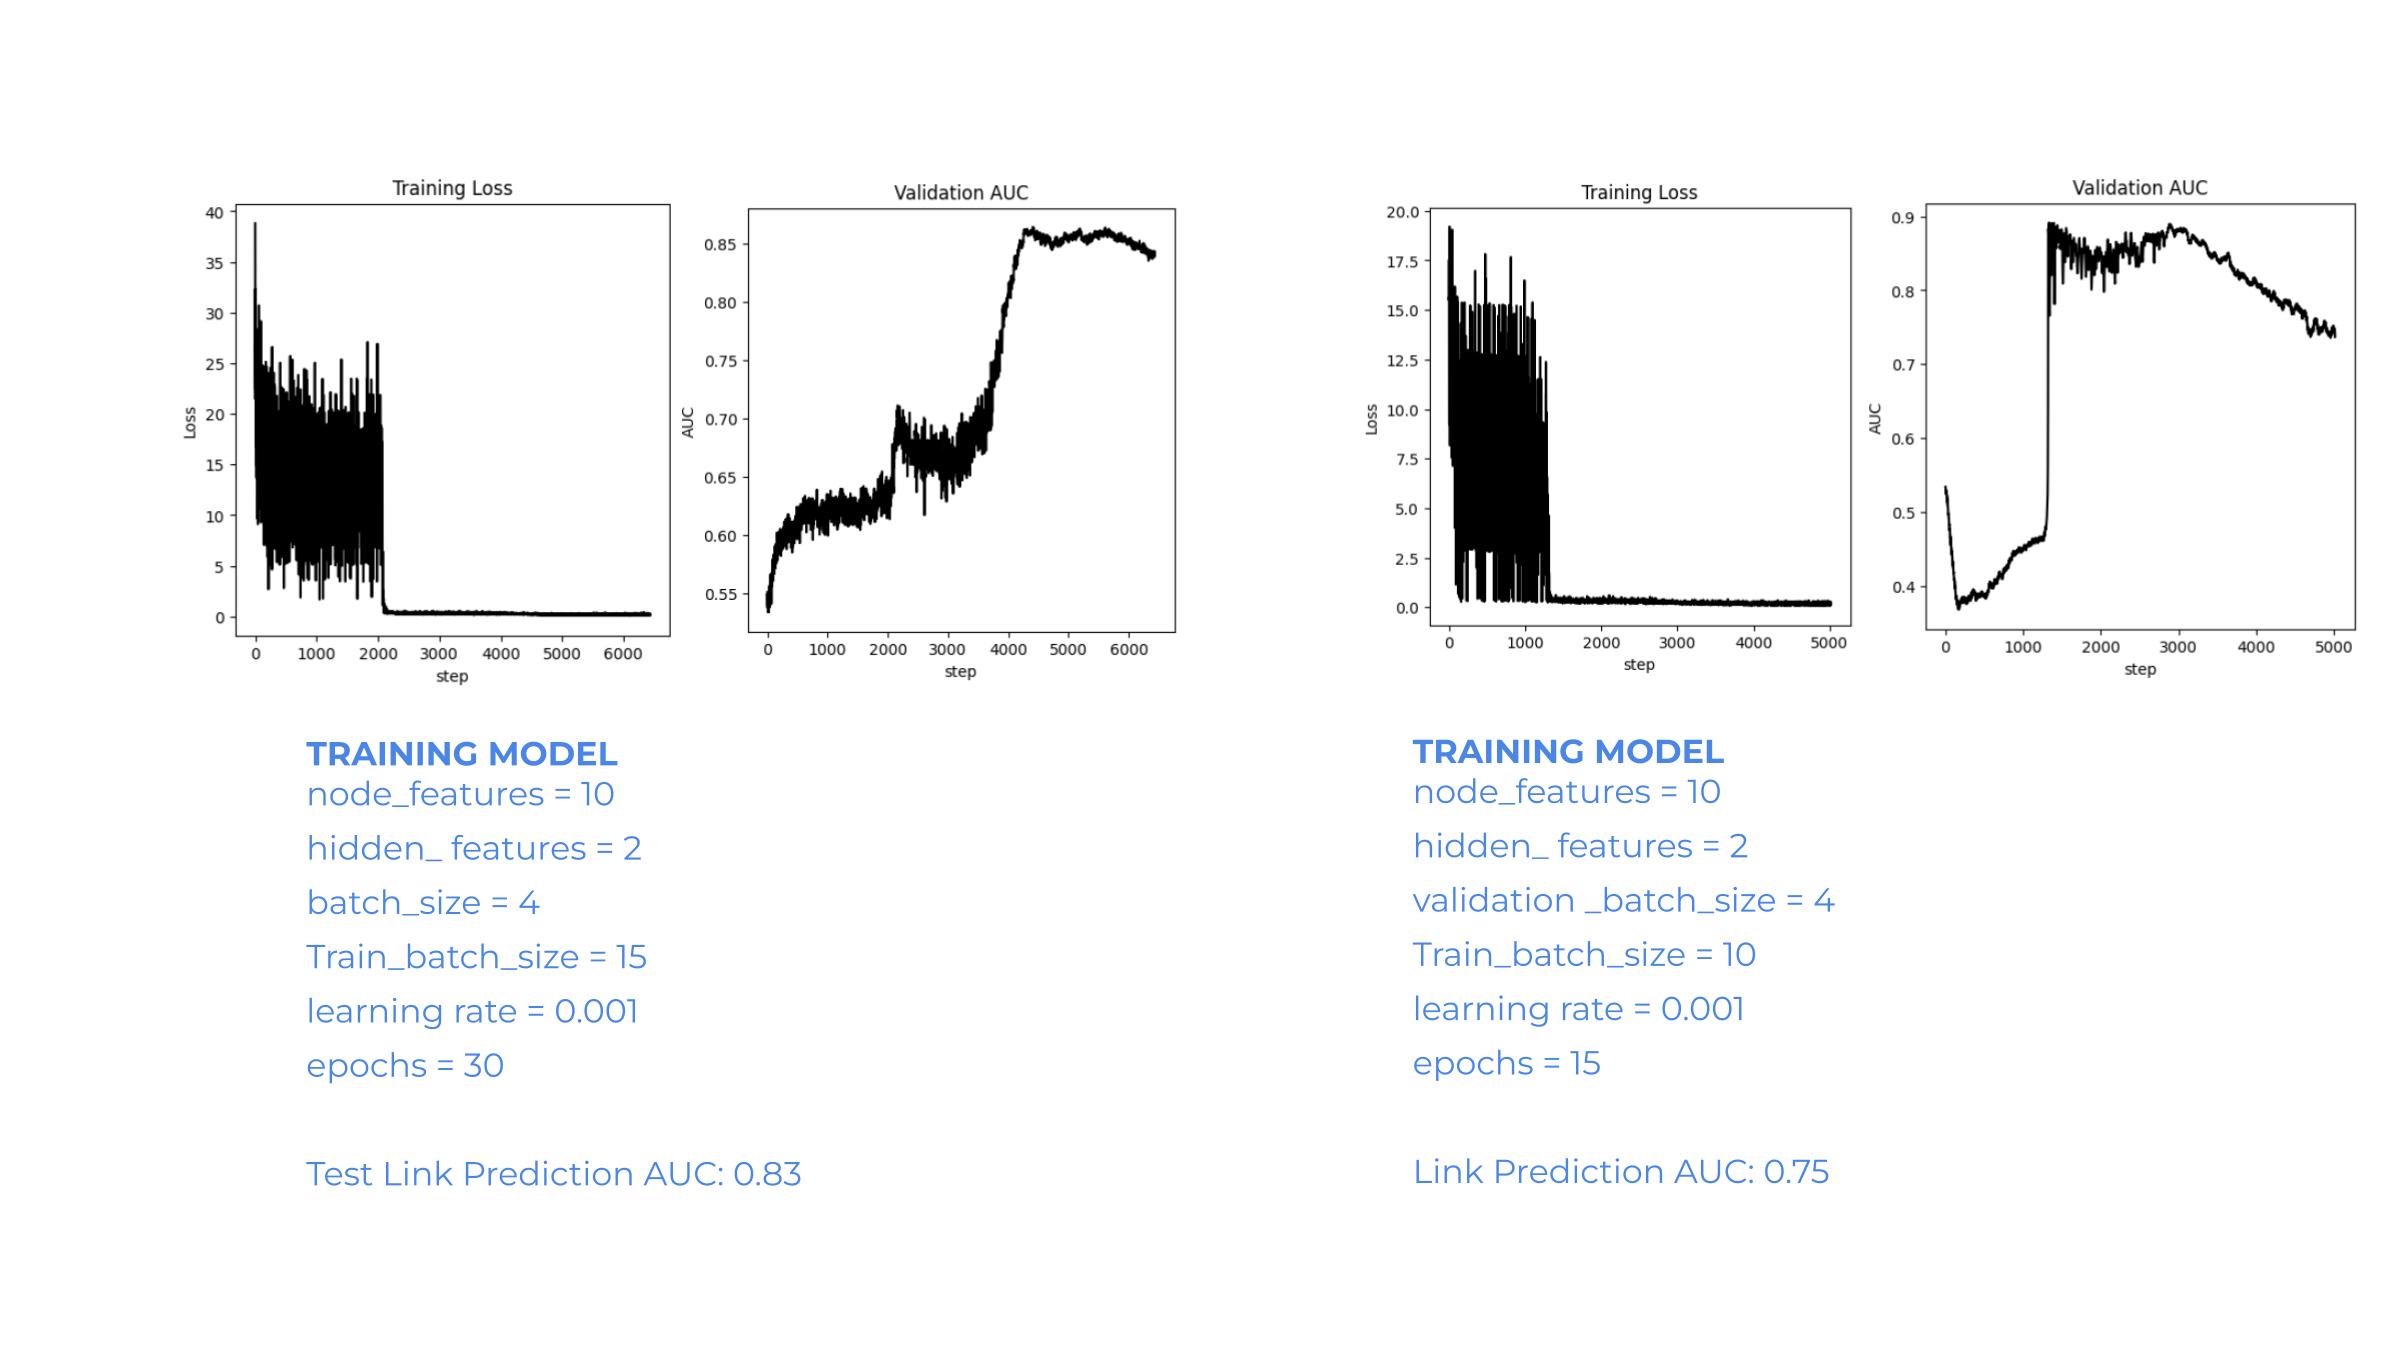
Image below shows some results from the model training process. The first one trained for 30 epochs, with 2 hidden features, learning rate of 0.001, with a validation batch size of 4 and a test batch size of 15 shows a link prediction AUC on test graph as 0.83. The next one trained for only 15 epochs, with 2 hidden features, learning rate of 0.001, with a validation batch size of 4 and a test batch size of 10 shows a link prediction AUC on test graph as 0.75. These two outcomes were just a few from many models trained as a part of this experiment.