
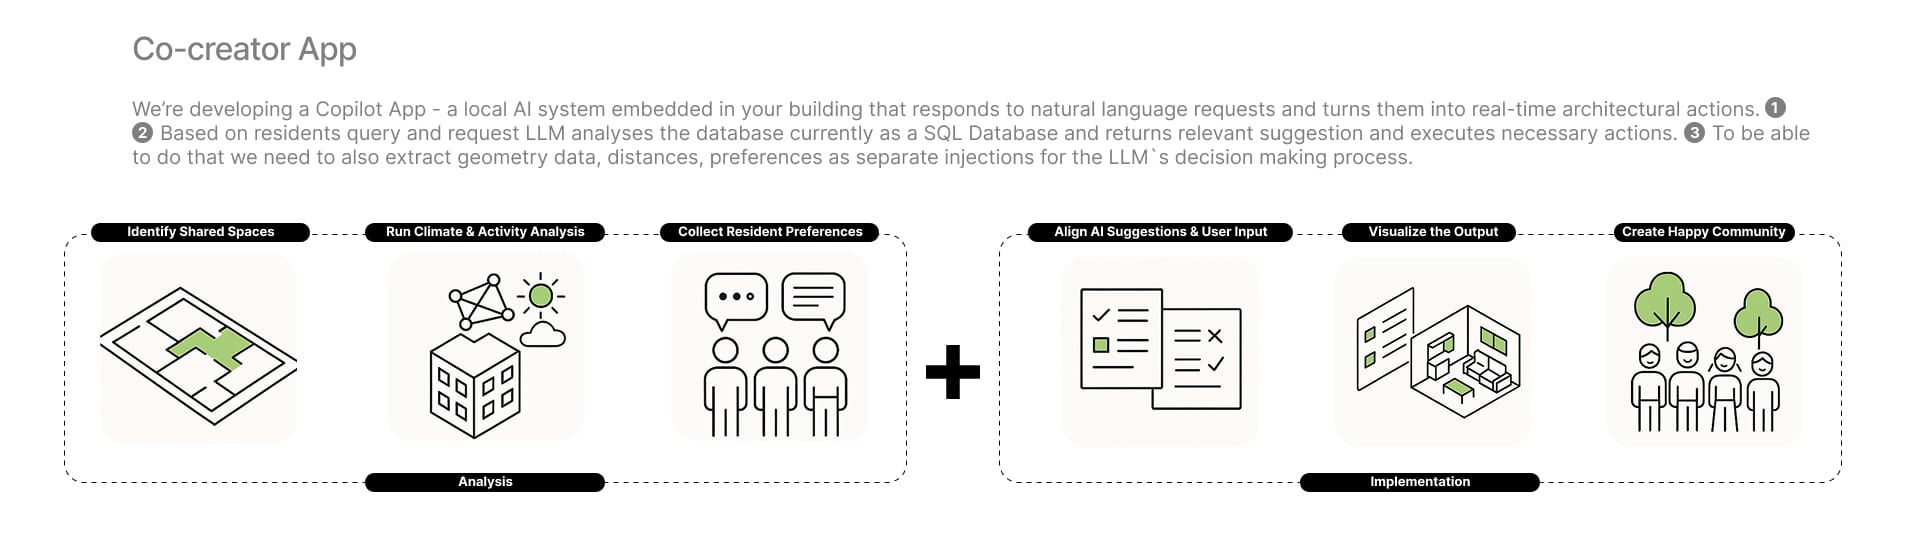
Our Solution: The Co-creator App
We’ve developed a Copilot App – a local AI system that lives in your building and speaks your language. Literally. You make natural language requests, and it translates them into real architectural actions by understanding the complex relationships between spaces and residents through graph databases and GDS algorithms.
Here’s how it works: residents make queries, our LLM analyzes the database (currently SQL-based), and returns relevant suggestions while executing necessary actions. The system extracts geometry data, distances, and preferences as separate inputs to guide the LLM’s decision-making process.
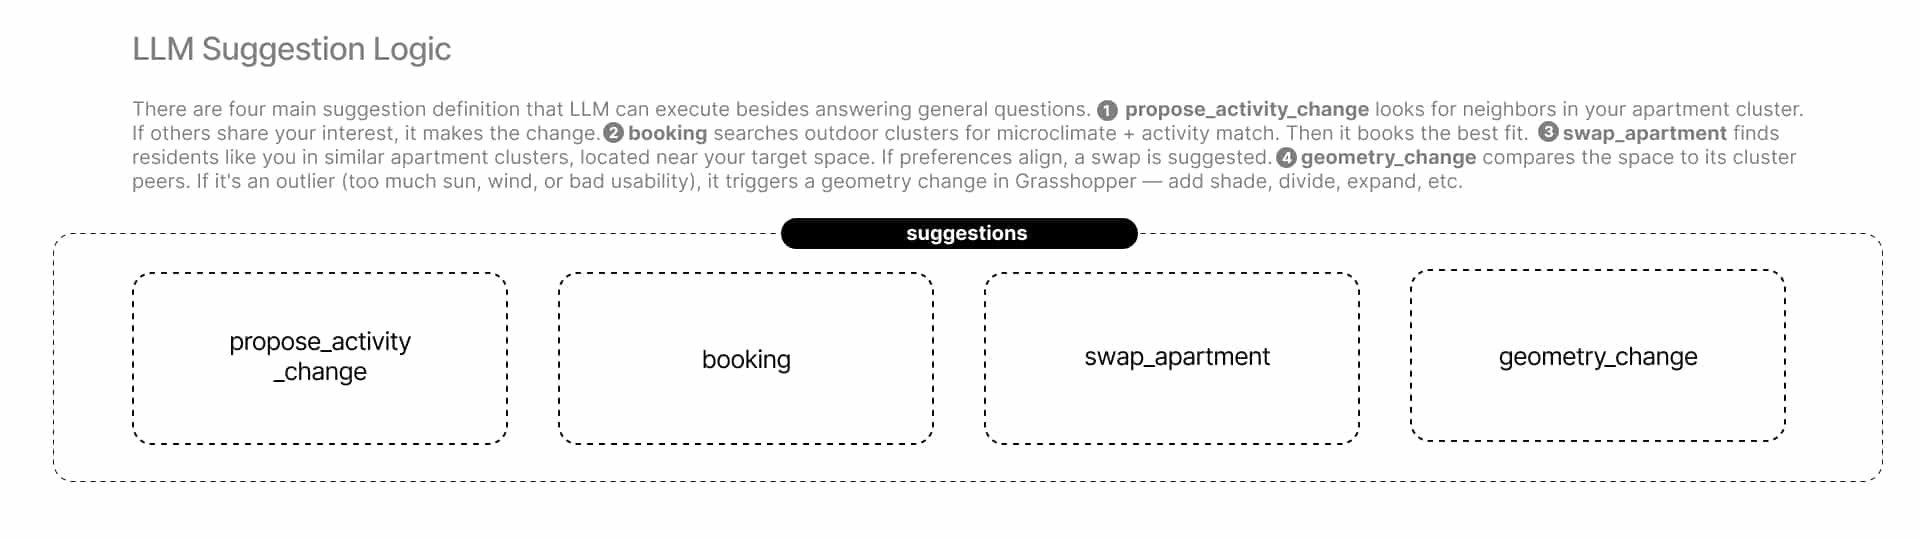
Four Core Functions
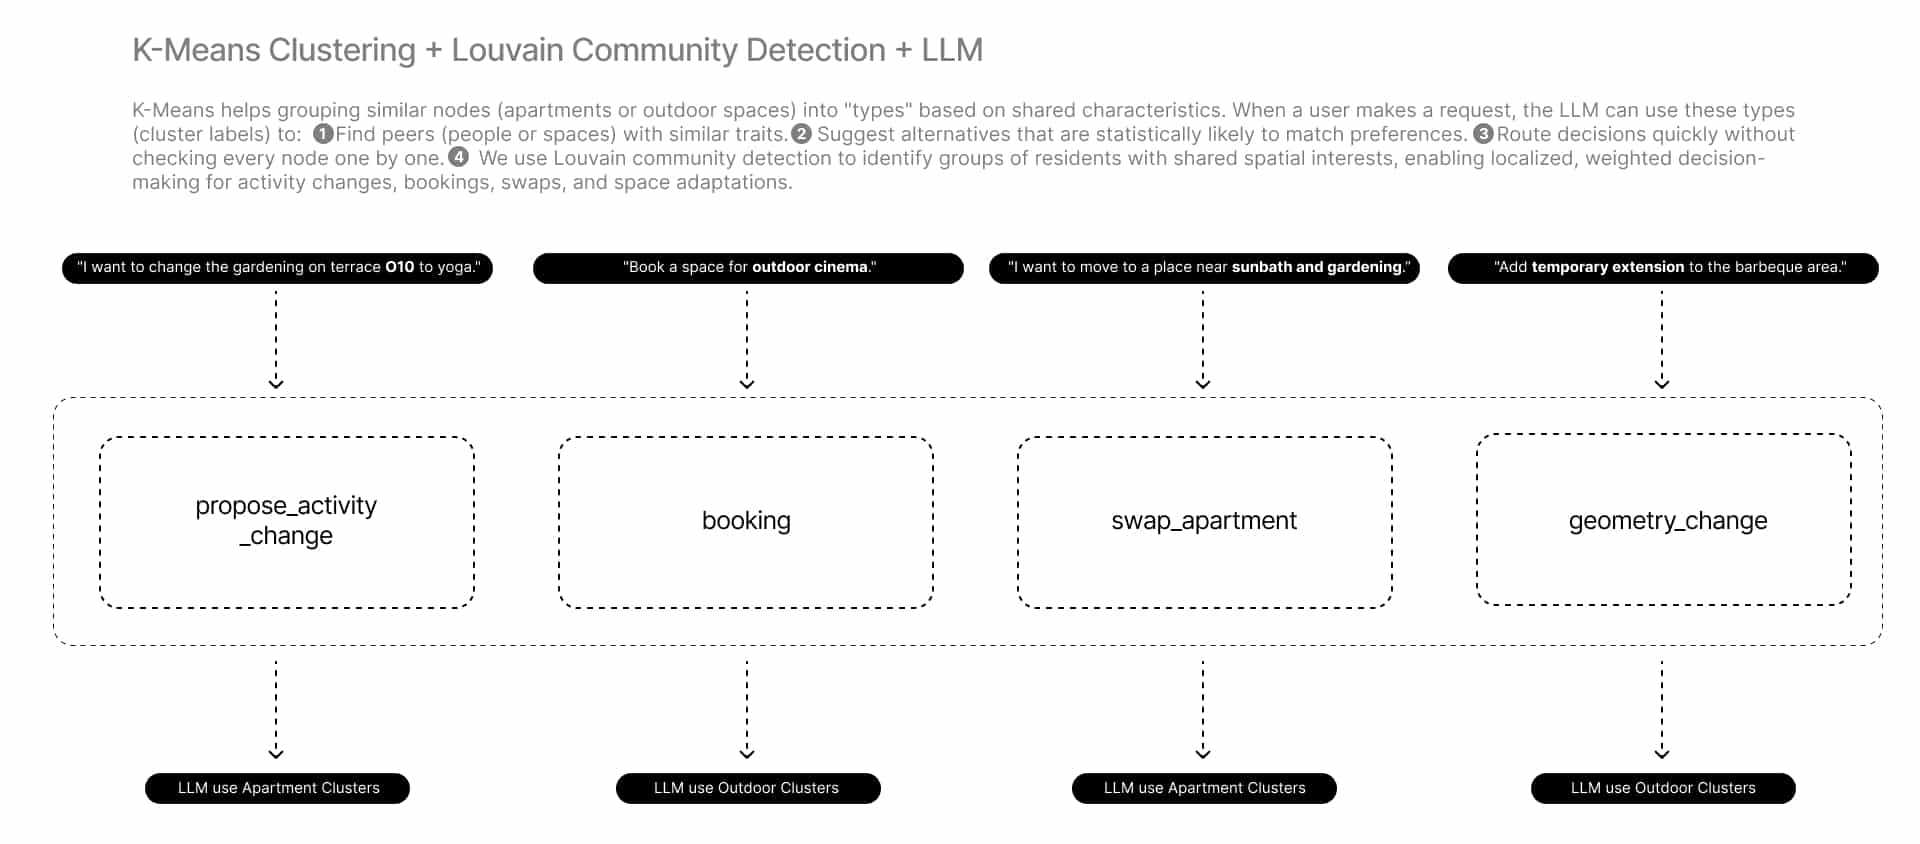
Our system can execute four main types of suggestions:
+ Propose Activity Change – It looks at your apartment cluster and finds neighbors who share your interests. If there’s a match, it facilitates the change together.
+ Smart Booking – When you need outdoor space, it searches clusters for the perfect microclimate and activity combination, then books your ideal match.
+ Apartment Swap – It identifies residents with similar preferences in comparable apartment clusters near your desired location. When preferences align, it suggests a mutually beneficial swap.
+ Geometry Change – The system compares your space to cluster peers. If it detects outliers – too much sun, excessive wind, or poor usability – it triggers real-time geometry adjustments in Grasshopper, adding shade, dividing spaces, or expanding areas as needed.
Our Technical Approach
We’ve implemented two key strategies:
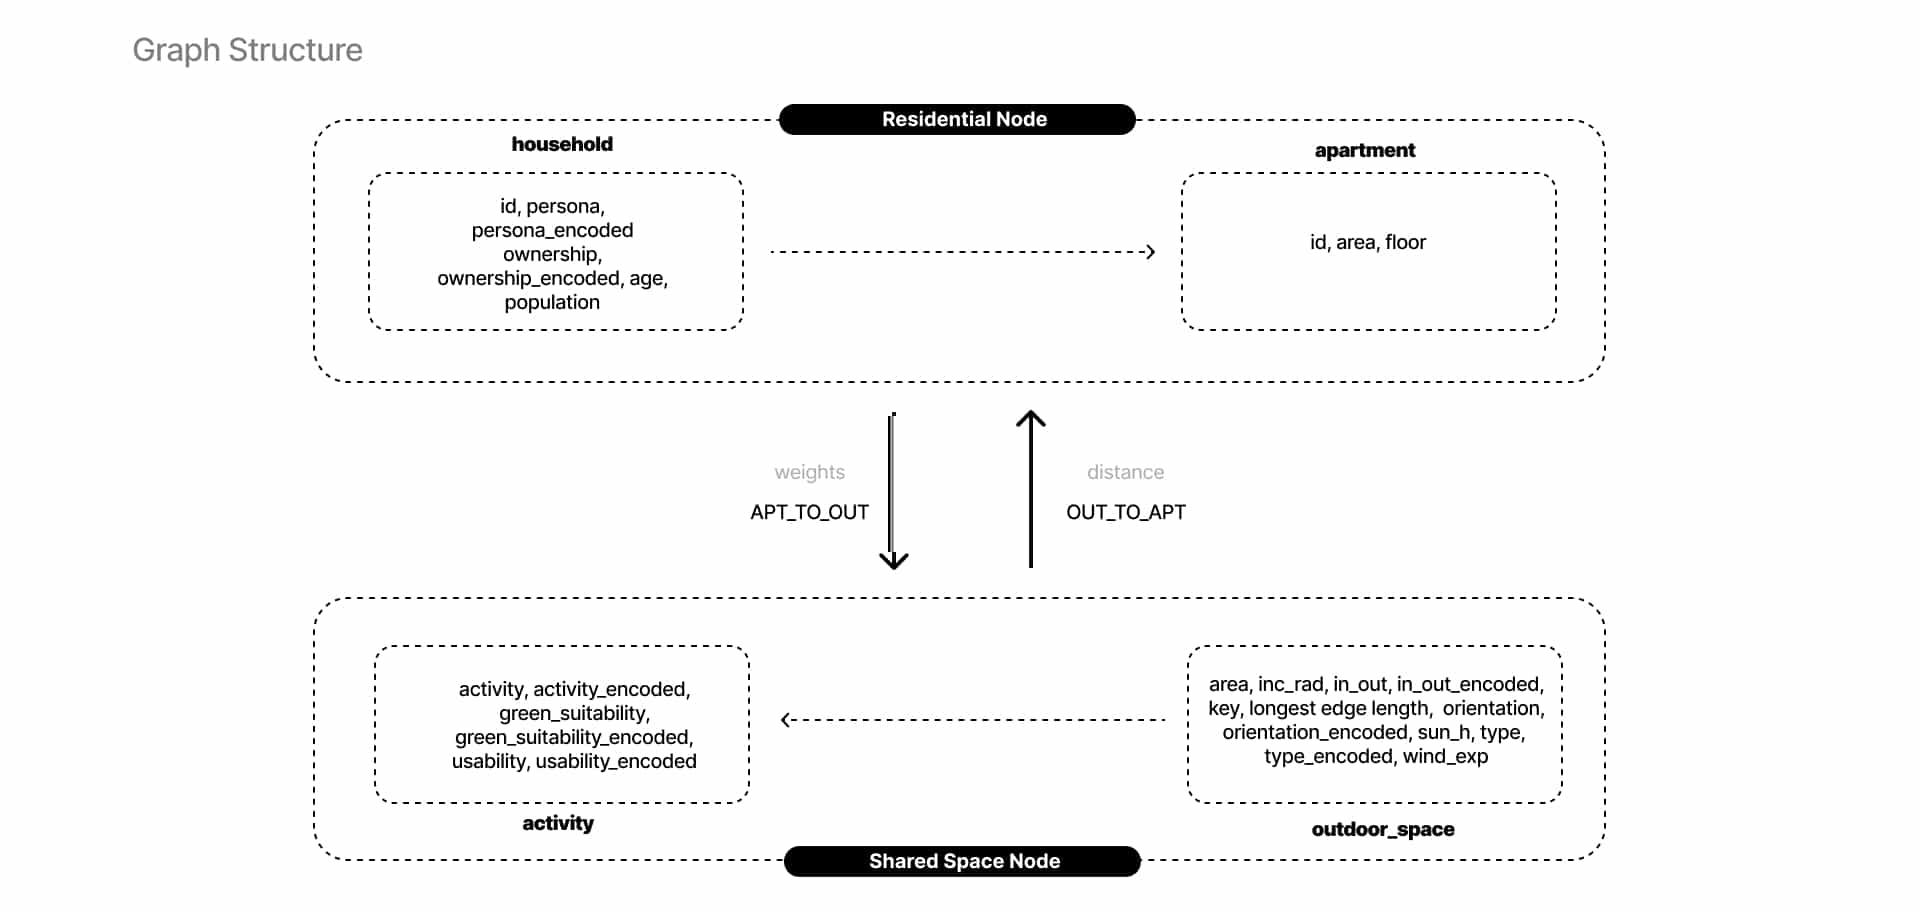
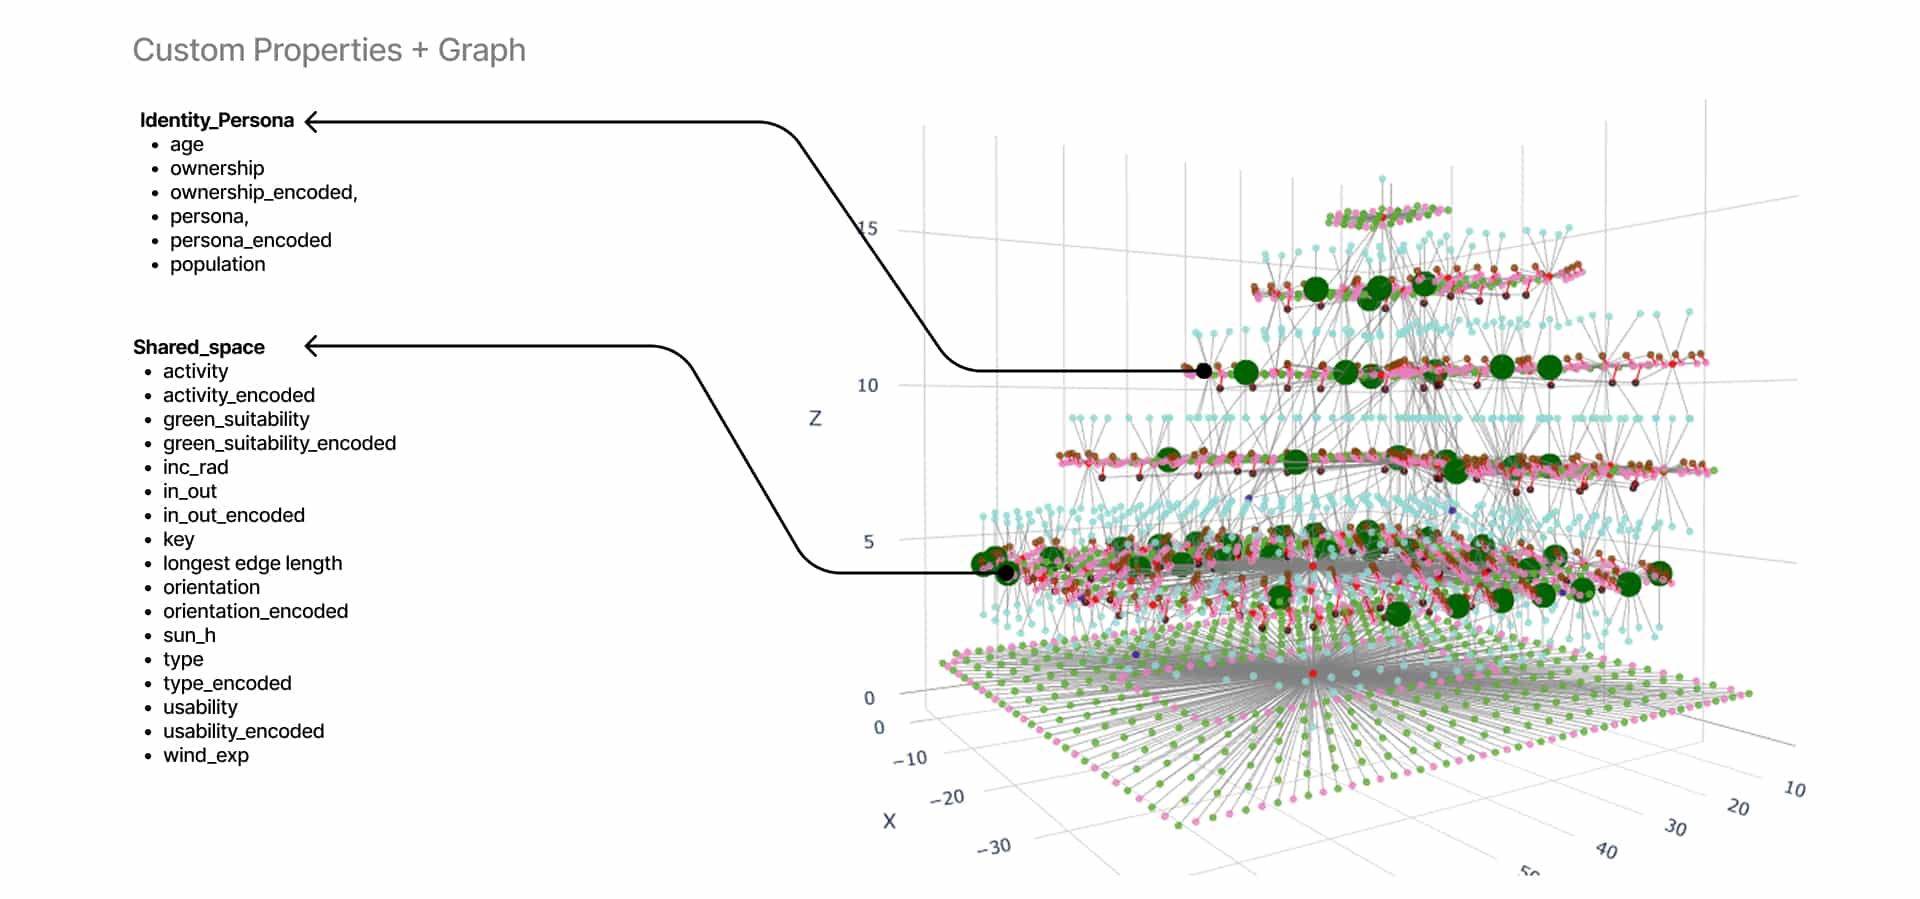
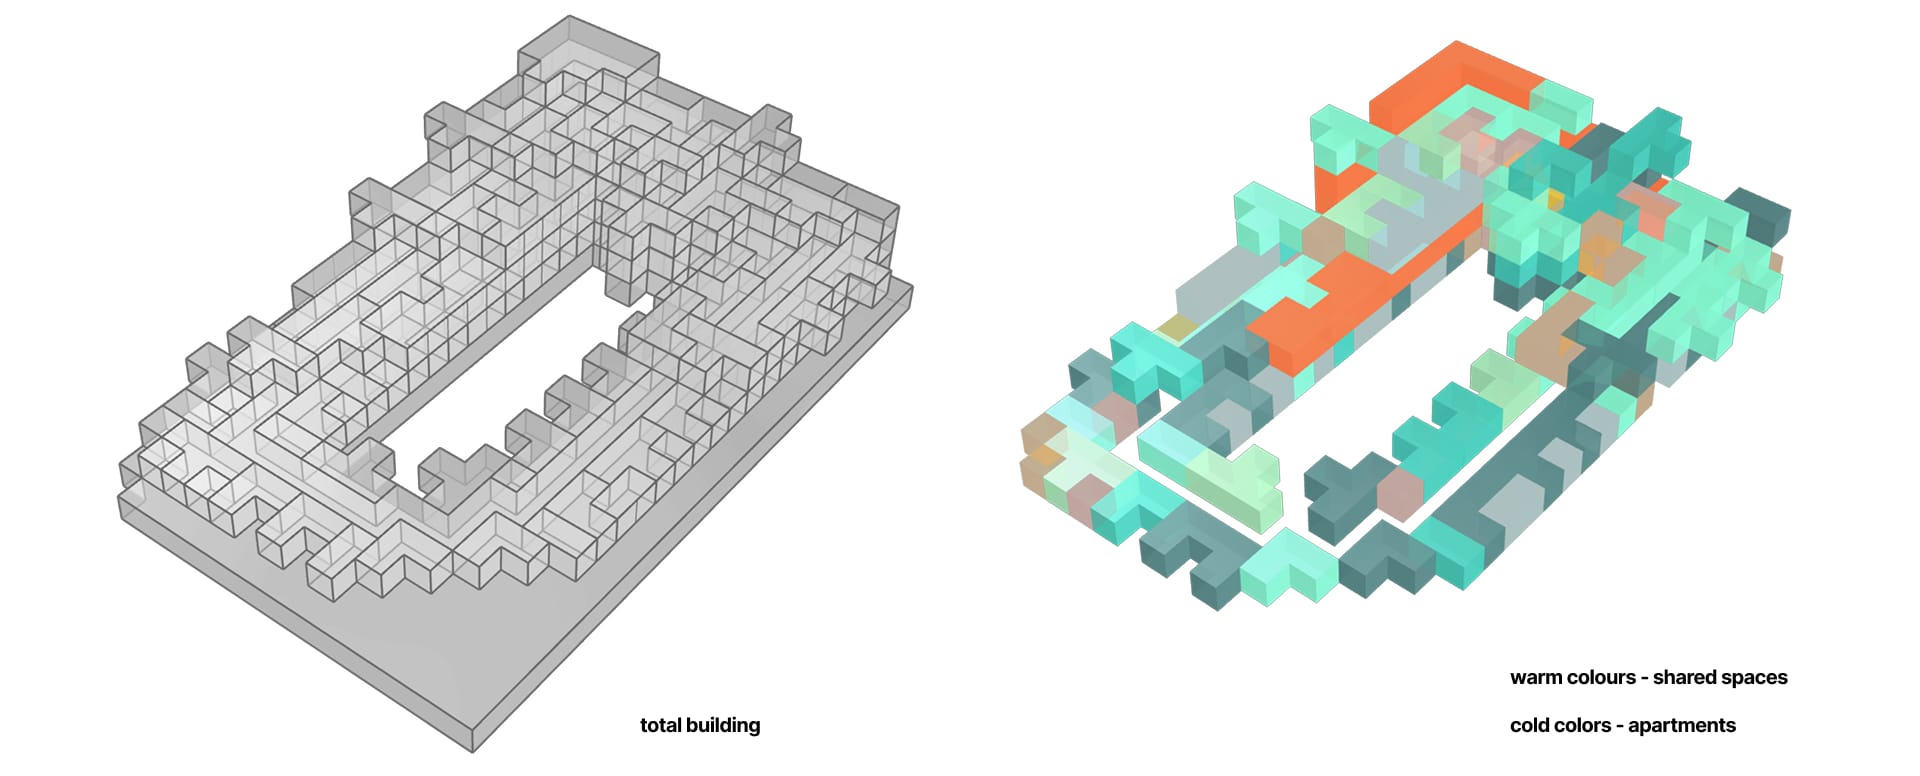
+ Enhanced Node Properties: We’ve added custom properties to both shared space and apartment nodes, incorporating geometry data alongside predefined activities, usability metrics, and green space suitability.
+ Intelligent Edge Relationships: Our edges connecting shared spaces with apartments now include labels, properties, distances, and weights for our voting system. This system democratically determines how residents actually use shared spaces, enabling richer graph queries and helping our LLM spot patterns and opportunities that might otherwise go unnoticed.
The Power of Clustering
We use K-Means clustering to group similar nodes – whether apartments or outdoor spaces – into meaningful types based on shared characteristics. When you make a request, the LLM leverages these cluster labels to find peers with similar traits, suggest statistically relevant alternatives, and route decisions efficiently without examining every single node
Custom Properties + Graph Database
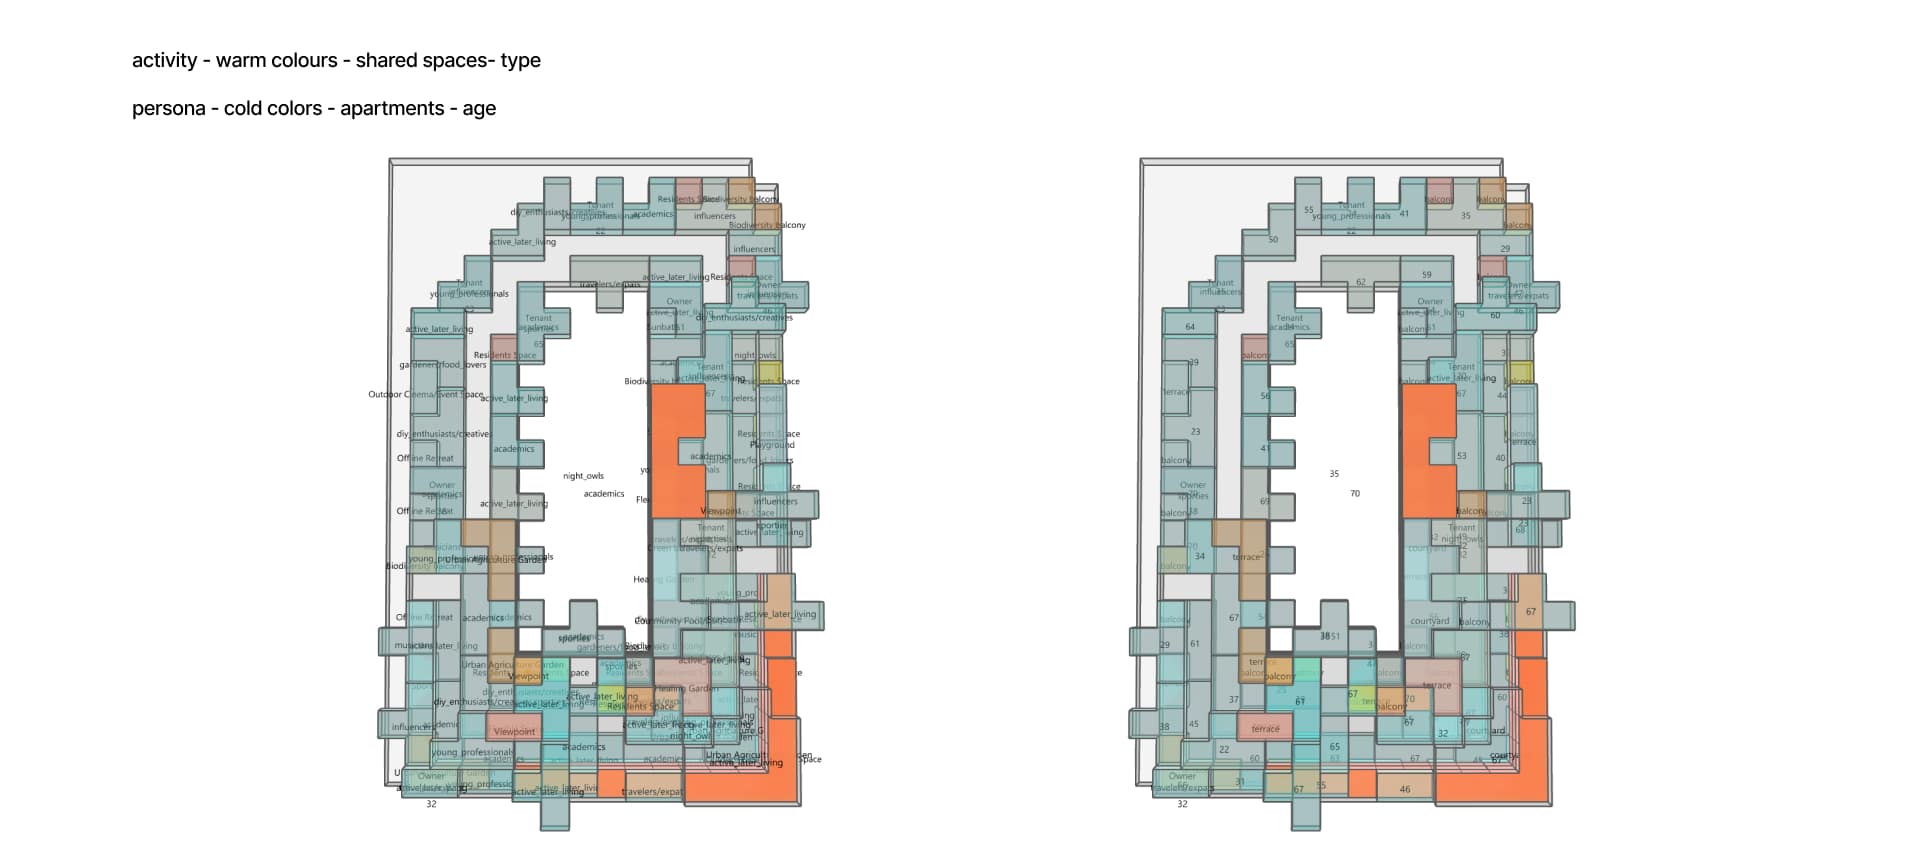
To show directly on graph visualisation, custom properties we are adding to apartments are:
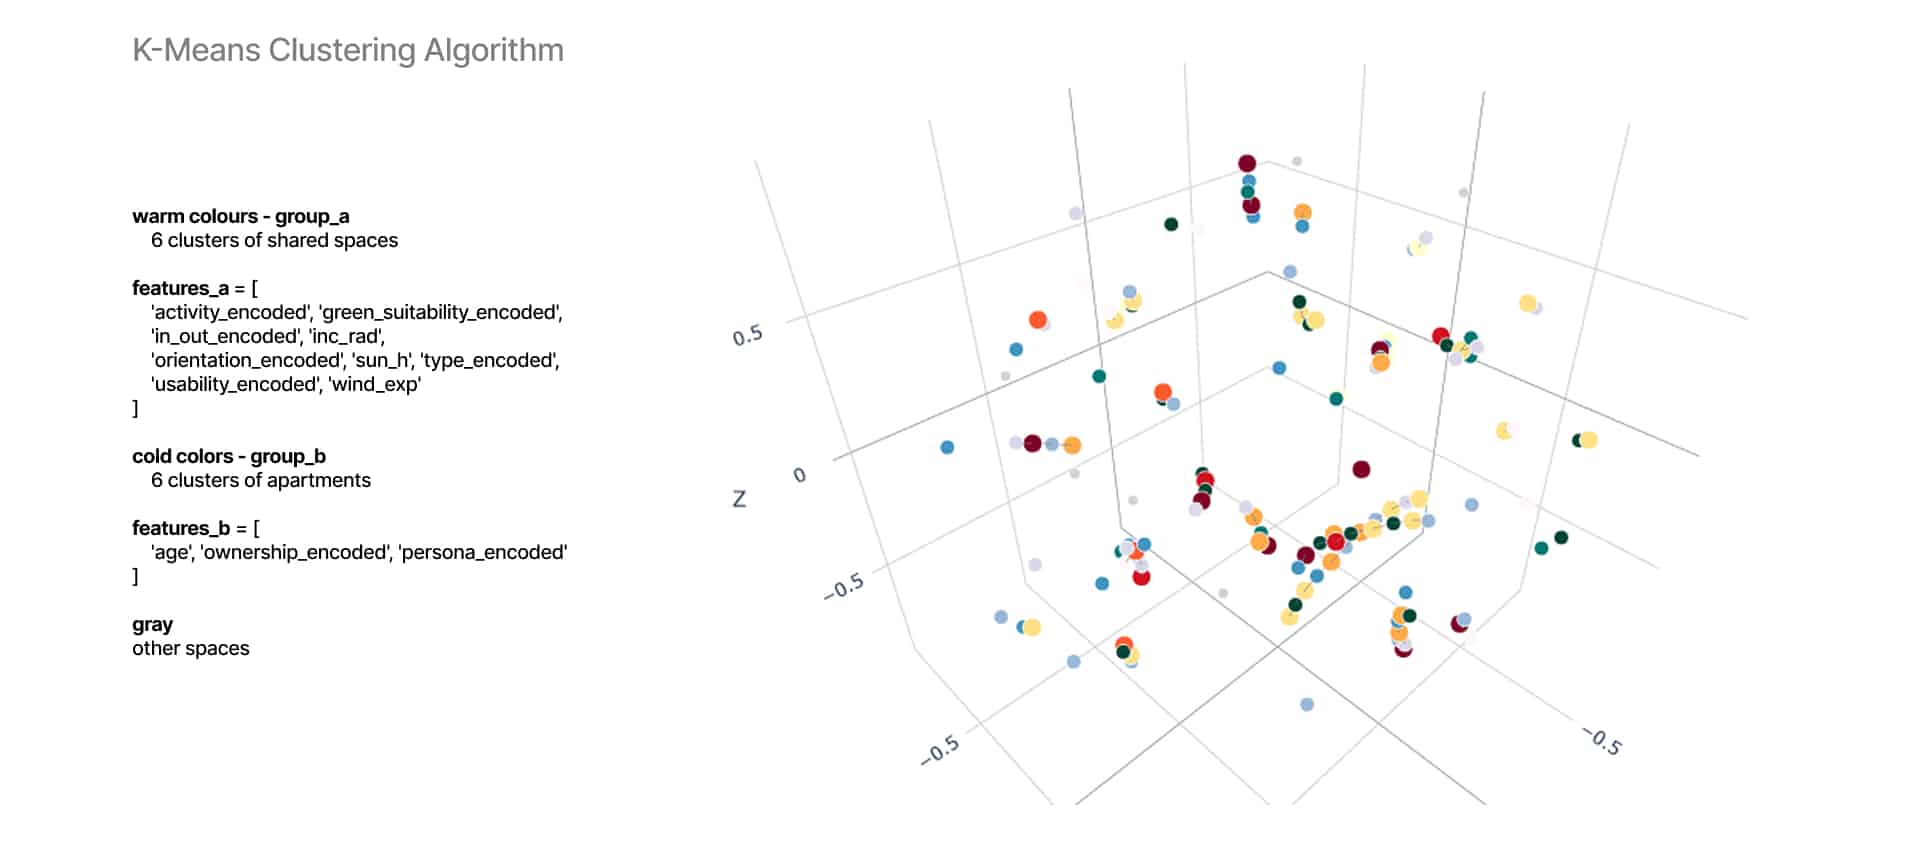
K-Means Clustering
We divided nodes in 2 groups to form 2 types of clusters. K-means is centroid-based clustering (from vector data). Goal of clustering is divide data into K groups such that nodes in the same group are close (in Euclidean distance) to the same centroid. It doesn’t care about the connections (edges) between nodes, but on the features we filter and input. The algorithm always assigns nodes to clusters, but it doesn’t explain what those clusters mean. So we had to inspect which values and how are grouped together. We experimented with different number of clusters and number of features we add to clustering algorithm.
Spaces are connected through windows, edges shown here:
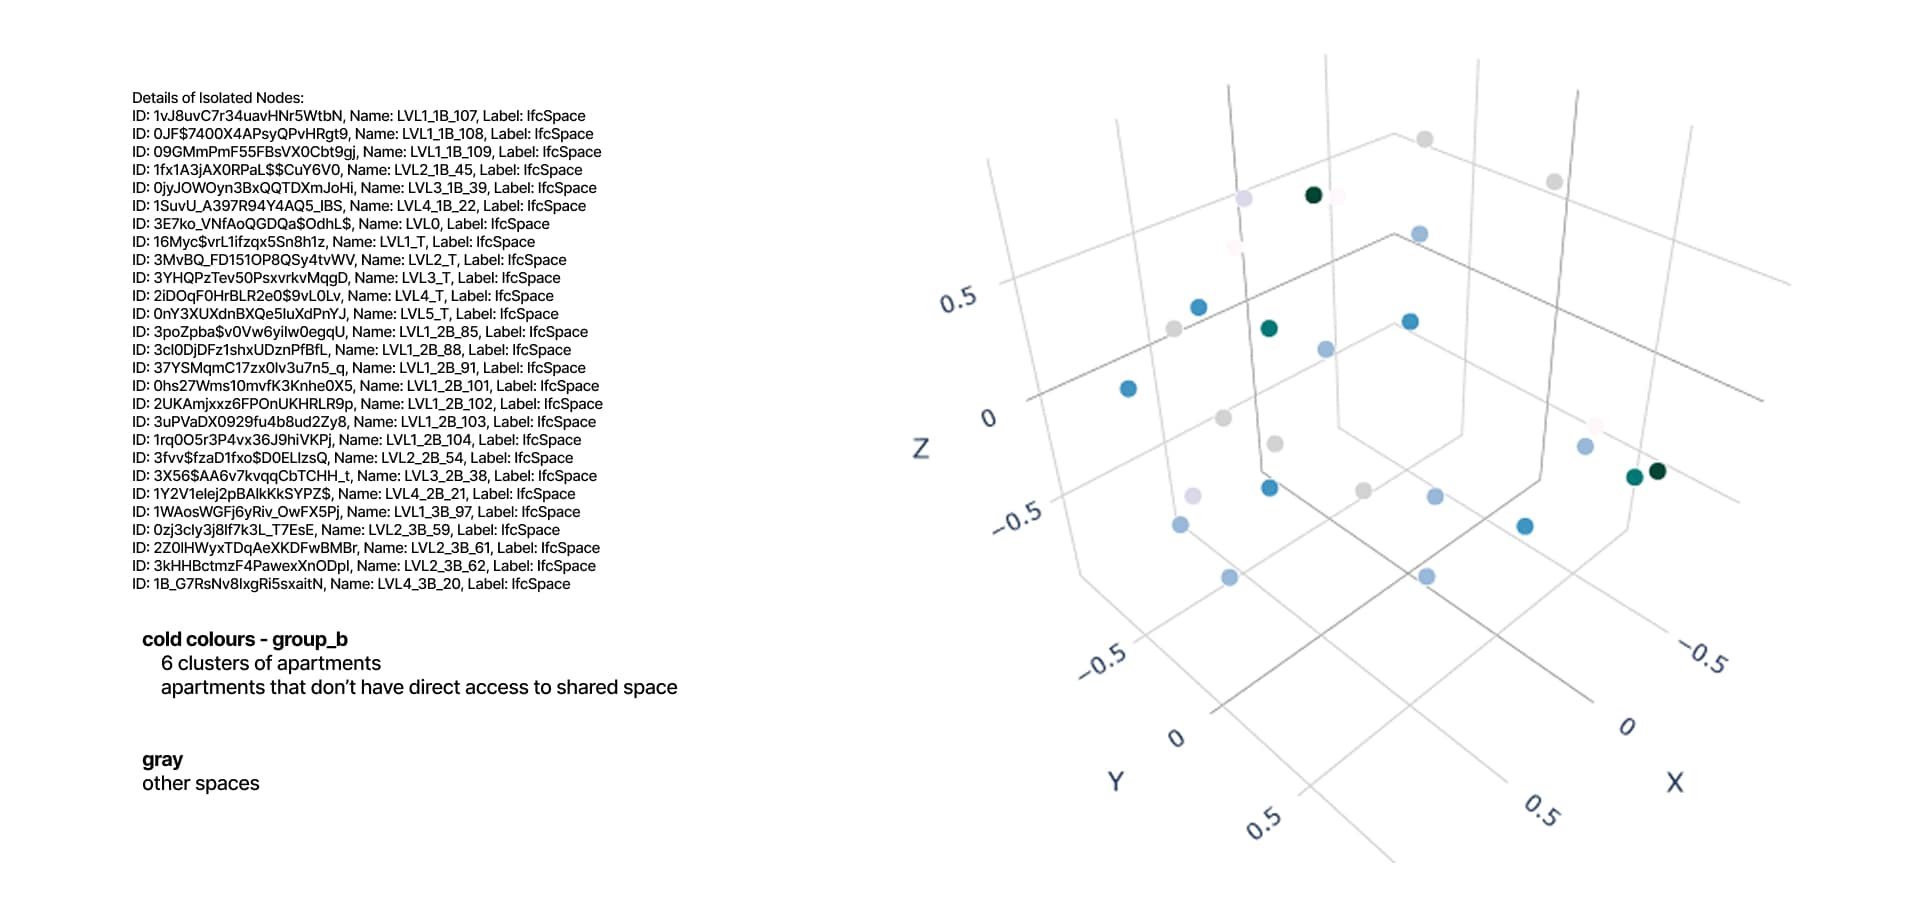
Just as we were making and showing clusters, it is interesting to see apartment spaces without edges from previous slide. So here we can see apartments that don’t have direct access to shared space!
Back to grasshopper, loading json files with clustered spaces, we can show total building and clustered spaces. Building resident can find cluster of people with similar specifications, or cluster of similar shared spaces.
Gif shows dynamic change and quick inspection of data, coloured clusters with assigned properties. Properties can be added or reduced, depending what do we need to visualize. While examining properties, we saw that for example, lot of shared spaces were clustered based on sun_h and inc_rad.
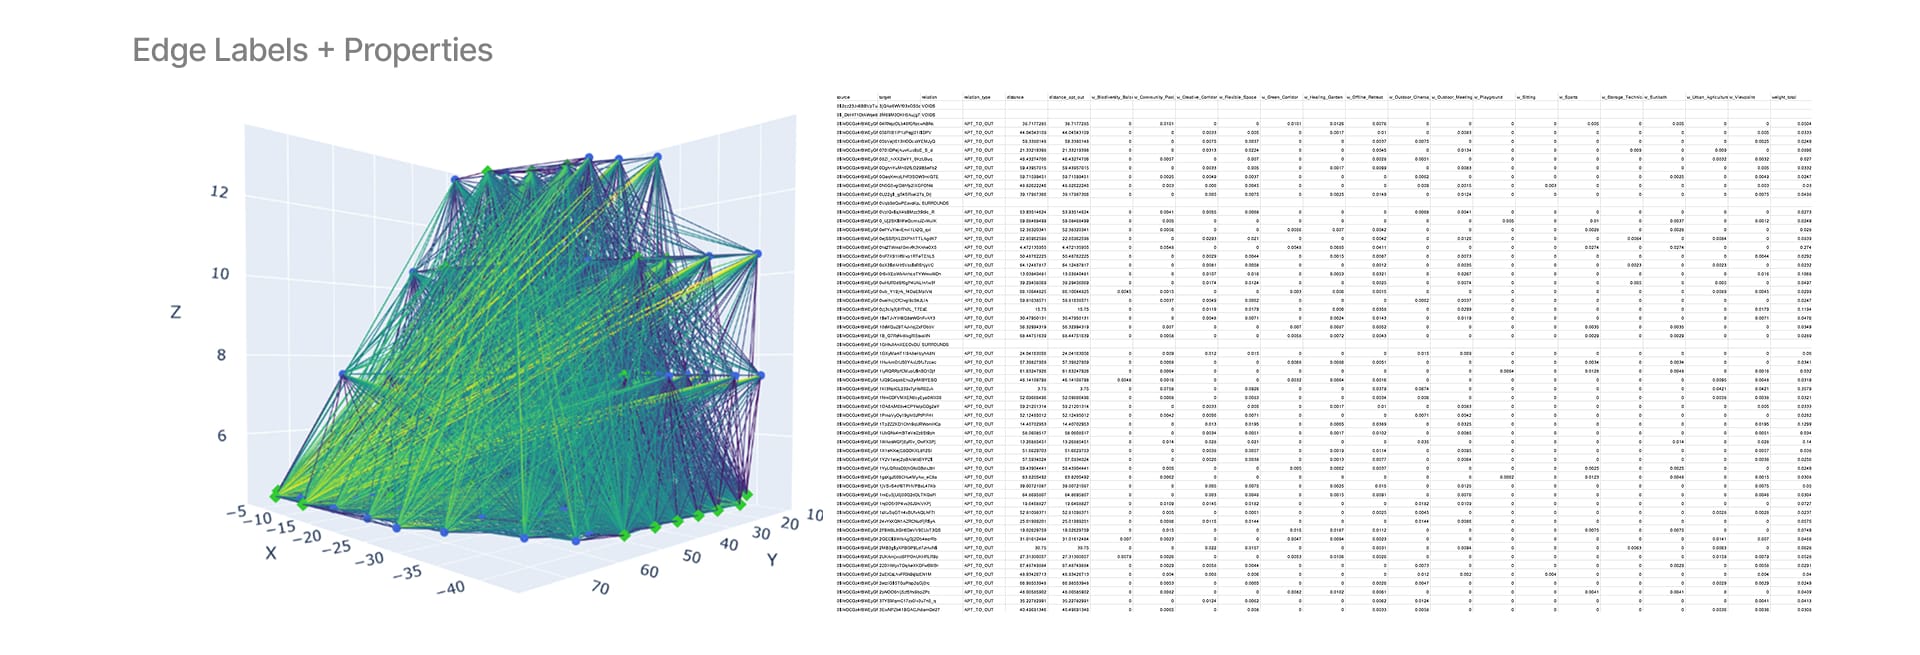
Edge Labels + Properties
This graph shows edges, coloured by distances between apartments and shared spaces. Those properties, as the voting weights are saved to csv file.
We processed IFC data to generate a graph where apartments and outdoor spaces are linked with APT_TO_OUT edges. Each edge is enriched with:
- Distance-based proximity (3D Euclidean)
- User preference weights, based on personas and activity compatibility
These are aggregated into aweight_totaland normalized intoweight_norm, which is exported for Louvain clustering in Neo4j’s GDS. This will give each apartment not just a spatial logic—but a behavioral one.
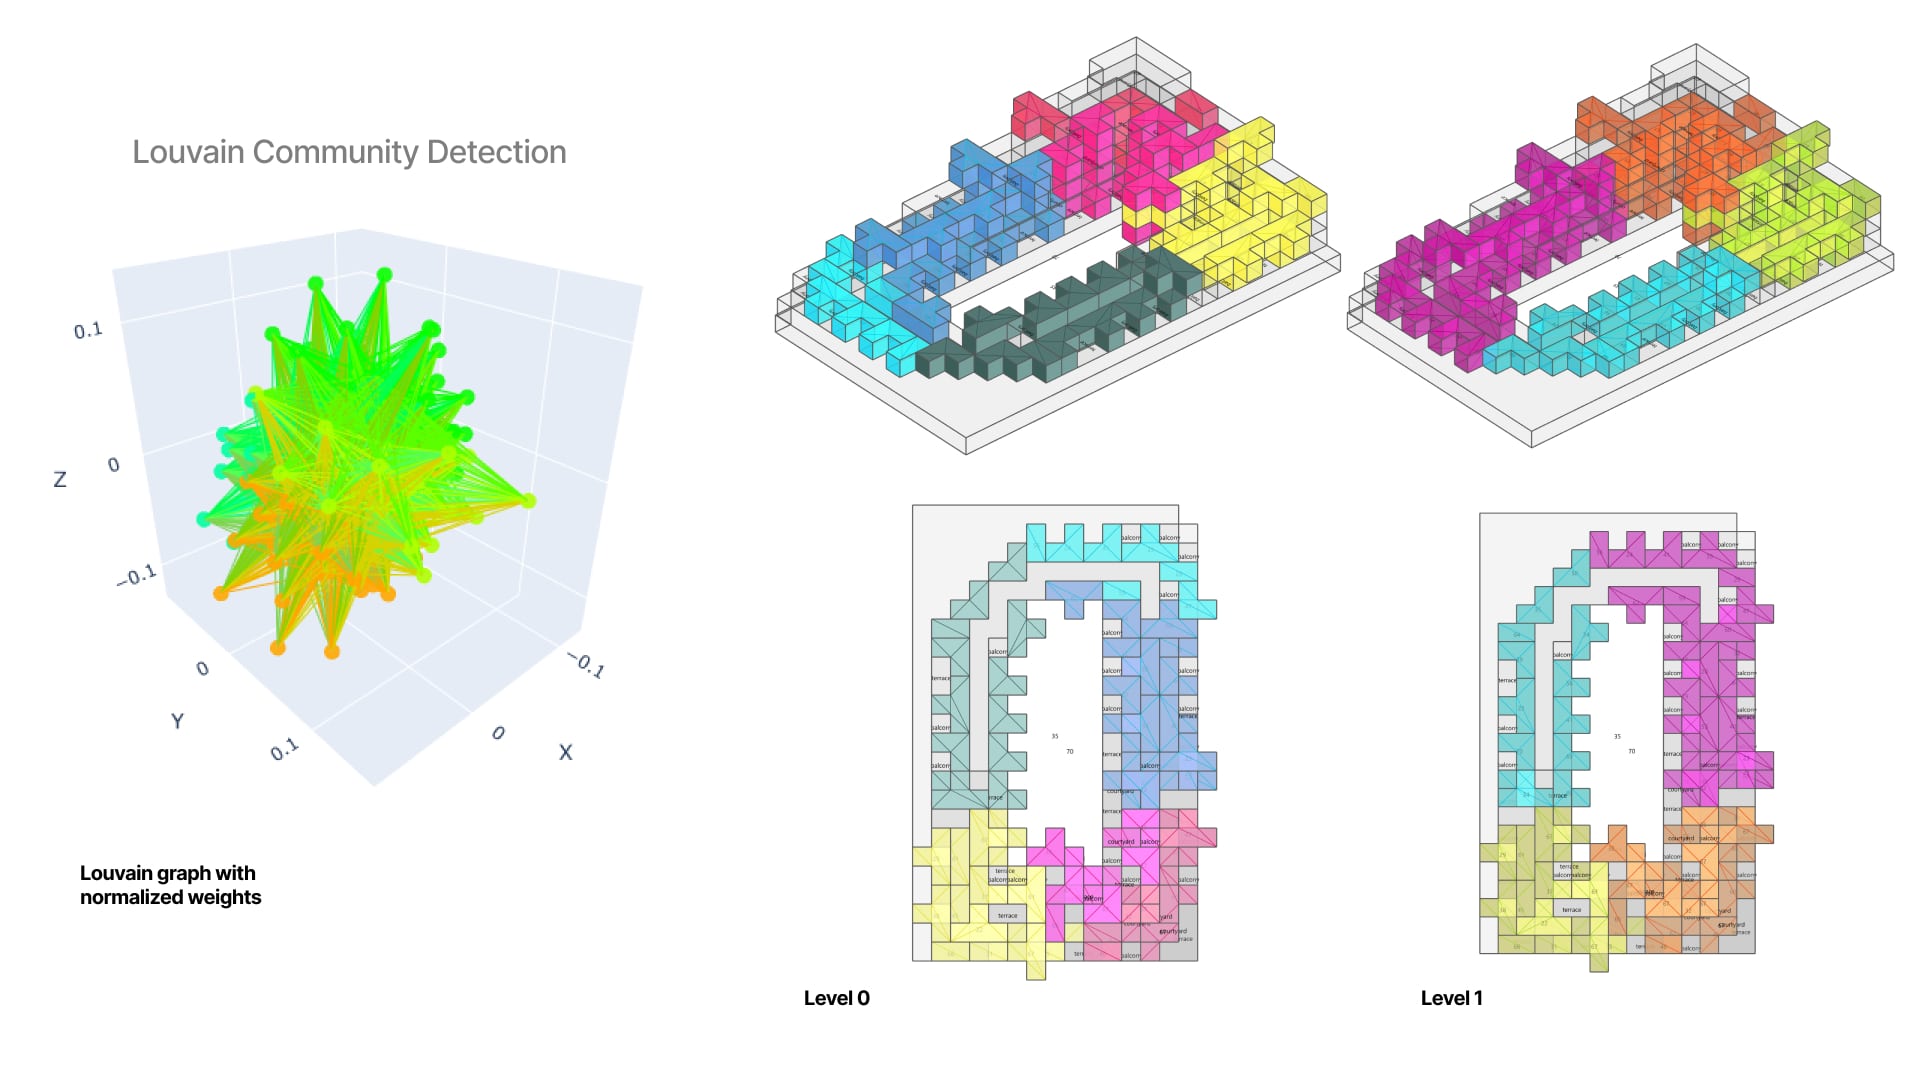
Louvain Community Detection
Each node in the graph represents a space – apartment or outdoor and edges reflect real spatial connections. Louvain clustering groups these nodes based on interaction strength, revealing emergent communities. With intermediate levels, we uncover community structure at multiple resolutions: level 1 shows broad divisions (e.g., clusters of buildings), while lower levels expose finer social-spatial dynamics (like shared courtyards or neighbour clusters). This layered understanding enables adaptive design, from block-level to household interactions.
Next Steps
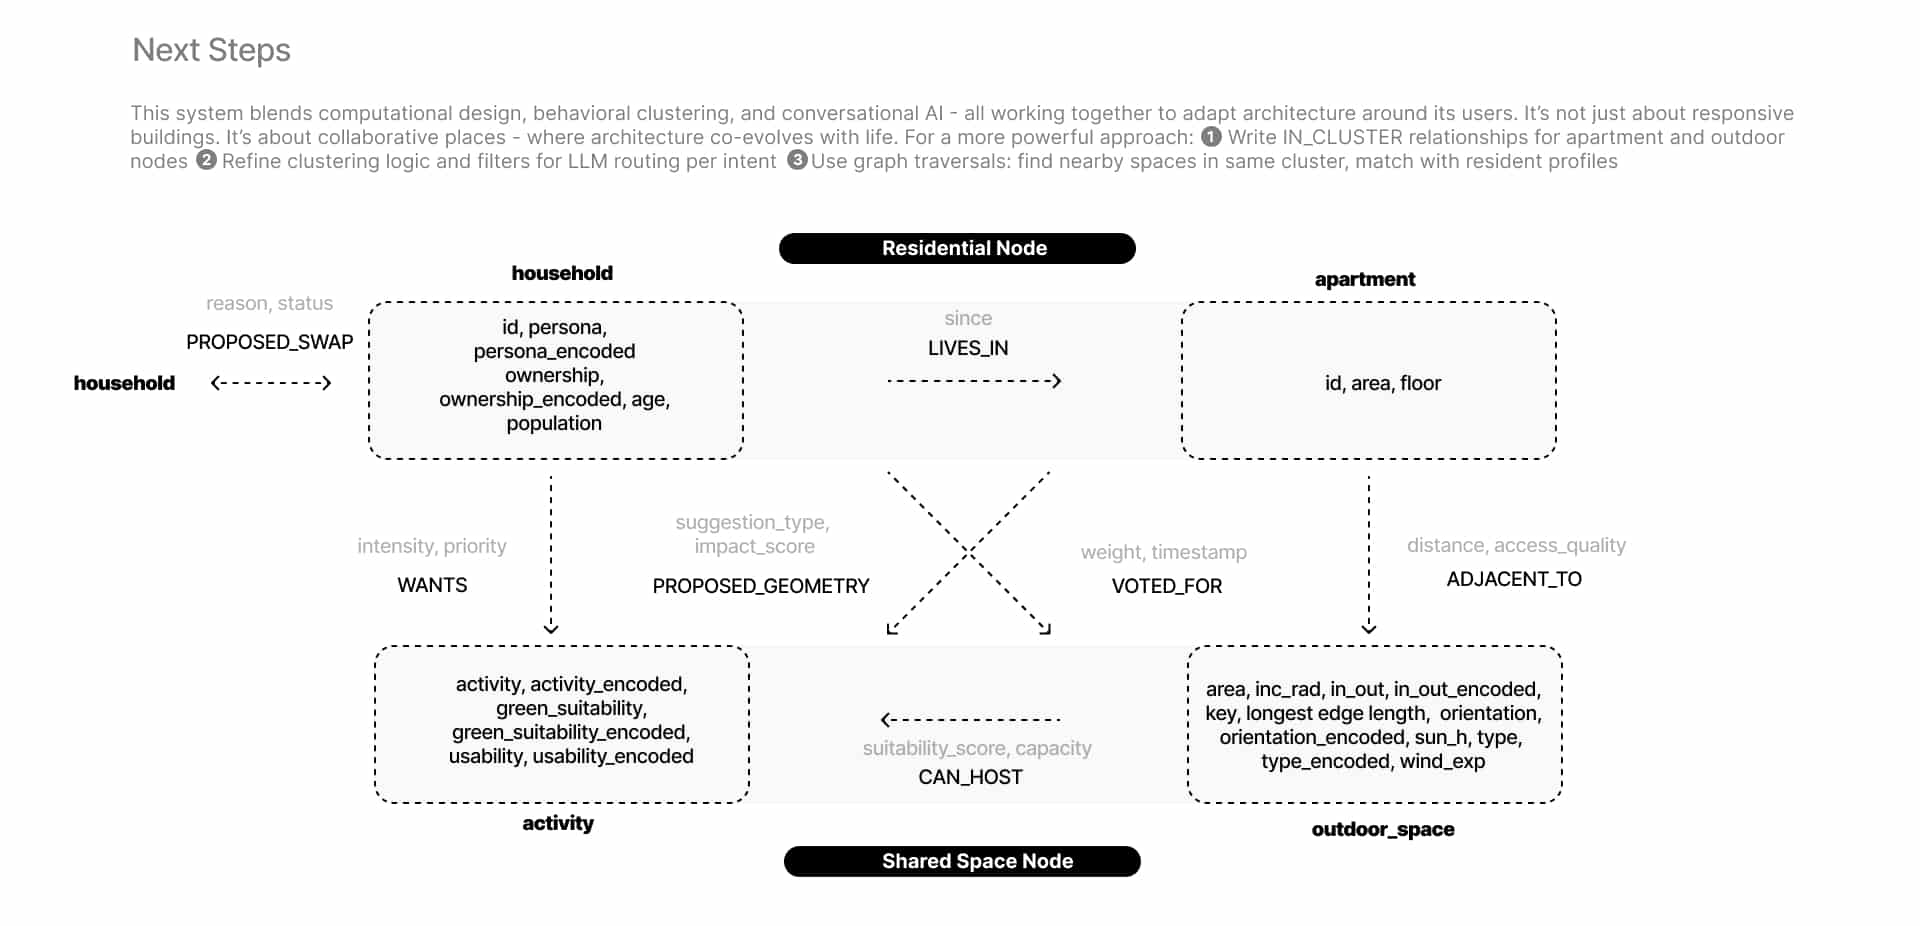
This system blends computational design, behavioural clustering, and conversational AI – all working together to adapt architecture around its users. It’s not just about responsive buildings. It’s about collaborative places – where architecture co-evolves with life. For a more powerful approach: Write IN_CLUSTER relationships for apartment and outdoor nodes Refine clustering logic and filters for LLM routing per intent Use graph traversals: find nearby spaces in same cluster, match with resident profiles.
We’re not just building smarter buildings – we’re creating living systems that understand, adapt, and grow with their communities…
