
This project introduces a graph-based machine learning system designed to automate furniture placement in apartment layouts. The workflow was developed as part of an architectural design studio and played a key role in generating comfort-driven interior configurations.
At its core, the system encodes spatial and functional rules such as placing a sofa near a window or in proximity to a coffee table into a graph structure. Thermal comfort heatmaps and scoring grids are then used to evaluate and guide placement decisions for optimal layout performance.
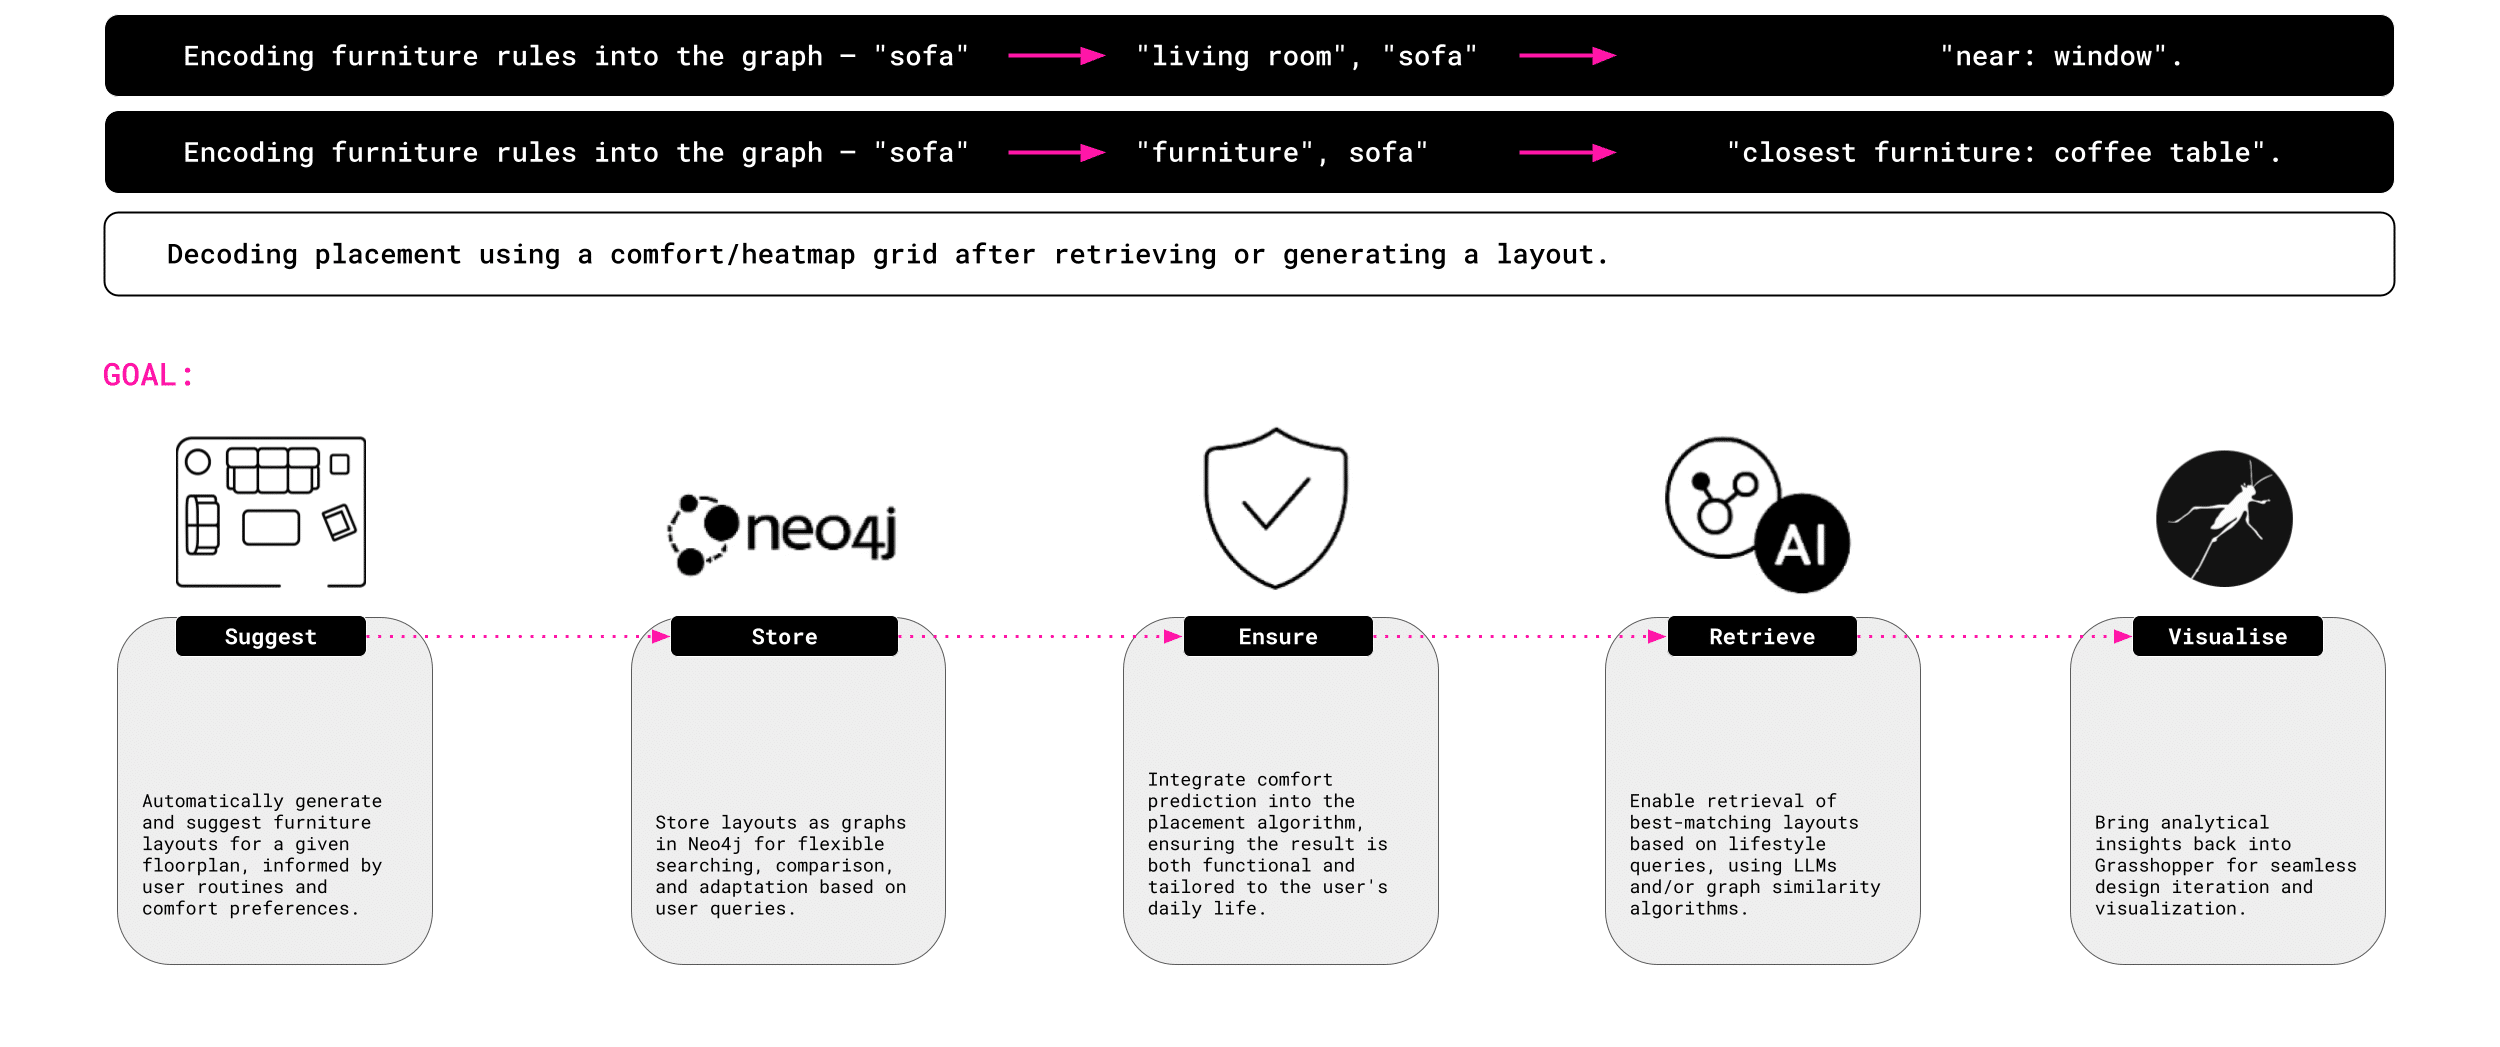
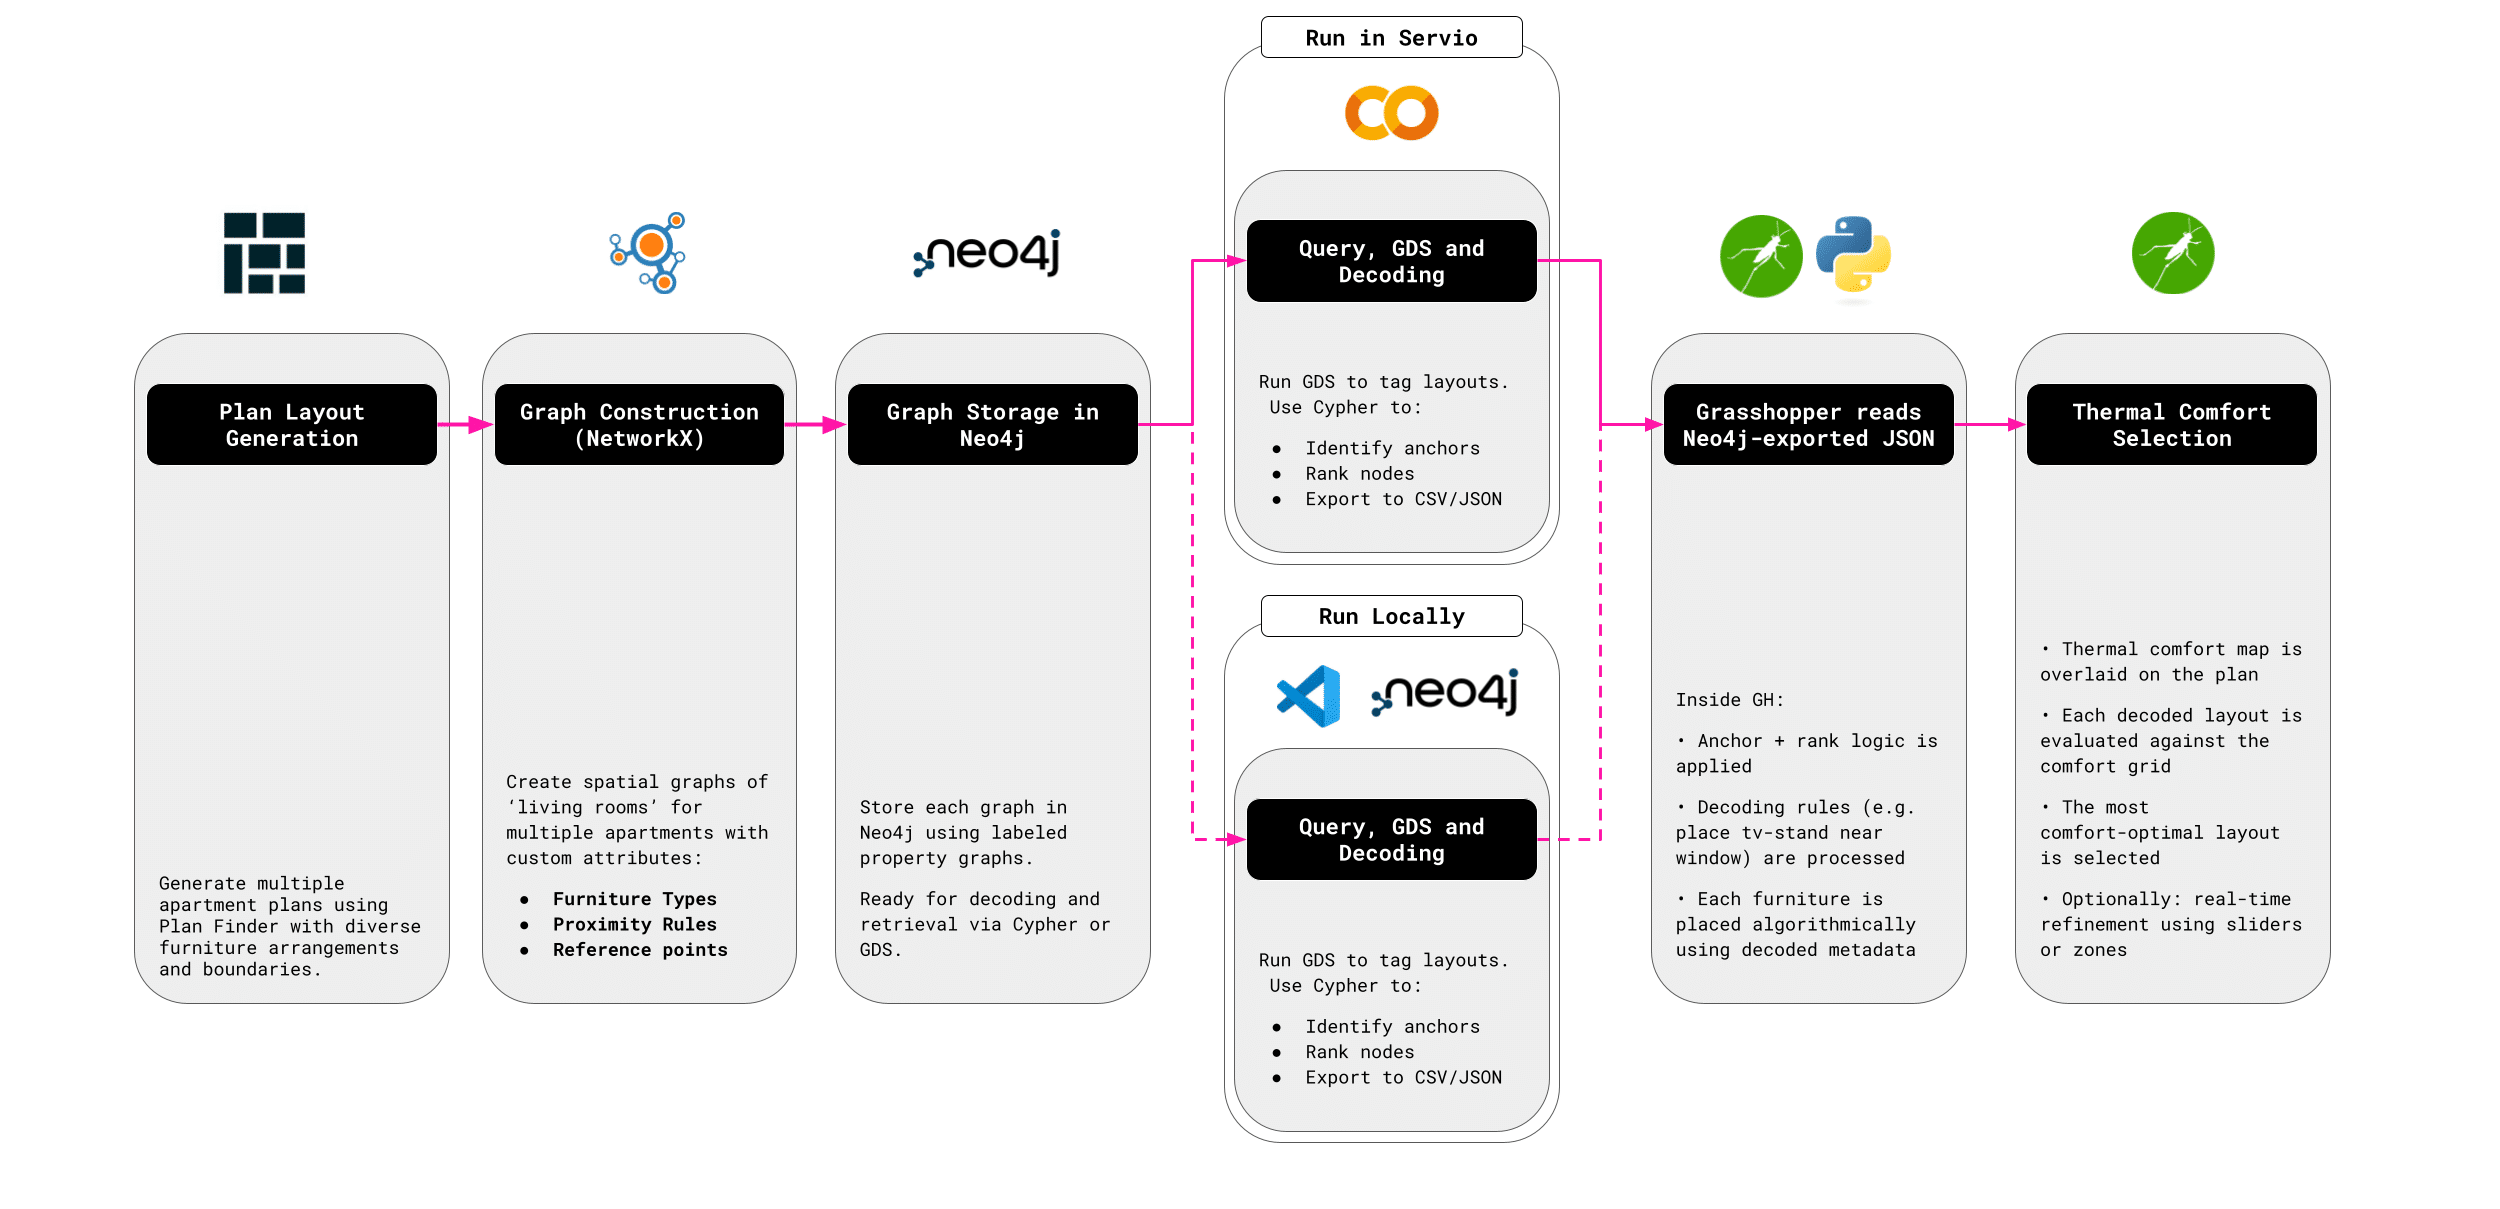
Workflow Overview
The process begins with layout generation using Plan Finder. Each layout is then converted into a spatial graph using NetworkX, with furniture and reference elements represented as nodes. These graphs are imported into Neo4j, where Cypher and the Graph Data Science (GDS) library are used to decode optimal furniture placement sequences. The results are exported as JSON files and visualized in Grasshopper, where algorithmic placement is refined using thermal comfort maps.
From Plan Finder to Classified Furniture
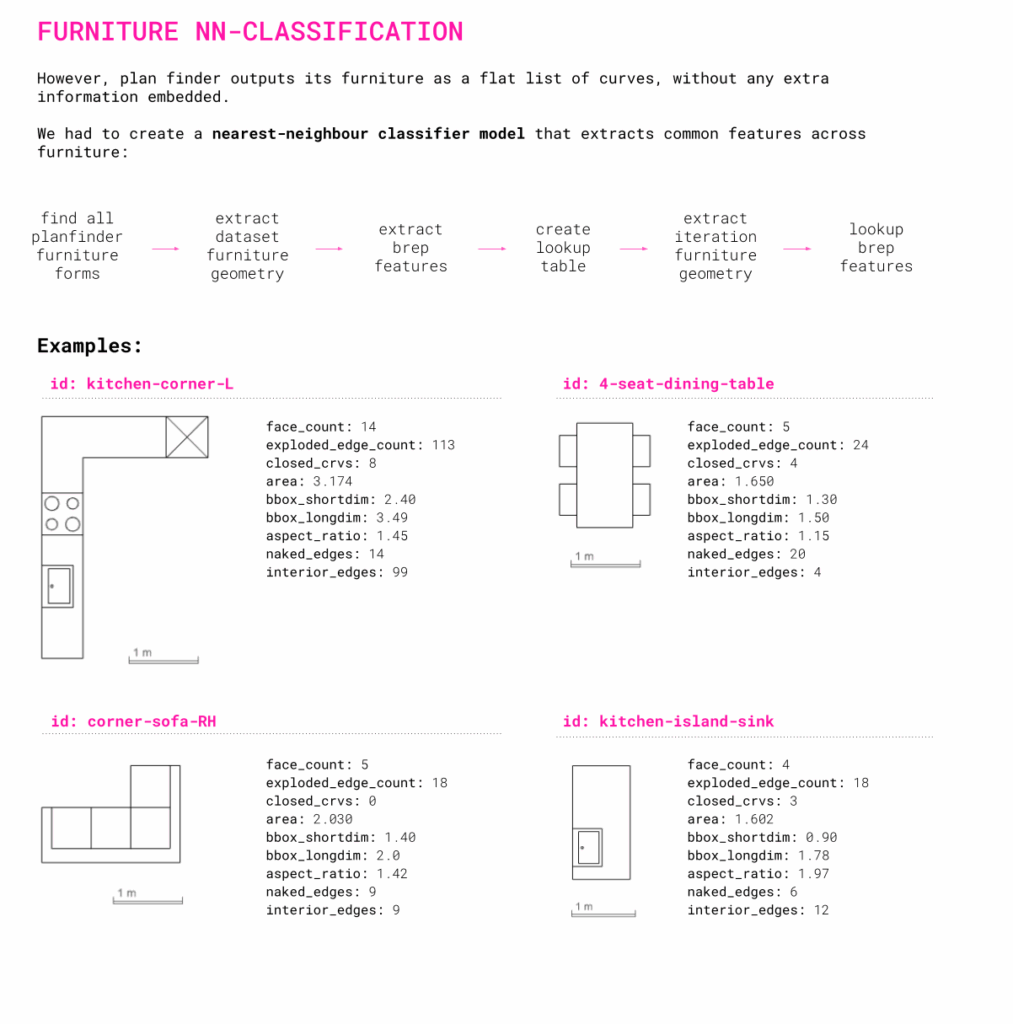
Plan Finder was used to generate a range of apartment layouts, each containing various furniture configurations. Since Plan Finder outputs furniture as flat, metadata-free curves, a nearest-neighbor classifier was developed to identify furniture types. This classifier uses geometry-based features—such as face count, bounding box dimensions, and aspect ratios—to distinguish items like sofas, tables, and chairs.
NetworkX vs. ggIFC
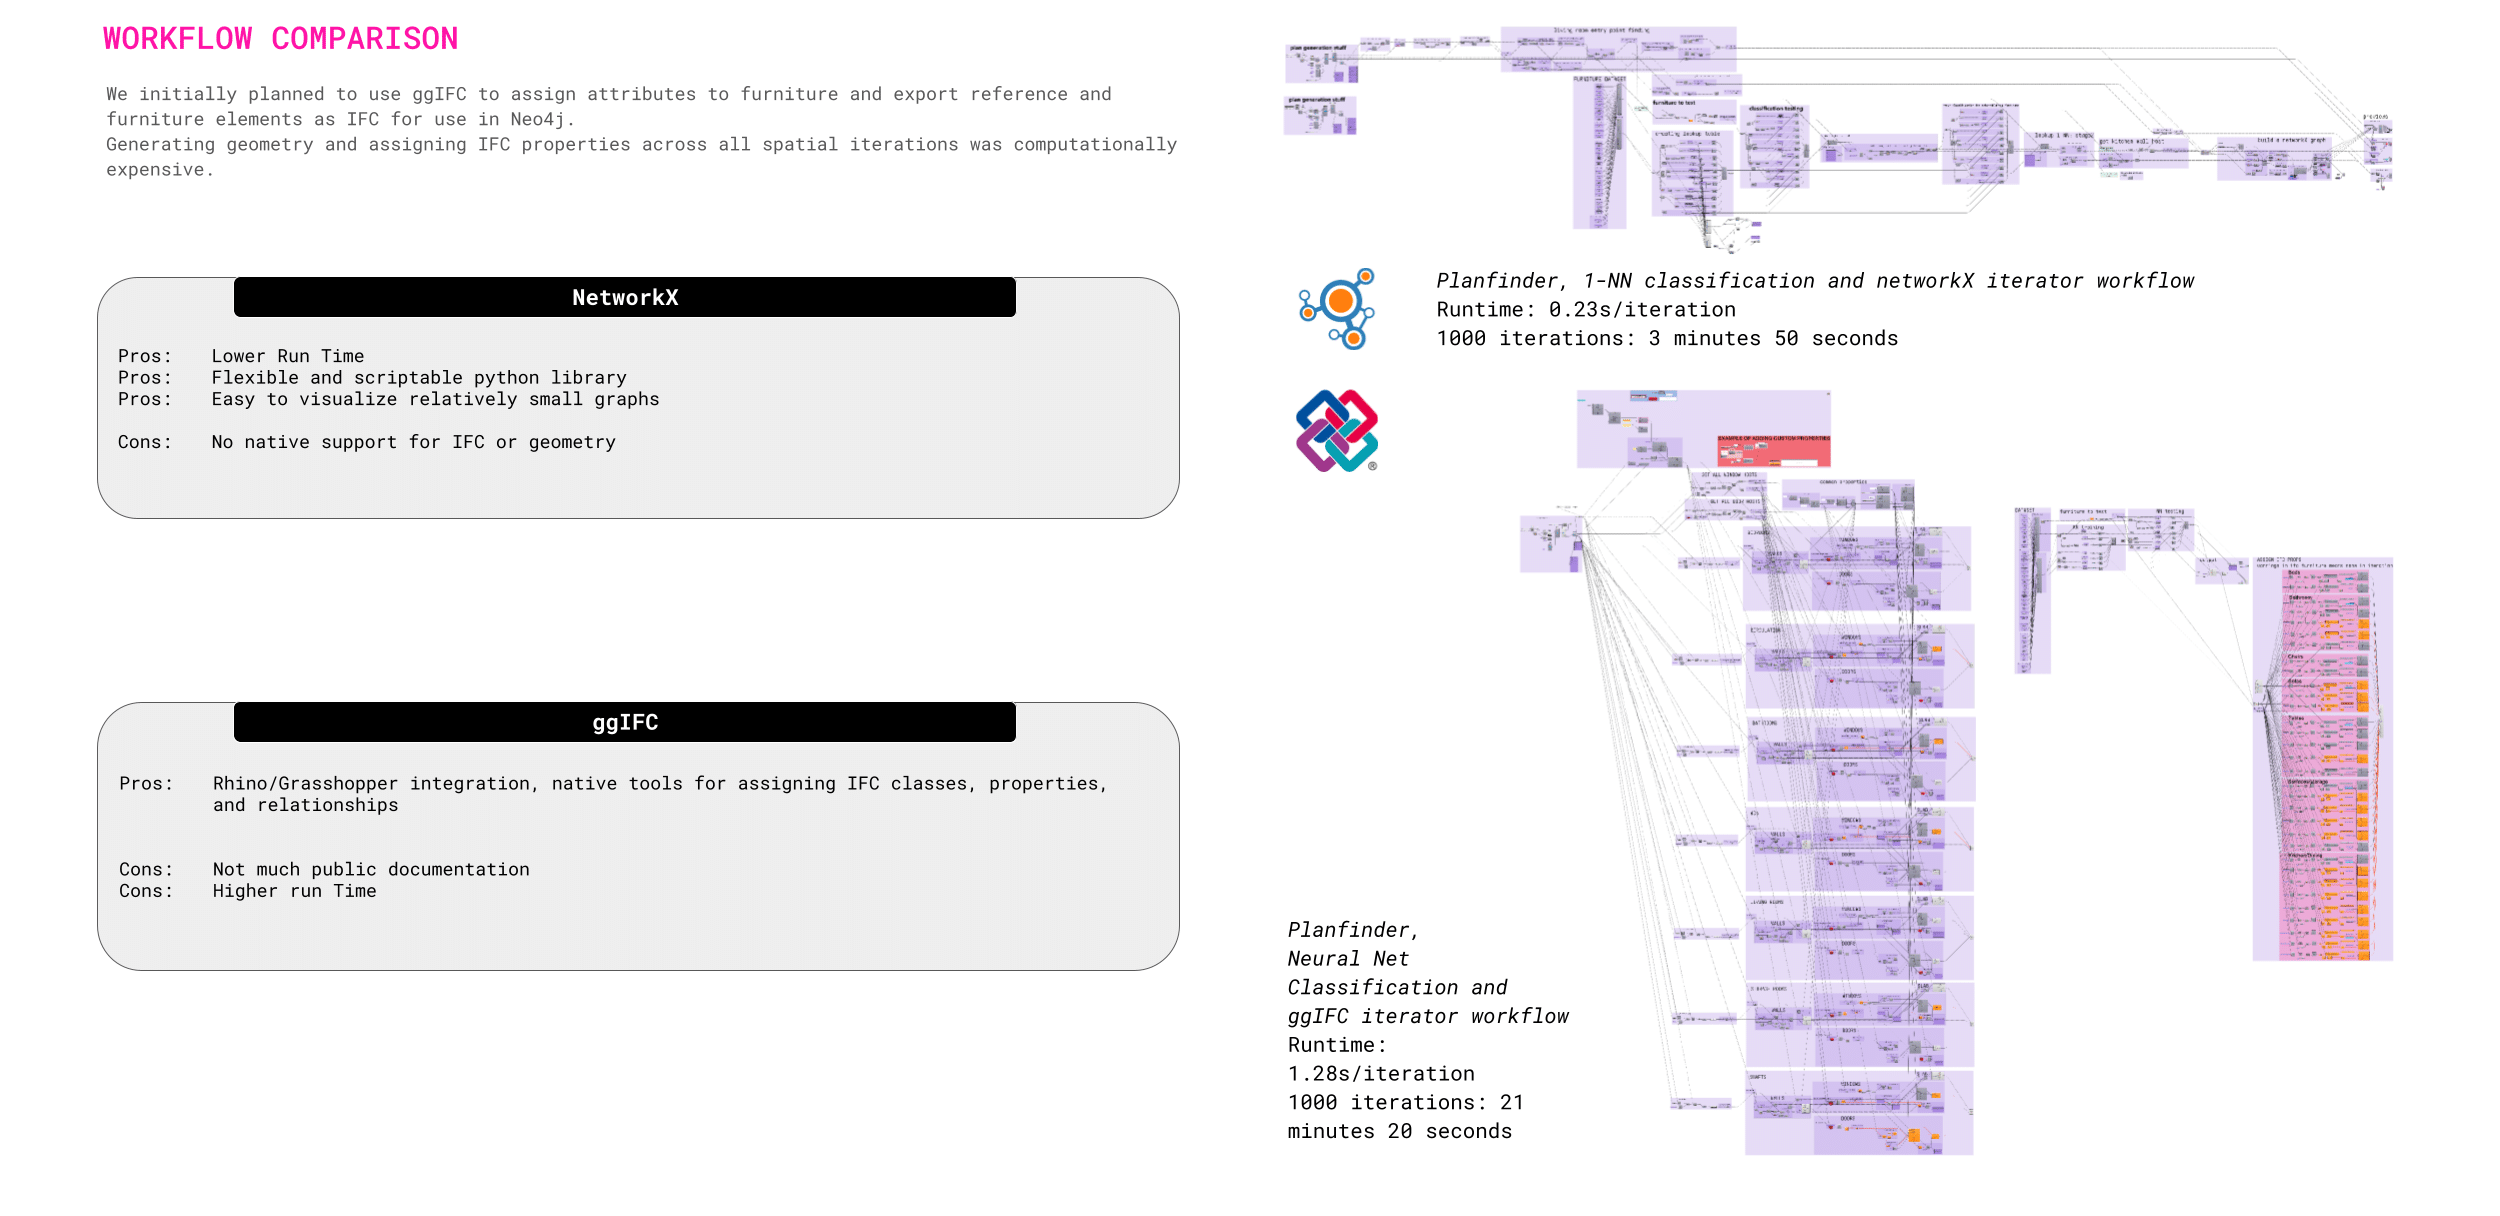
Two graph construction methods were evaluated: NetworkX and ggIFC. NetworkX was selected for its faster processing time and scripting flexibility. While ggIFC integrates natively with Grasshopper and supports IFC properties, it proved significantly slower and less suited for large-scale iterations. For instance, 1,000 layout iterations were processed in under 4 minutes with NetworkX, compared to over 21 minutes using ggIFC.
Graph Encoding and Neo4j Integration
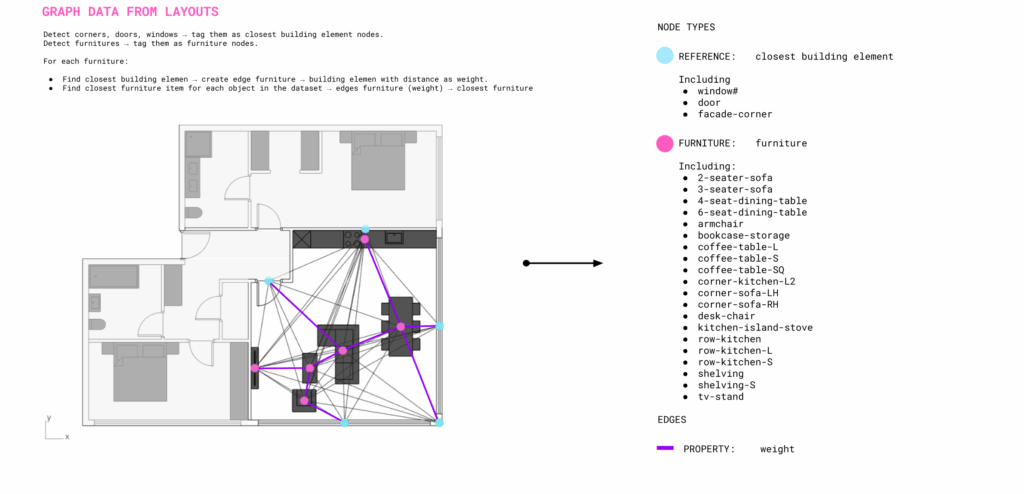
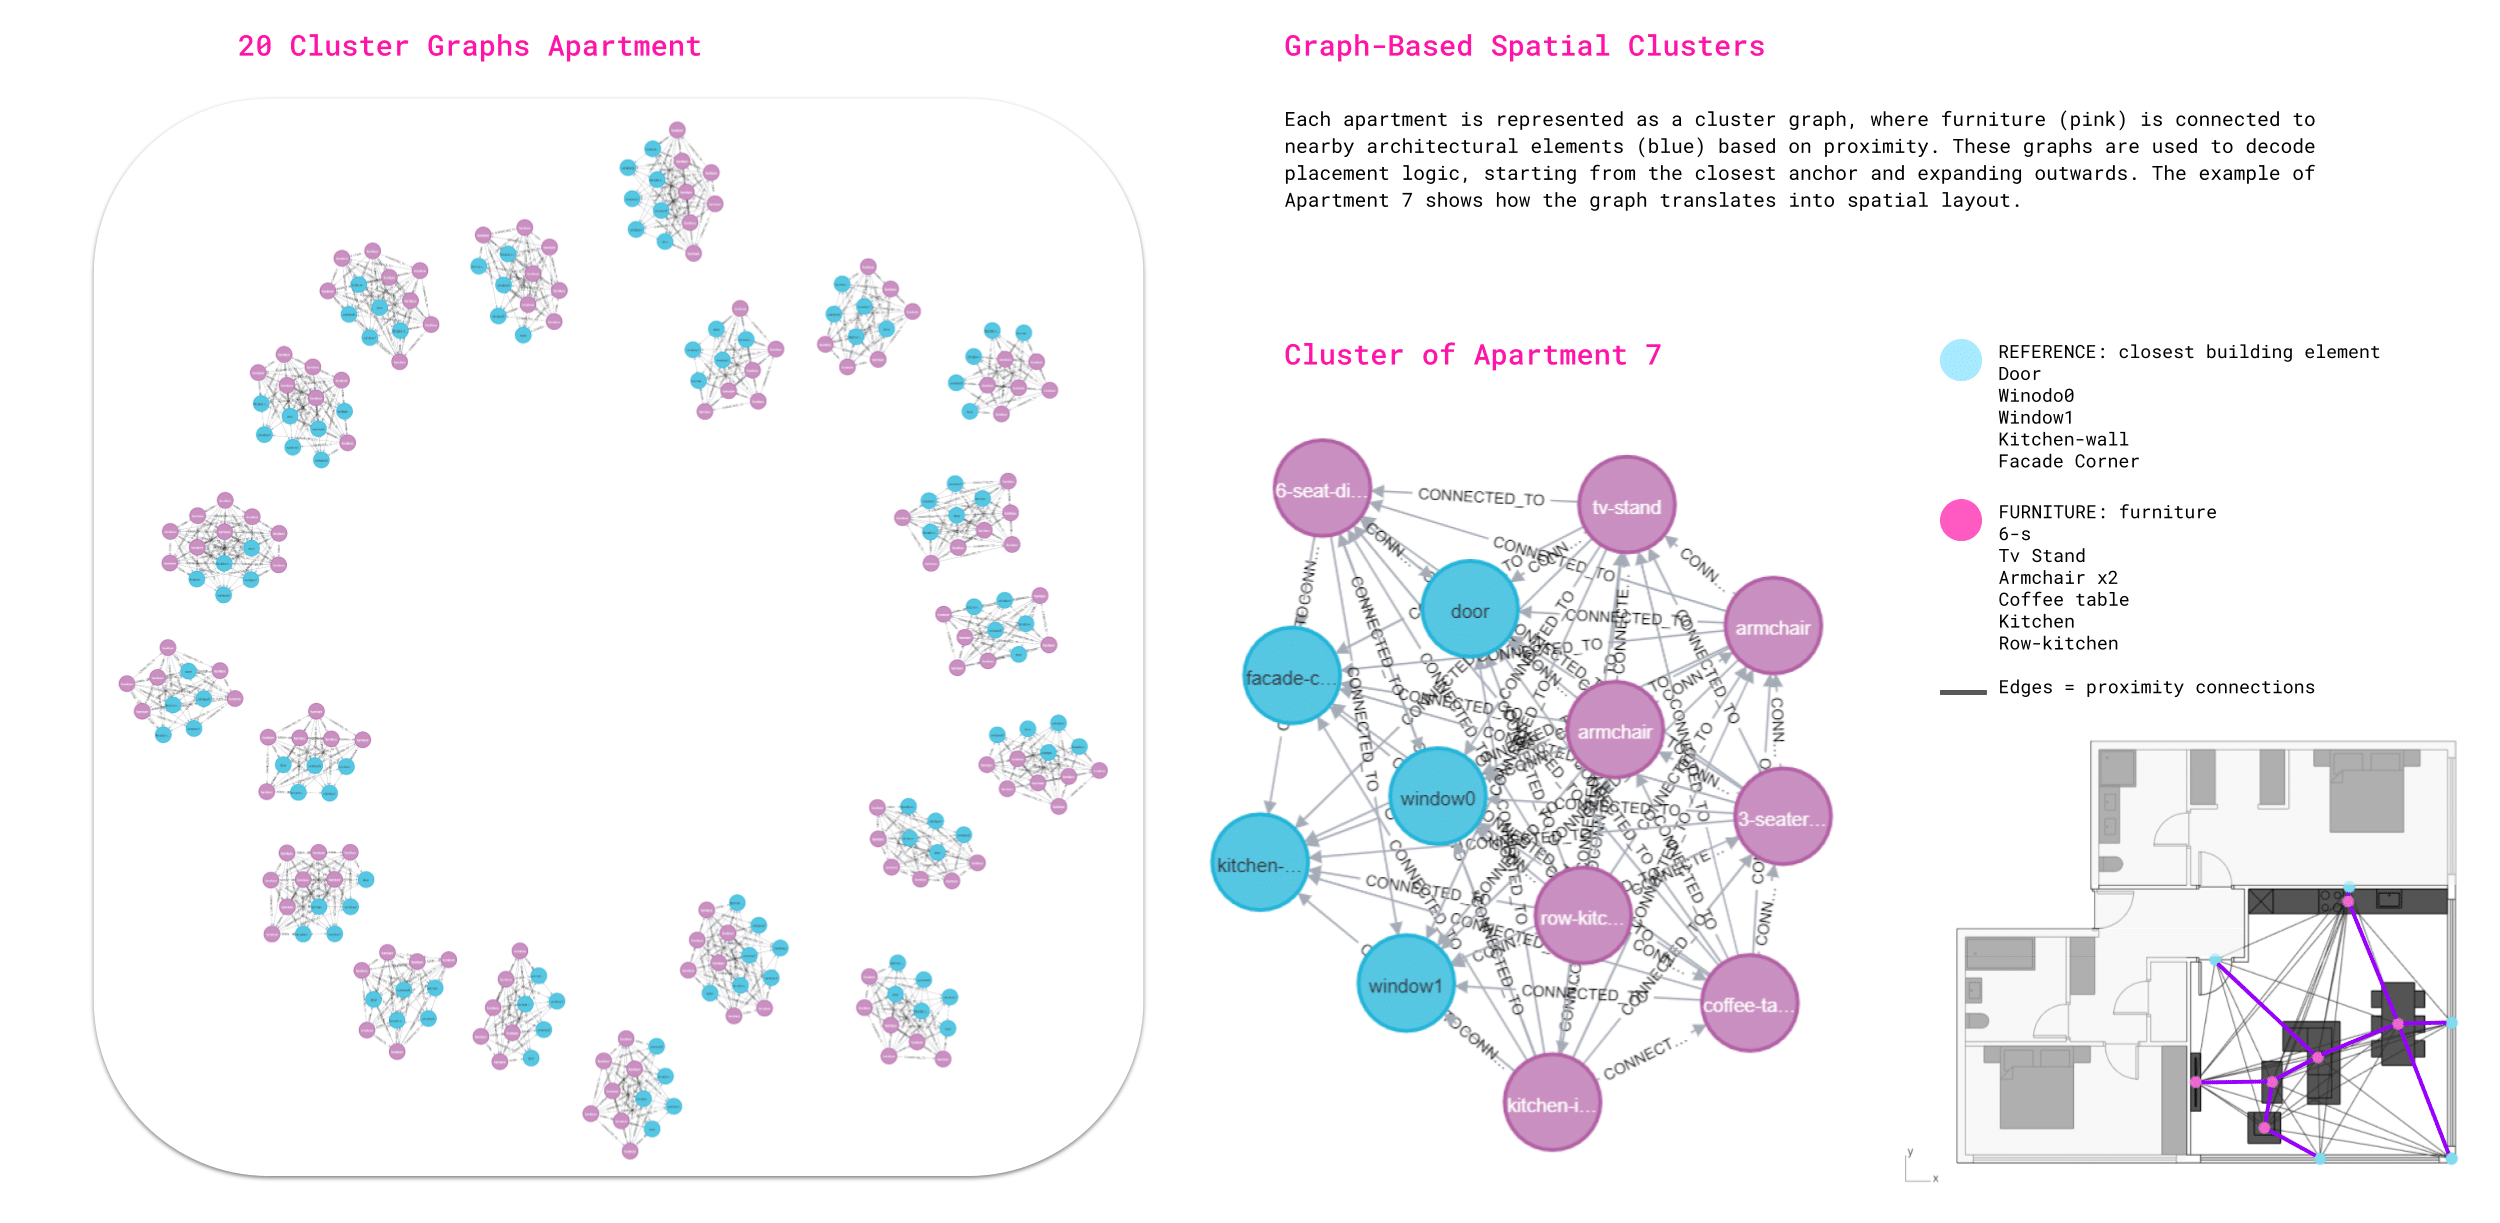
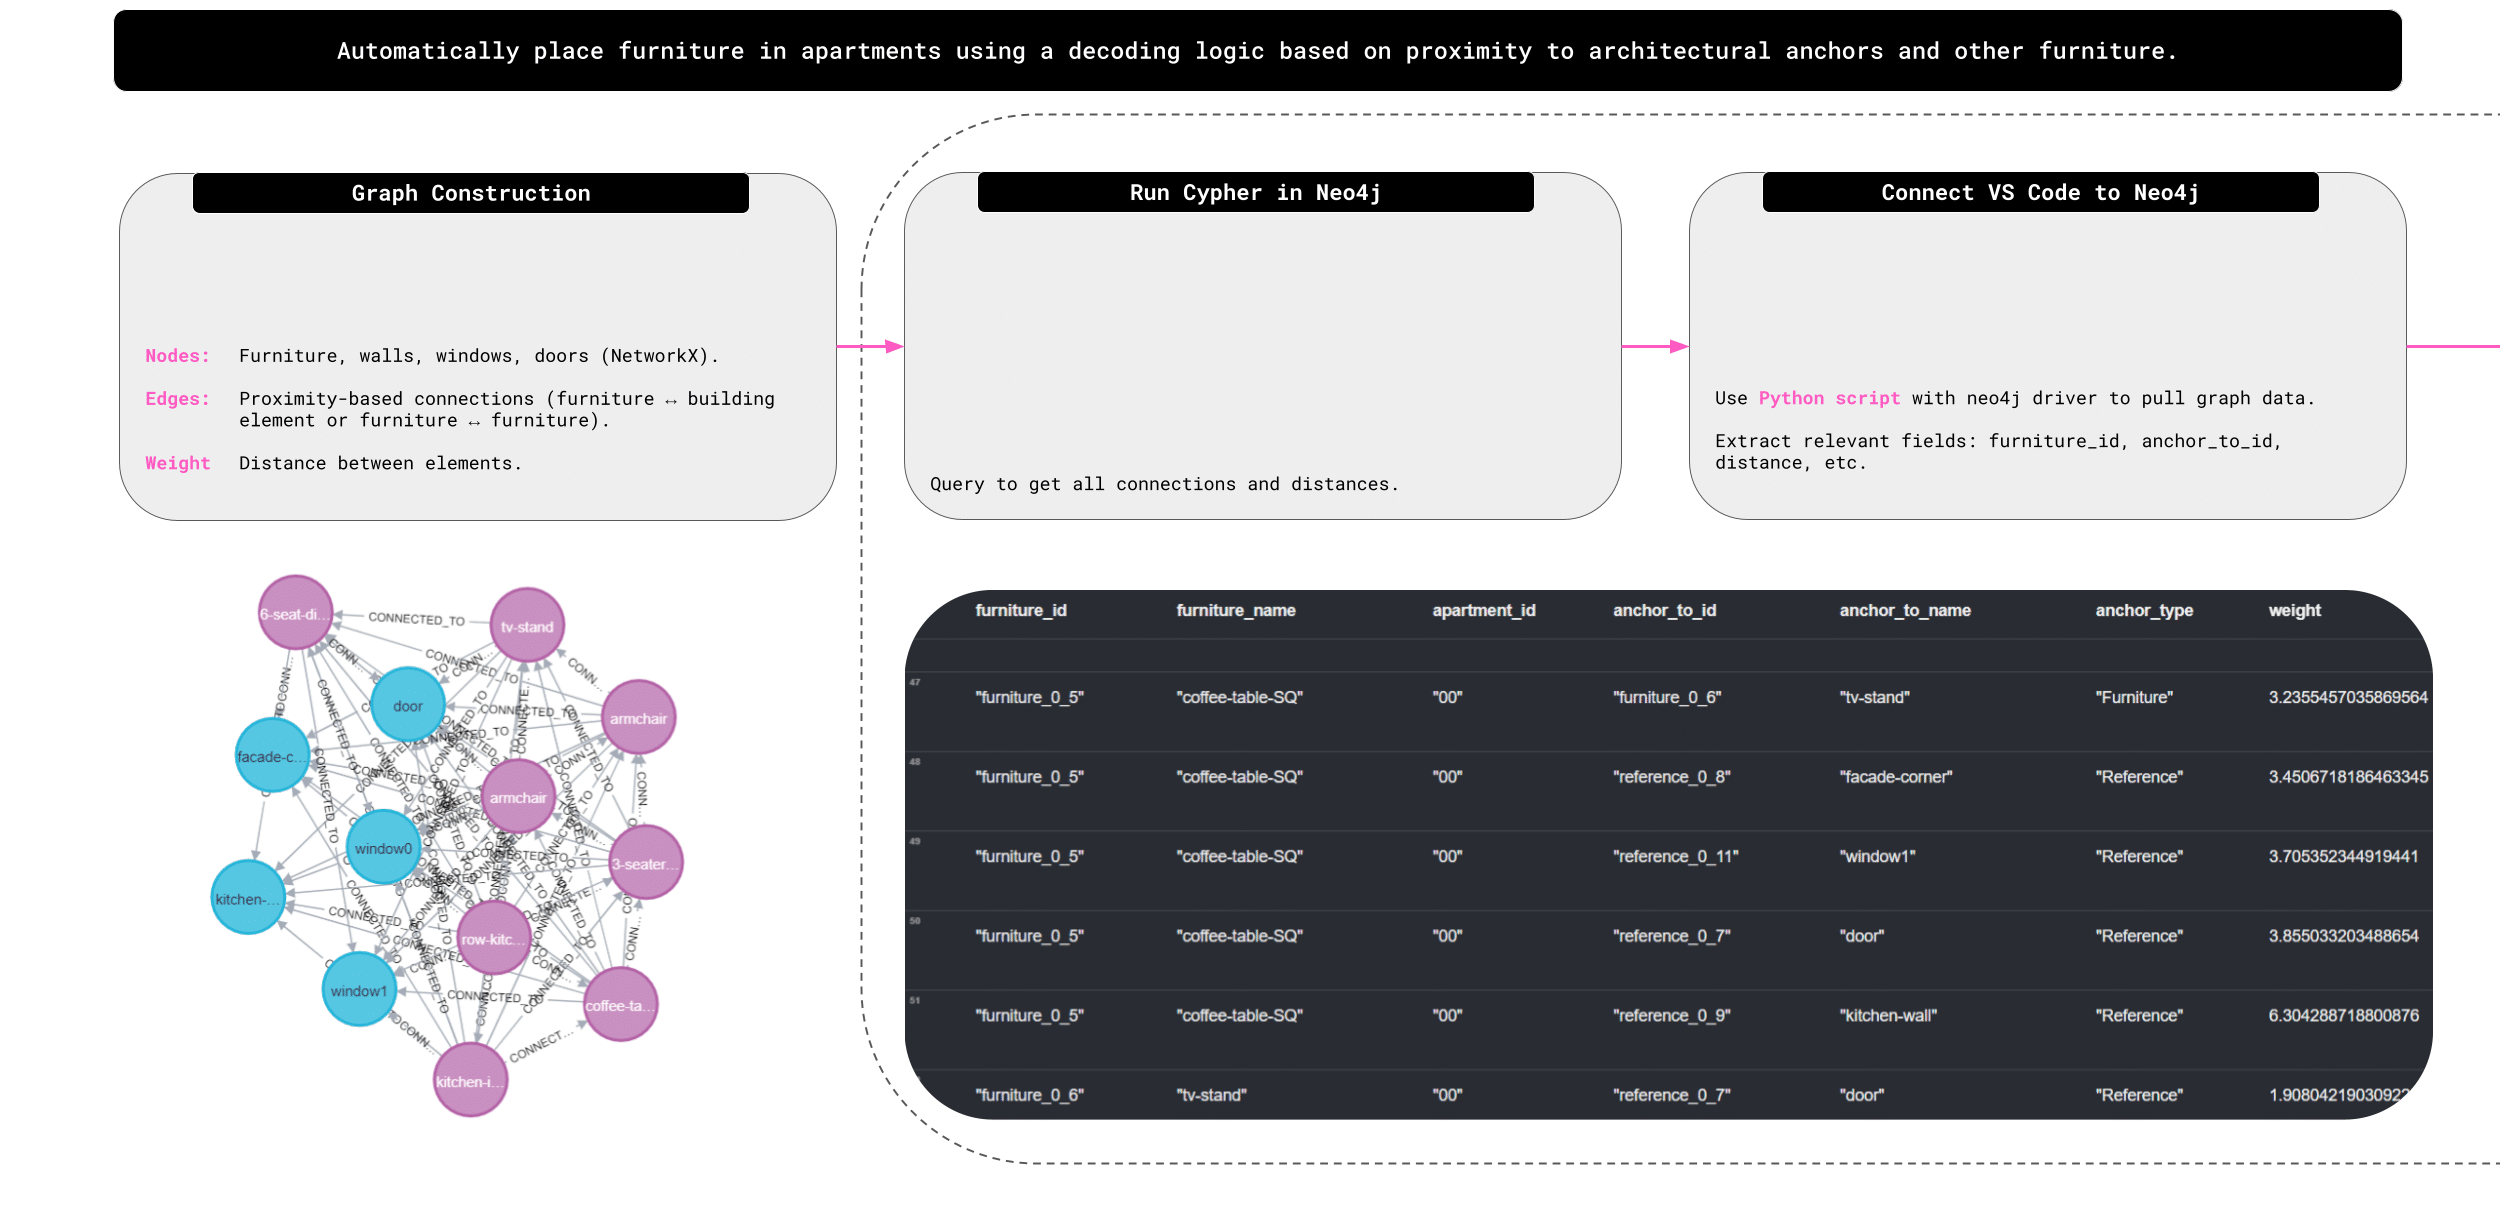
Once classified, furniture and reference elements (e.g., windows, doors, and walls) were encoded into NetworkX graphs. Weighted edges were created based on spatial proximity. These graphs were then imported into Neo4j, where each apartment layout became a cluster of connected nodes—pink for furniture, blue for geometric references. Anchors were identified as the closest reference or furniture item, forming the starting point for decoding placement sequences.
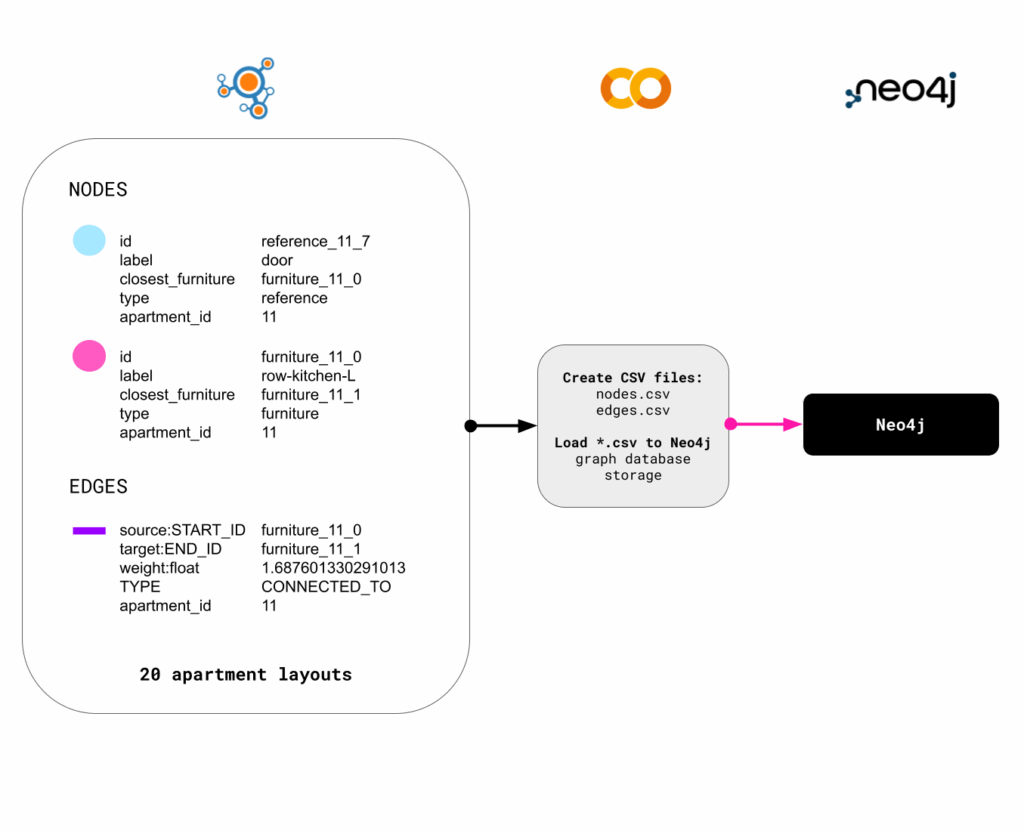
Decoding Logic and Placement Rules
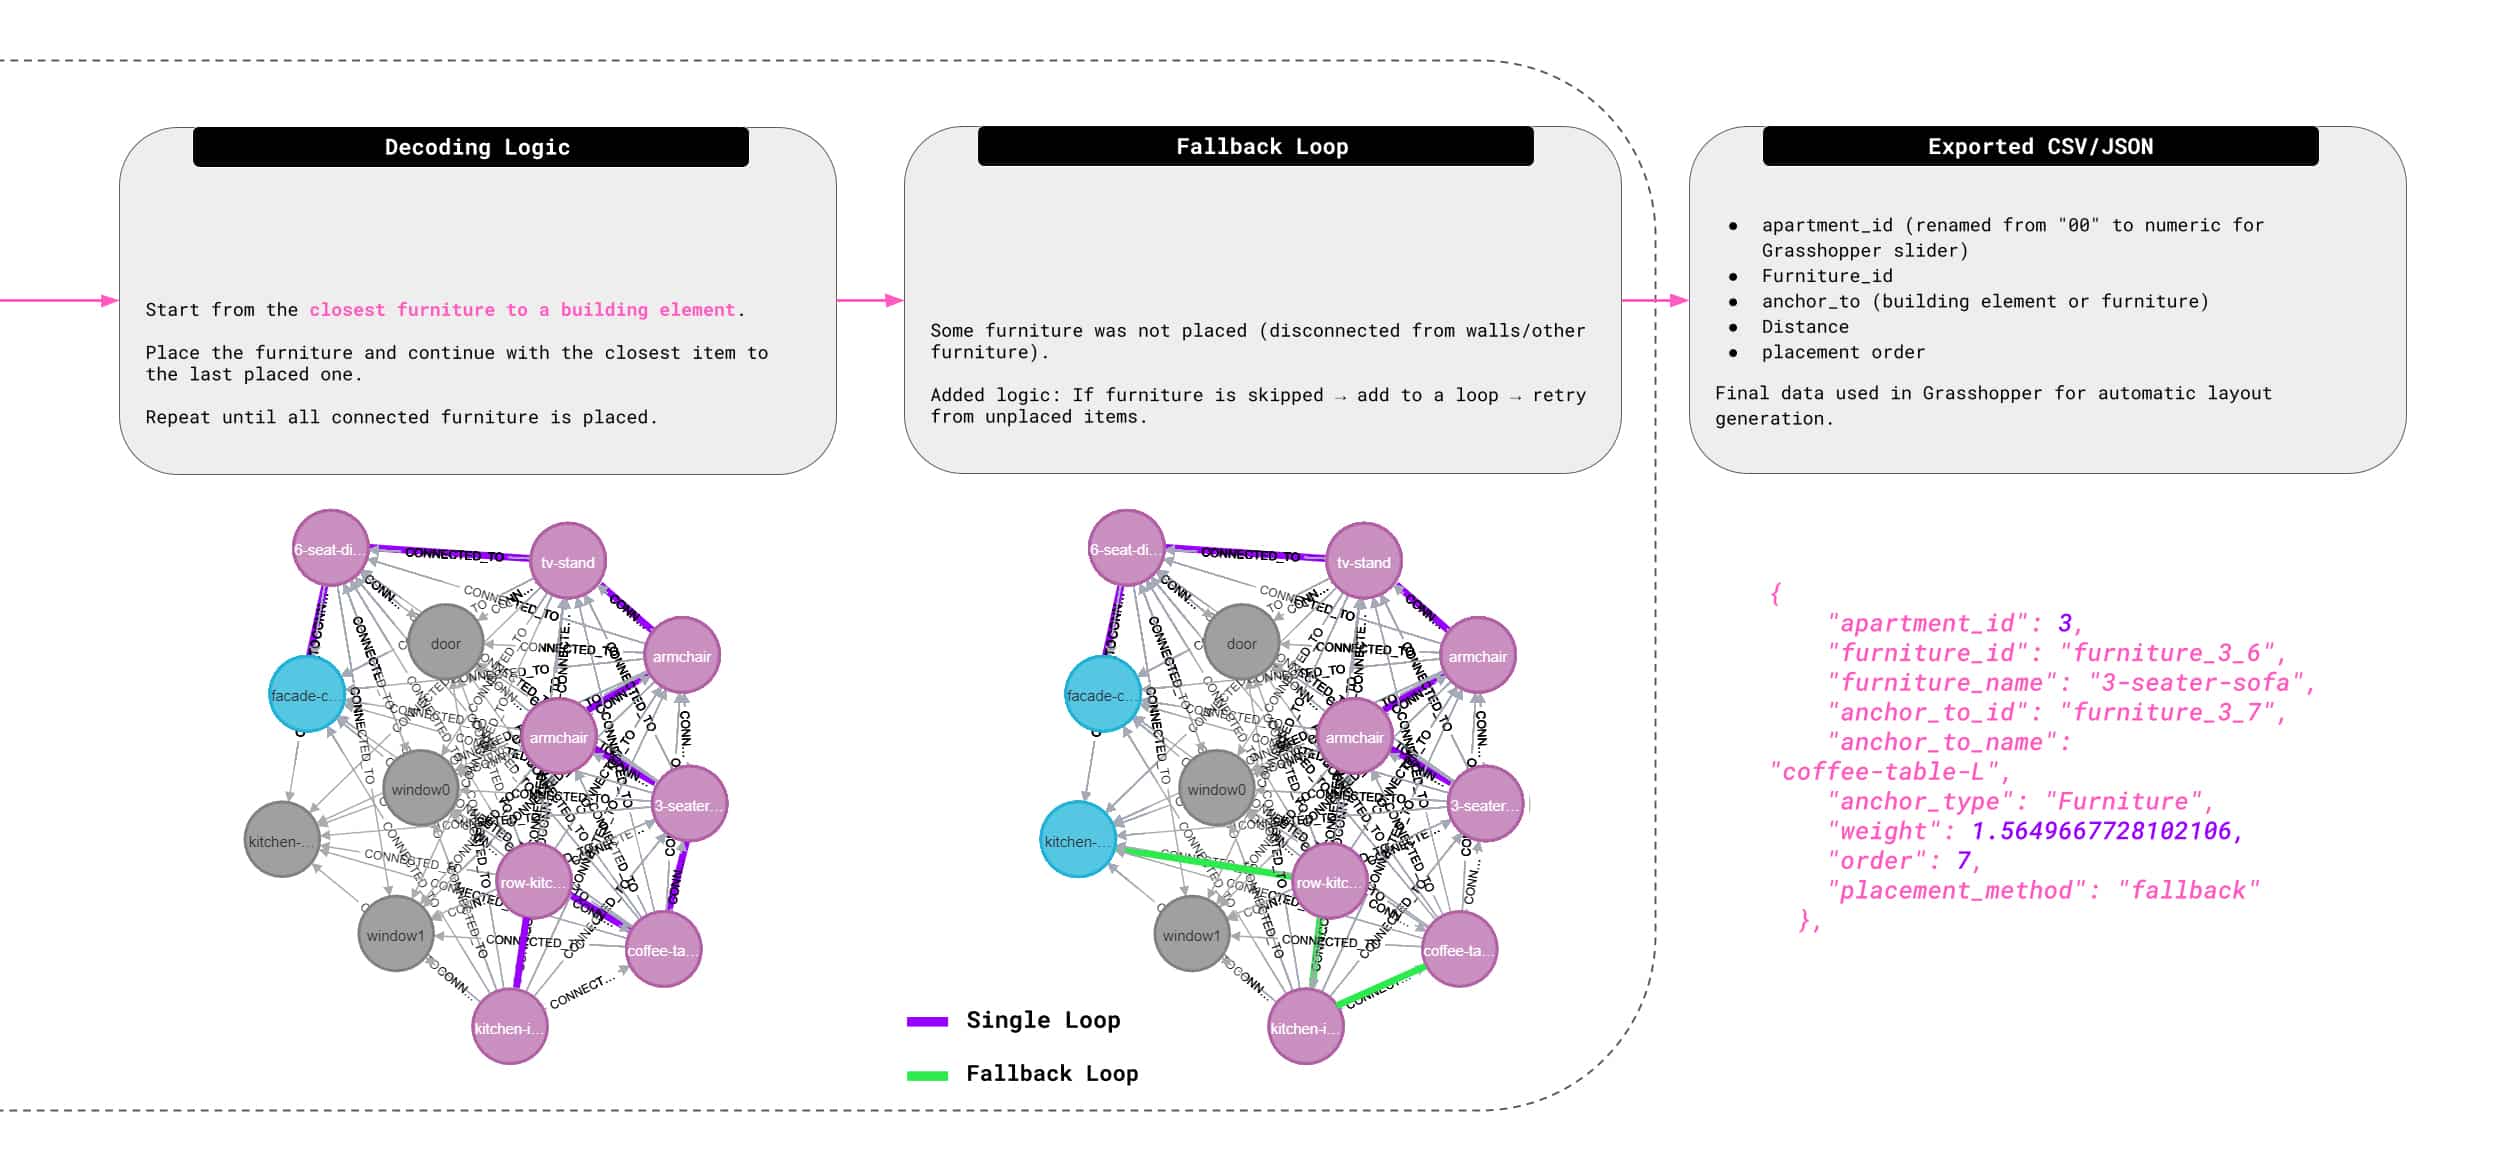
Furniture placement was decoded by starting from the nearest anchor and placing connected furniture items outward, in order of proximity. Items without direct connections were handled using a fallback loop, ensuring that all furniture was eventually included. Final placement data was exported as both CSV and JSON files, with information such as furniture ID, anchor, distance, and order.
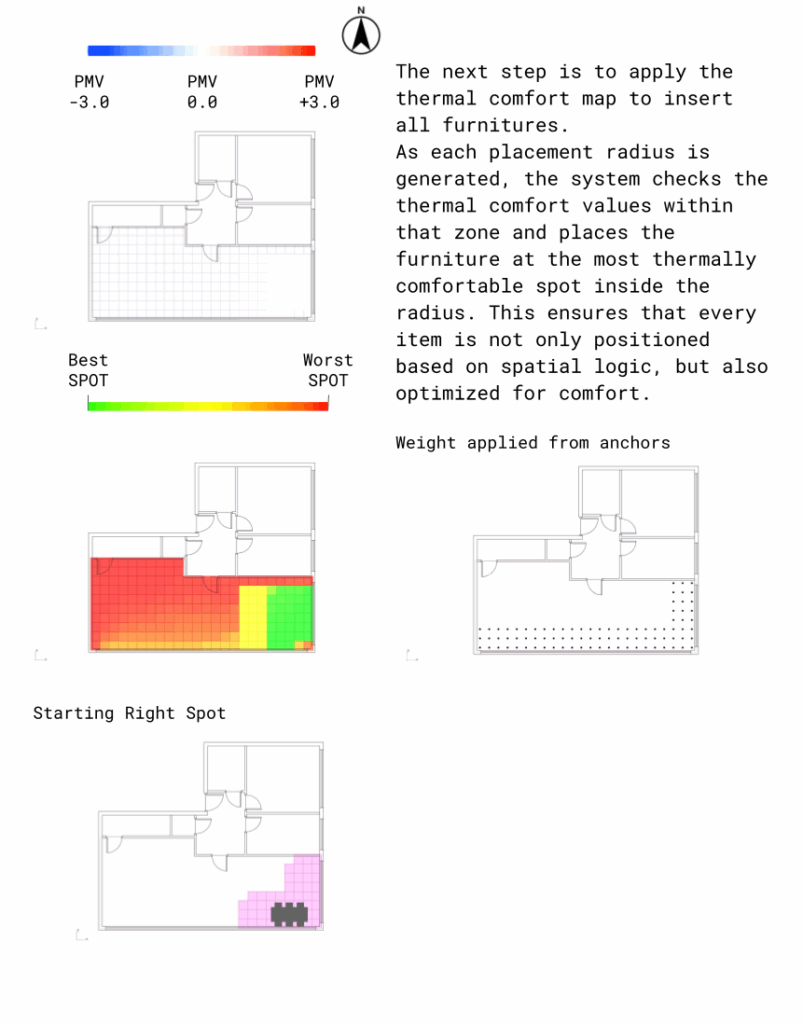
Grasshopper Integration and Comfort Evaluation
In Grasshopper, furniture was placed algorithmically based on the decoded JSON data. Items were positioned by expanding from anchor points, using a radius-based method. Thermal comfort overlays were then used to adjust placement within each radius, steering items toward areas with higher comfort scores.
Reflections
Problems
BDG apartment size
The BDG apartment layouts were based on 3×3 meter rooms, which significantly constrained our design flexibility. The limited spatial dimensions made it difficult to accommodate a variety of furniture types or experiment with alternative furniture placements. As a result, the layouts could not fully support the spatial adaptability and variation that our project aims to explore.
Solutions
Apartment Layout Generation
To address this limitation, we transitioned to generating 1-, 2-, and 3-bedroom apartment layouts using the Plan Finder tool. This allowed us to work with more realistic spatial configurations and provided the flexibility needed to test a wider range of furniture types and placement strategies aligned with the project’s goals.
Plan Finder
While using Plan Finder, we encountered a few limitations.
Firstly, the tool was restricted to generating a maximum of 20 apartment layouts per iteration, which posed a challenge given our goal of producing over 1,000 layouts for large-scale testing.
Additionally, the generated furniture was represented as a flat list of exploded line segments, lacking any embedded metadata to identify furniture types or attributes. This significantly hindered our ability to automate the decoding and analysis processes, requiring additional preprocessing steps to classify and tag each item manually.
Nearest-neighbor classifier
Development of a nearest-neighbor classifier that uses geometric features like face count, bounding box dimensions, aspect ratios, and edge types to classify and label furniture types consistently.
IFC
ggIFC resulted to be computationally expensive and, in our opinion, not well-documented for complex or non-standard workflows, such as the one we created.
NetworkX
NetworkX-based workflow resulted to be more flexible for our purpose, offering faster run times.
Furniture decoding
During the graph decoding process, we encountered several challenges, including inconsistencies in placement order and anchor connections. However, the most critical issue emerged after finalizing the decoding logic: in some cases, the algorithm would place only 2–3 furniture items and then stop. This occurred because there were no remaining connectivity relations—either to architectural anchors or to already-placed furniture—causing the decoding to halt prematurely.
Fallback Loop
To resolve this, we introduced a fallback loop mechanism. This rule allowed the system to reprocess any unplaced furniture items by selecting their closest available connection, even if it wasn’t part of the initial anchor chain. This ensured that all furniture could eventually be placed, even in partially disconnected graphs.
Constantly change workflow
Due to the evolving nature of the project, we frequently had to adjust our workflow. This included switching from the BDG dataset to custom-generated plans, transitioning from IFC-based geometries to graph representations, and continuously refining our decoding logic. These shifts were necessary to accommodate emerging challenges and better align the methodology with our project goals.
Adaptation
The solution? A mix of caffeine, sleepless nights, constant panic mode—and just the right amount of last-minute adrenaline-fueled motivation.
