
INTRODUCTION
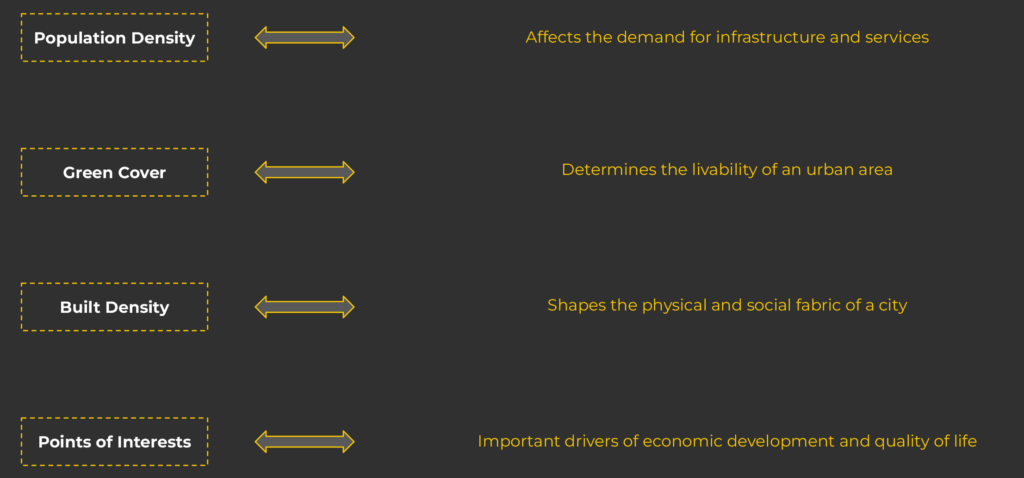
Urban planning decisions have a significant impact on the development of cities, and using machine learning can provide decision-makers with valuable insights to make informed decisions. By clustering urban areas based on various factors such as population density, built density, POI density, green cover, and build diversity, we can reveal spatial patterns that can be used as a basis for targeted interventions and resource allocation.
METHODOLOGY
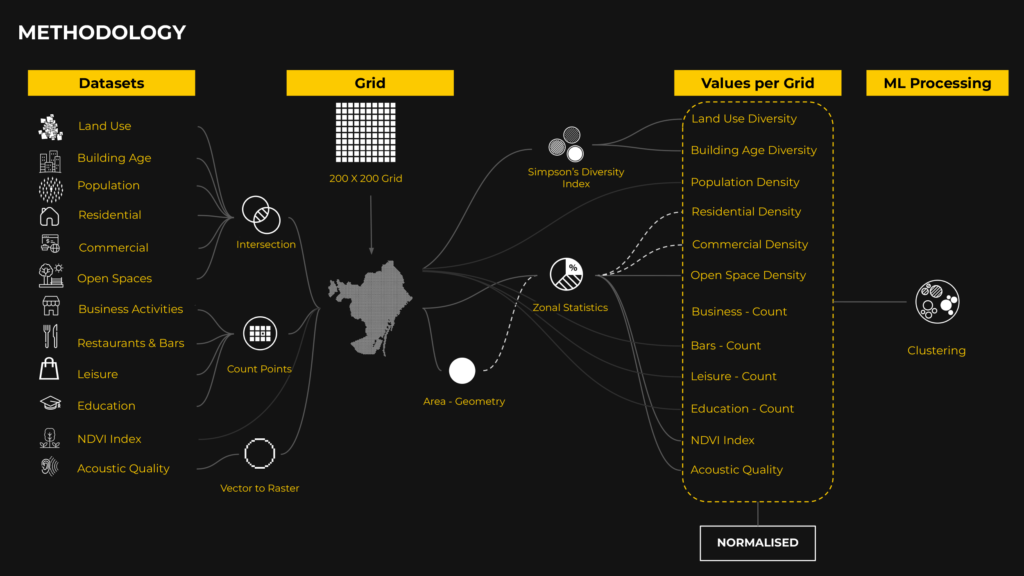
To carry out this project, we used datasets from OpendataBCN and Ajuntament Barcelona, which included information on population density, open spaces, current land use, building blocks, building age, business activities, restaurants and bars, leisure activities, educational institutions, acoustic quality, and NDVI index. After cleaning and filtering the data, we intersected it to a grid of 200mx200m in the city of Barcelona to obtain values per grid, which we then ran into the clustering model.
CORRELATION
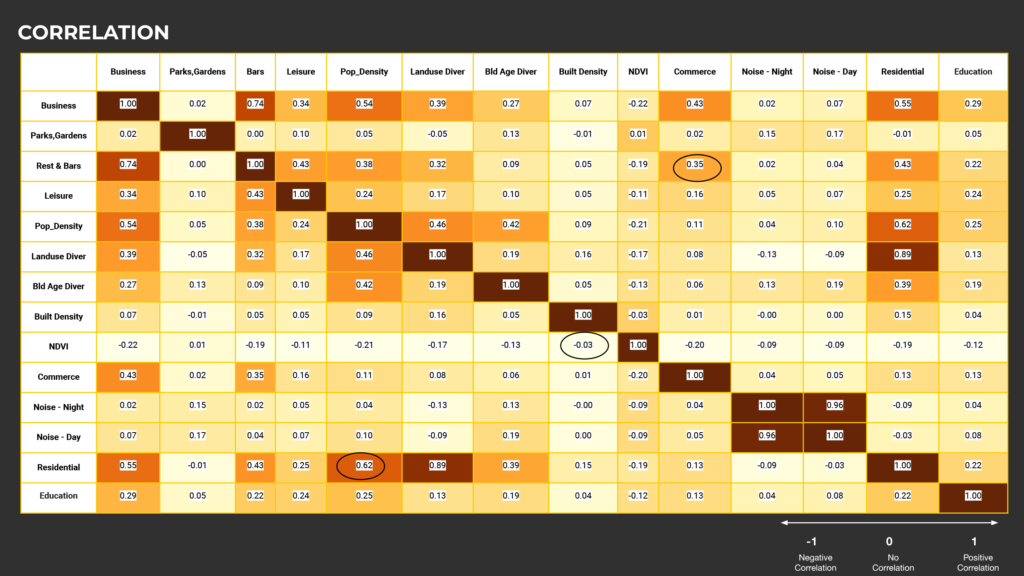
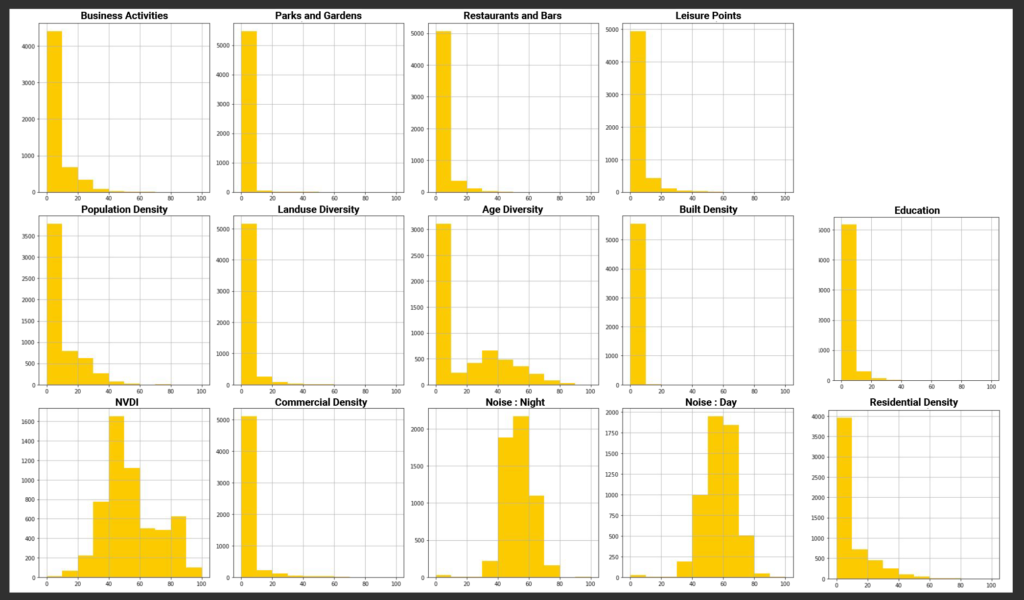
The correlation matrix revealed several interesting correlations, such as the close correlation between bars and commercial density and the inverse correlation between built spaces and the NDVI index. Additionally, we observed a close correlation between population density and residential density.
DATA DISTRIBUTION
CLUSTERING
We ran two types of clustering – Agglomerative and K-means – and determined that the K-means clustering method was more suitable for our project.
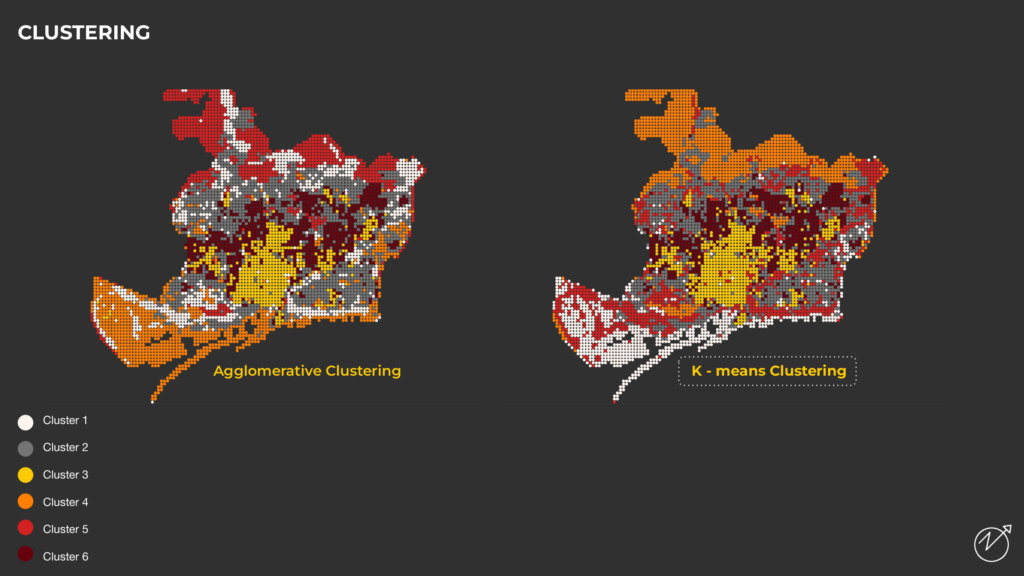
By running various numbers of cluster results, we found that six clusters were optimal, as determined by the elbow method.
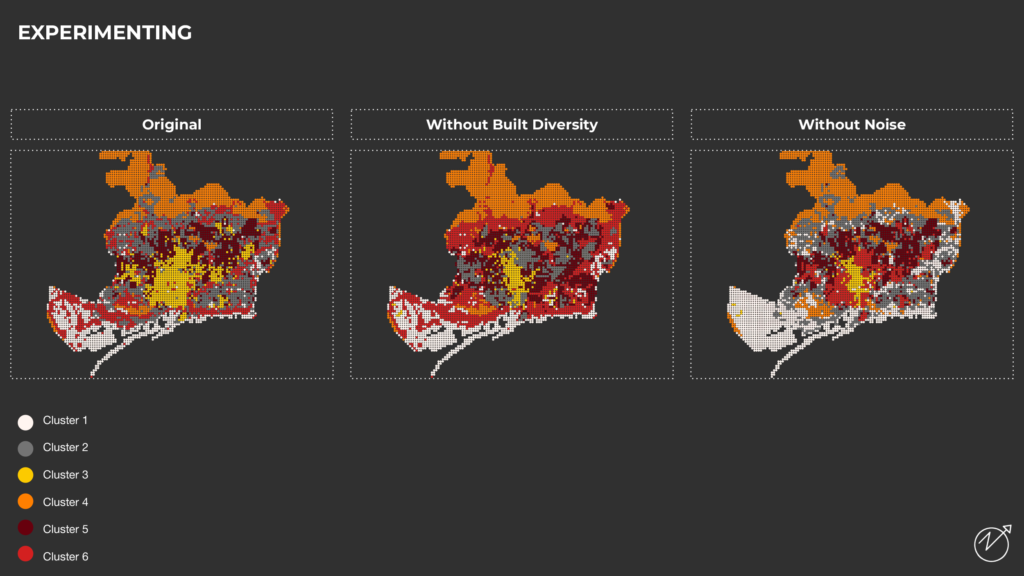
EXPERIMENTING
PRINCIPAL COMPONENT ANALYSIS
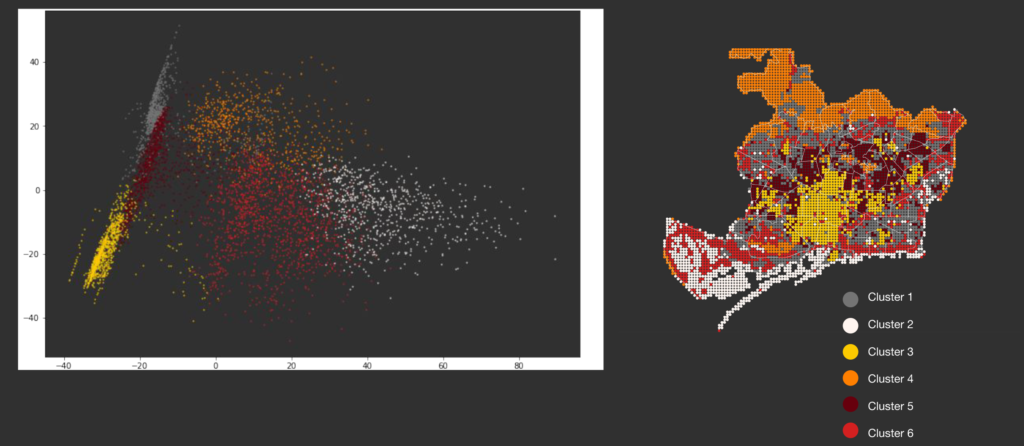
T-SNE ANALYSIS
The T-SNE graph helped us understand the spatial relationships between different clusters and the various factors used to generate these clusters. By identifying overlapping clusters, we were able to identify areas that are similar in terms of distribution of land use, population density, and activities. The T-SNE graph also pointed out the cluster with a higher NDVI index and low population density, which could be an area of interest for targeted interventions.
DASHBOARD
UNDERSTANDING CLUSTERS
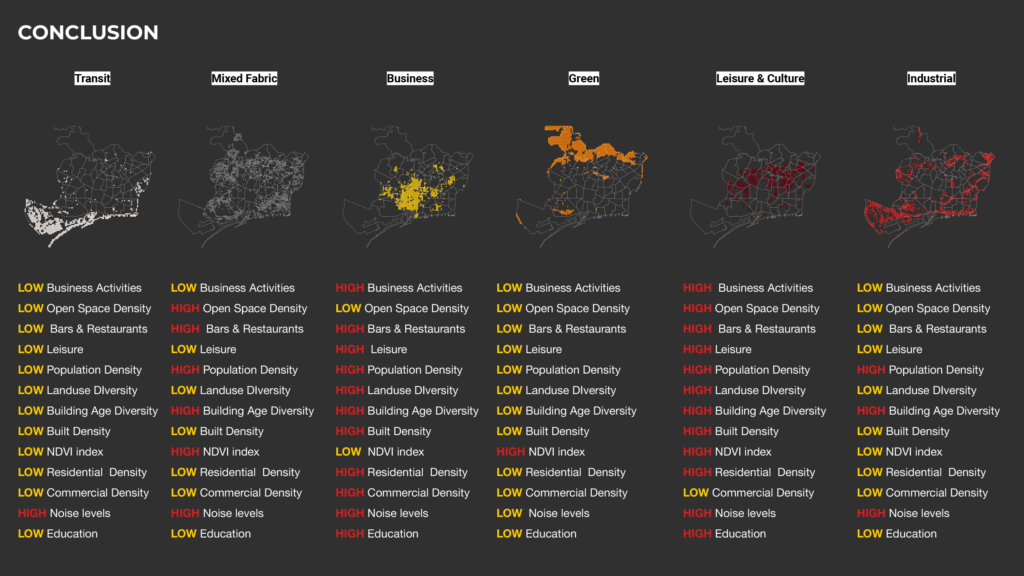
The urban areas of the city can be divided into six distinct clusters based on different characteristics.
Cluster 1 includes the port and the Litoral highway, which are significant for the city’s transportation and logistics.
Cluster 2 represents areas with high population density but low built density.
Cluster 3 comprises areas with a high concentration of business and commercial activities.
Cluster 4 shows the green areas with low population density, located away from the city center.
Cluster 5 is enriched with leisure activities and has a balance of open space and built density, situated at a distance from the city center.
Cluster 6 is mainly focused on industrial areas with high population density and noise levels, but lacks green spaces as indicated by the low NDVI index.
UNDERSTANDING ATTRIBUTES
The box plots provide insights into the distribution of various features in each of the six identified clusters. The third cluster has the highest residential diversity and population density compared to other clusters, indicating a high concentration of people from diverse backgrounds in this area. In contrast, the fourth cluster has the highest NDVI index, indicating the presence of more green spaces in this cluster compared to others. The box plots serve as a useful tool for understanding the distribution of each feature in each cluster, allowing urban planners to make data-driven decisions while designing and developing different parts of the city.
CONCLUSION
Based on the analysis of the city’s different parts, it is evident that the city is divided into distinct clusters, each displaying unique characteristics. The city center is densely packed with activities, while the outskirts of the city have lower activity levels depending on population density. The analysis shows that the city grows outwards from the center, and this growth is reflected in the various clusters identified. The port area stands out as being different from the rest of the city and is well-identified in the clustering analysis. This analysis provides valuable insights into the city’s development, which can help inform urban planning decisions and facilitate the city’s sustainable growth.
ZOOM-IN ANALYSIS
The exercise of zooming into the identified clusters and comparing them with satellite images provided valuable insights into the differences in the city’s fabric. It allowed for a better understanding of how the clusters are interrelated and how even adjacent city blocks can fall under different clusters due to changes in input characteristics. The comparison between the satellite images and the cluster analysis revealed how certain features, such as green spaces and population density, can have a significant impact on the distribution of urban fabric.
VISION
To conclude, the clustering analysis provided valuable insights into the characteristics of different areas of the city, which can help inform urban planning decisions.
Next steps could include incorporating street view images into the analysis, which would allow for a more detailed understanding of the city’s fabric and help policymakers make more informed decisions about interventions and policies.
