
A tangible table that shows a building’s cost, carbon and time while you design it
Hardware III · Human in the Loop · Interactive Systems · 2025–2026
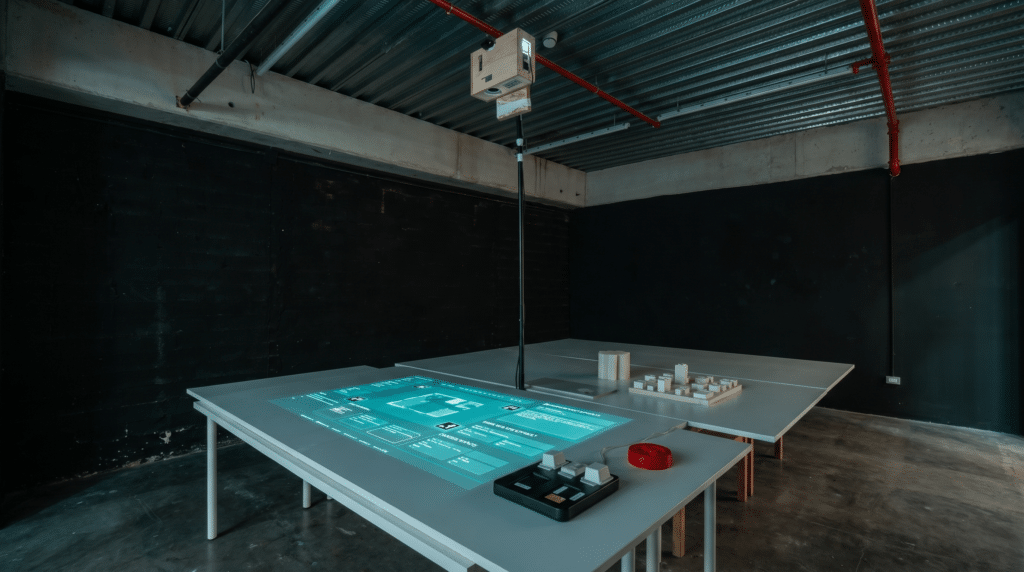
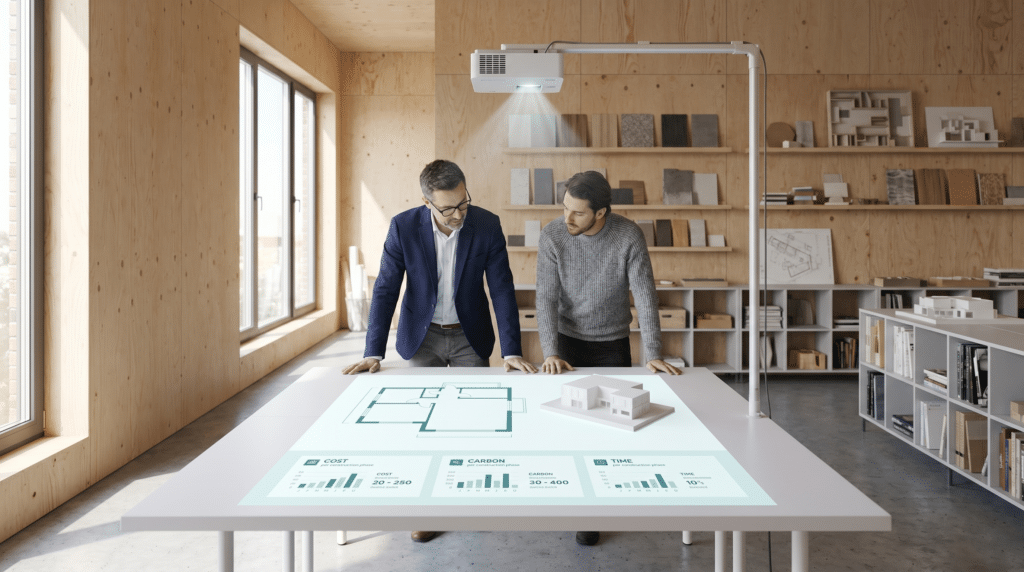
Every building starts with a handful of decisions made in the dark — material, method, footprint, height. They are committed first, before anyone consults the data, and they lock in most of what the building will cost the planet and the client. We built a table that turns the lights on: place a physical model, draw a footprint with your hands, set the height, choose a material, and watch the consequences appear on the table itself, live, as you configure the building.
The problem: the decisions that matter happen before the data arrives
The early stage of a project is where material, method, footprint and height are chosen — and it is also where the data is least present. The numbers that should inform those choices arrive too late to change them.
– 37% of global energy-related CO₂ emissions come from buildings. (UN Environment Programme · 2022 Global Status Report)
– Up to 80% of a project’s lifecycle impact is locked in during early design. (McKinsey & Company · 2023)
And the data is no refuge. For non-experts it is inaccessible; for experts it is contested. The same material, the same building, can swing wildly depending on which database or method you trust:
– Up to 282% — how much the carbon figure for one material can change just by switching database. (Building & Environment · 2023)
– ~200% — how much the same building’s result can move when you only change the calculation method. (Renewable & Sustainable Energy Reviews · 2021)
A single number, presented with confidence, misleads. So we asked a different question: what if you could see the consequences — as honest ranges, not single figures — while you configure the building itself?
The proposition: a table that reads your building
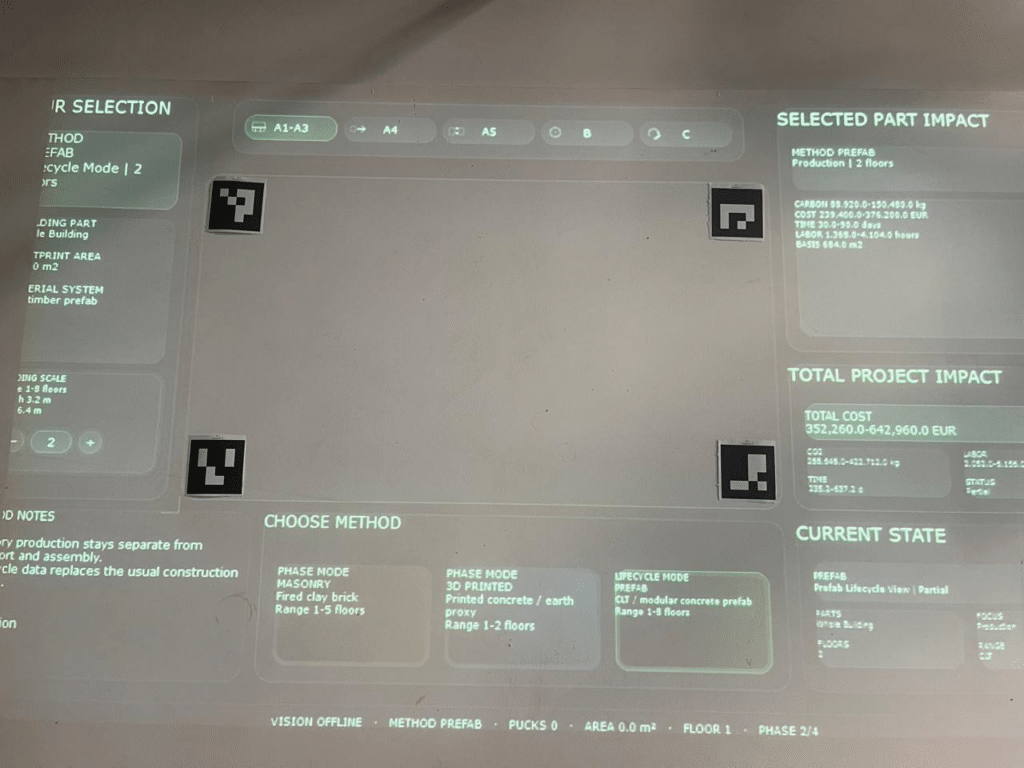
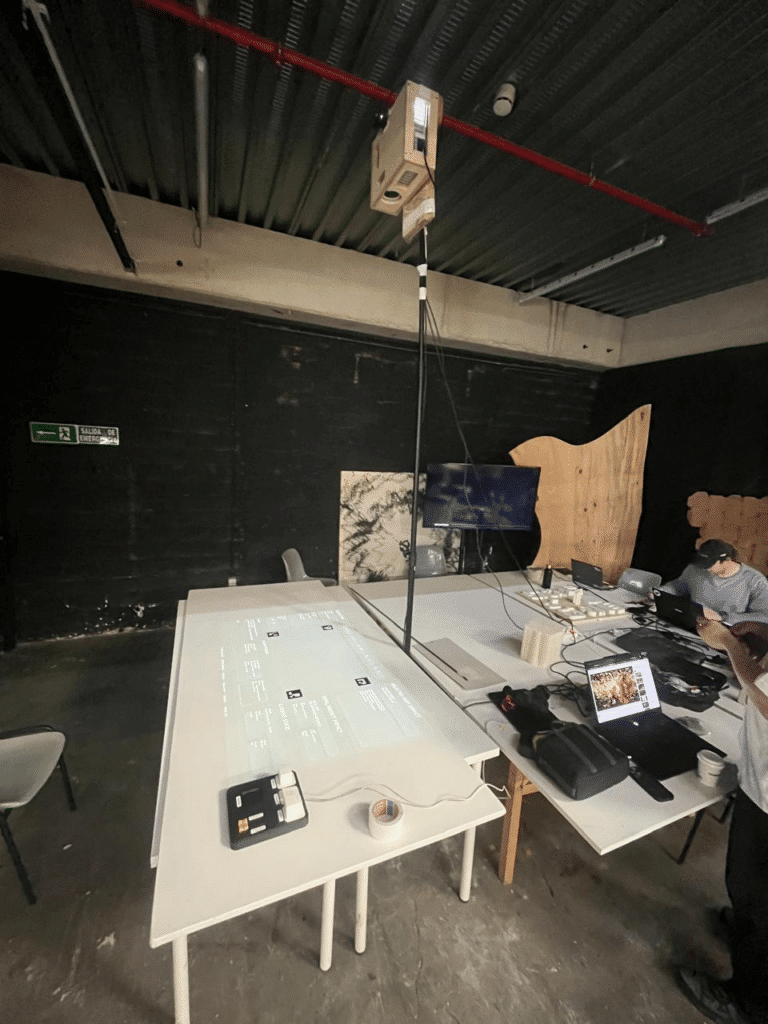
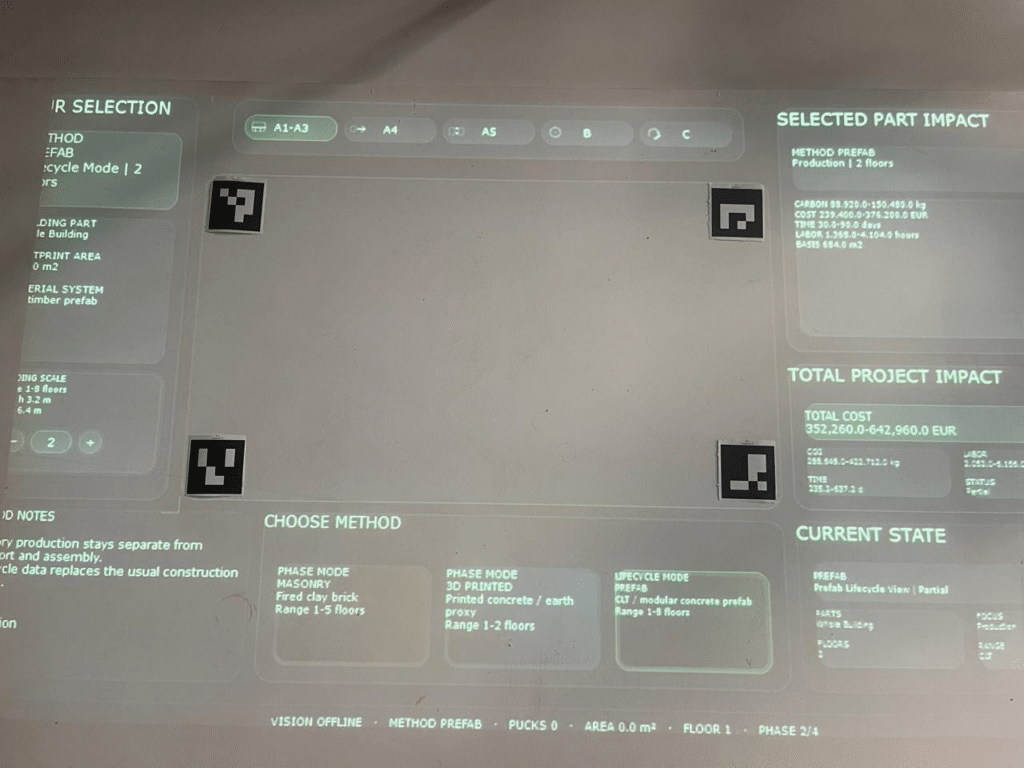
Guided Comparative Assembly is a tabletop installation. Configuration happens on the surface itself; an overhead short-throw projector returns visual feedback on a nine-panel layout. The system reads the physical objects you place, computes the impact, and shows it back in real time.
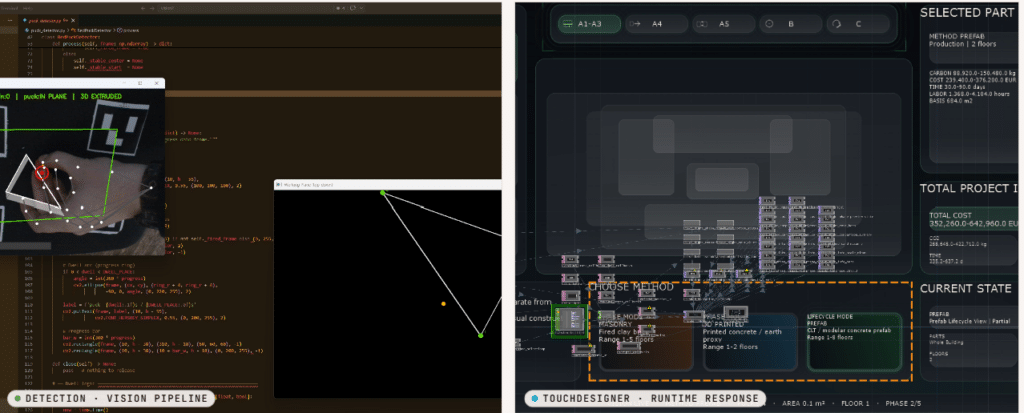
There are two halves to the live loop, and they run side by side: a vision pipeline that reads the working plane and the puck, and a TouchDesigner runtime that responds instantly to what the camera sees.
The visitor journey: five moves
The experience is five physical moves. Each one is an action the camera must confirm against a projected target before the projection advances — nothing happens until the table sees it happen.
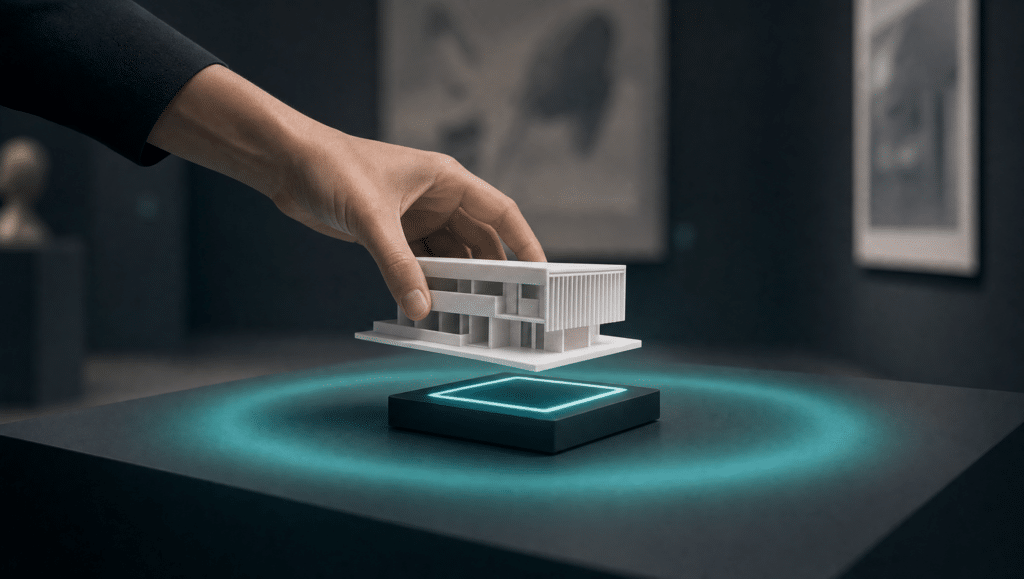
1. Method — place a printed model on the RFID pedestal to choose the construction method.
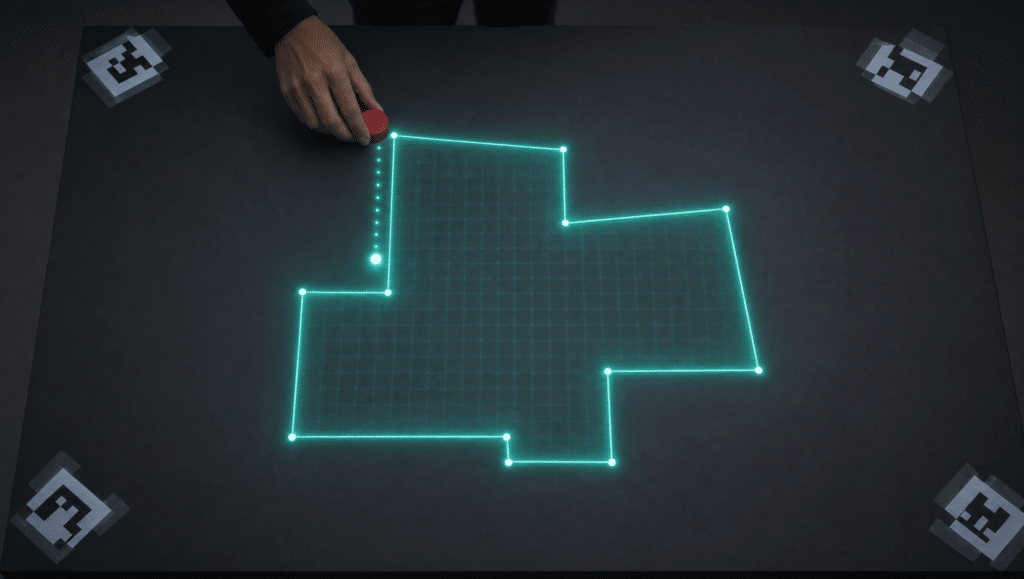
2. Footprint — dwell a red puck to drop each corner point, drawing the building’s plan.
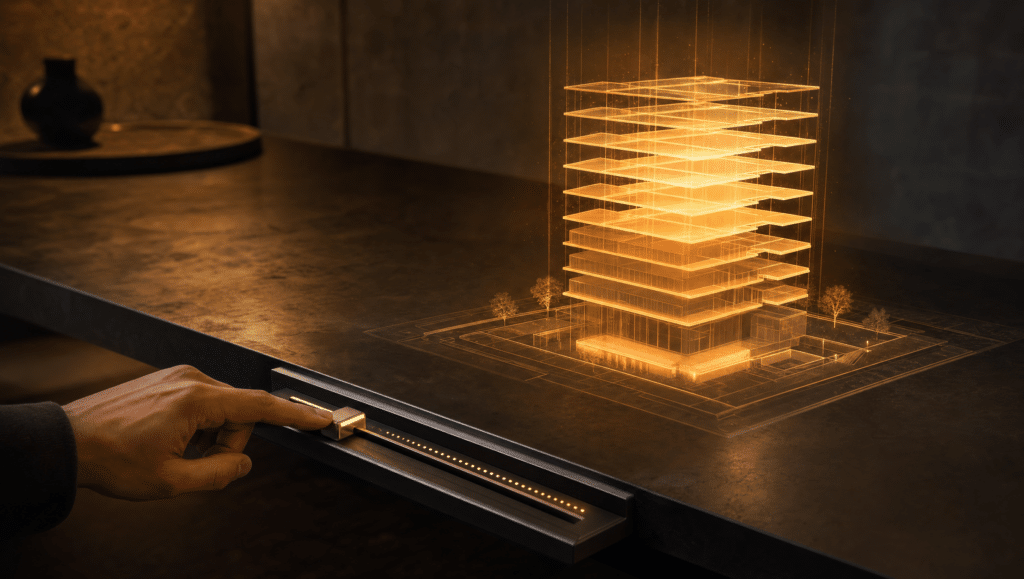
3. Height — push a linear slider to set the floor count.
4. Validate — set the material and confirm the summary.
5. Compare — walk the build phases, then end on a side-by-side comparison.
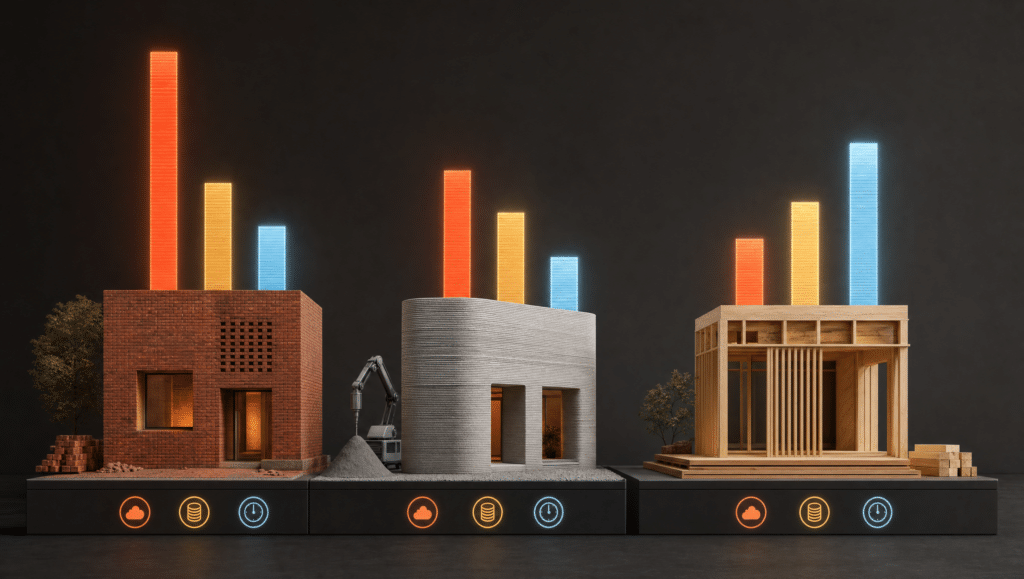
Every phase outputs five sourced metrics — CO₂e (kg), Energy (MJ), Labour (hours), Time (days) and **Cost (EUR 2026) — each as a range with provenance and a confidence level, never a single figure.
State of the art: two tangible tables, one idea
We did not invent the tangible table. Two precedents taught us the loop.
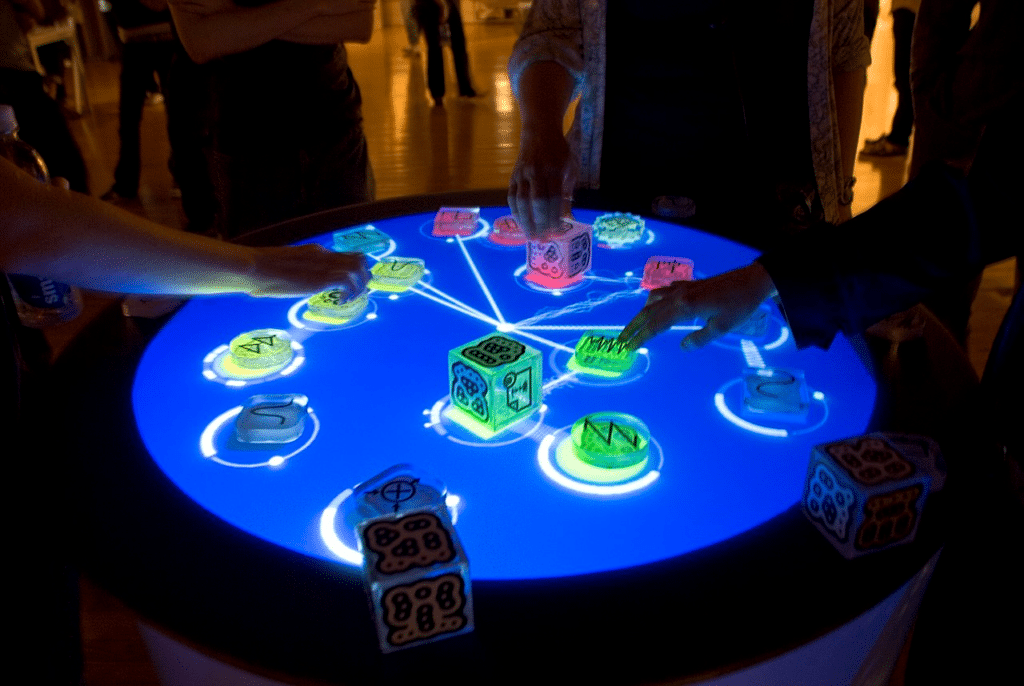
reacTable (Universitat Pompeu Fabra, 2007) read pucks on a table with a camera and reconfigured sound in real time — the pucks *were* the controls.
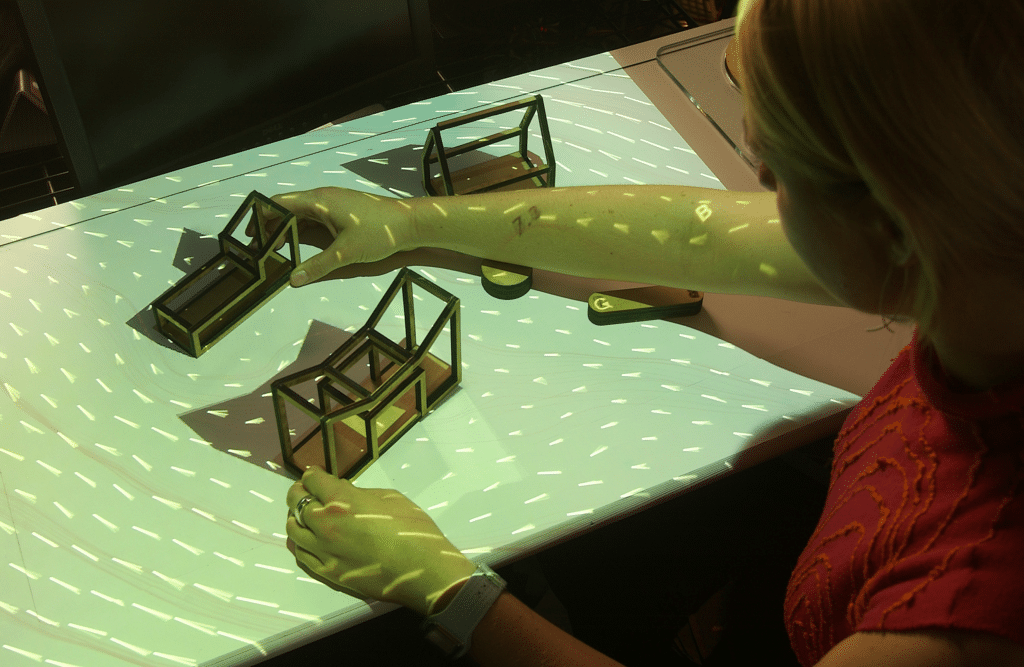
Urp (MIT, 1999) put building models on a table and tracked their shadows against a simulated sun — real objects, live environmental feedback.
We borrowed their loop — **project, place, confirm, advance** — and aimed it somewhere new. Urp showed the weather around a building. reacTable made sound you could touch. We show what a building costs the planet *while you build it*. No table before has put guided assembly, tangible controls and life-cycle comparison together in one surface.
The logic: three layers, separated on purpose
Underneath the five visible moves is an eight-state machine — idle, method, footprint, height, materials, validate, phase, compare — with exactly one state active at any moment. We deliberately split the logic into three layers so the system stays debuggable:
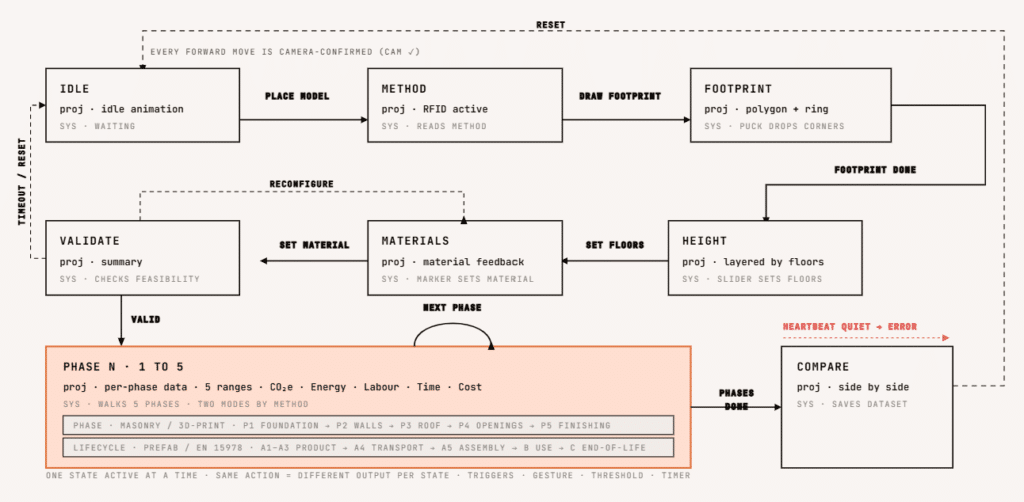
1. The content FSM — the visitor-facing journey, eight states, every forward transition camera-confirmed.
2. The wrapper — calibration, error and reset, which can interrupt the content machine at any point. If the vision heartbeat goes quiet for ten frames the data is stale and the wrapper trips to error.
3. The visual feedback codes — projection output (disconnected, pending, invalid, valid, summary, comparison), which are*not states.
Computer vision: a linear pipeline with one exit
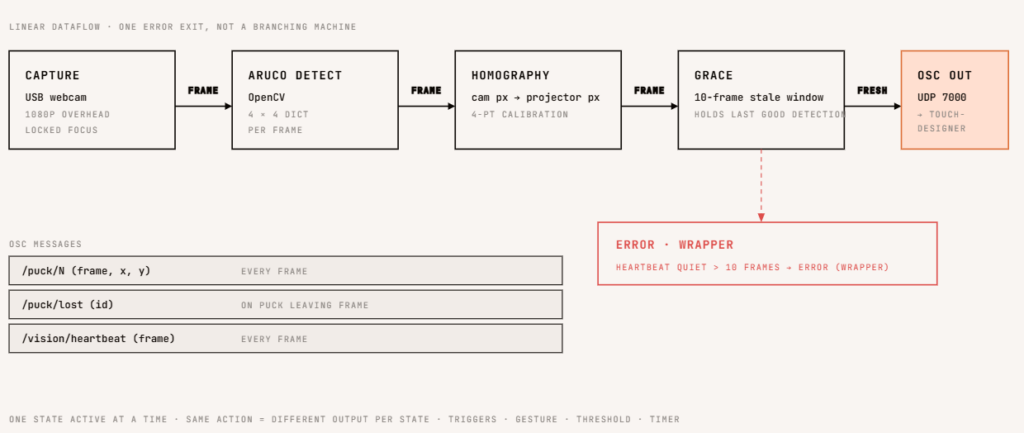
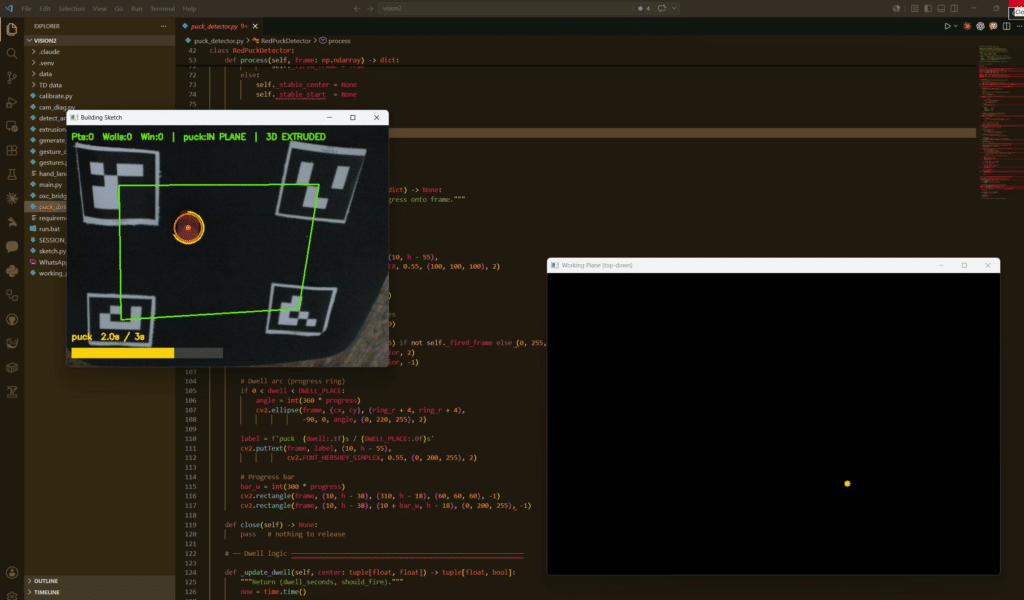
The vision path is five steps — capture → ArUco detect → homography → grace window → OSC out — and it carries three messages to TouchDesigner on UDP port 7000: puck positions, puck-lost, and a heartbeat. It is a pipeline with a single failure exit, not a branching machine: if the heartbeat stops, the wrapper trips to error. A parallel sketch path uses MediaPipe to read the hand for secondary actions — undo, add a window, extrude, reset — each on a timed hold.
The physical layer: objects you touch
These are the things a visitor actually handles:
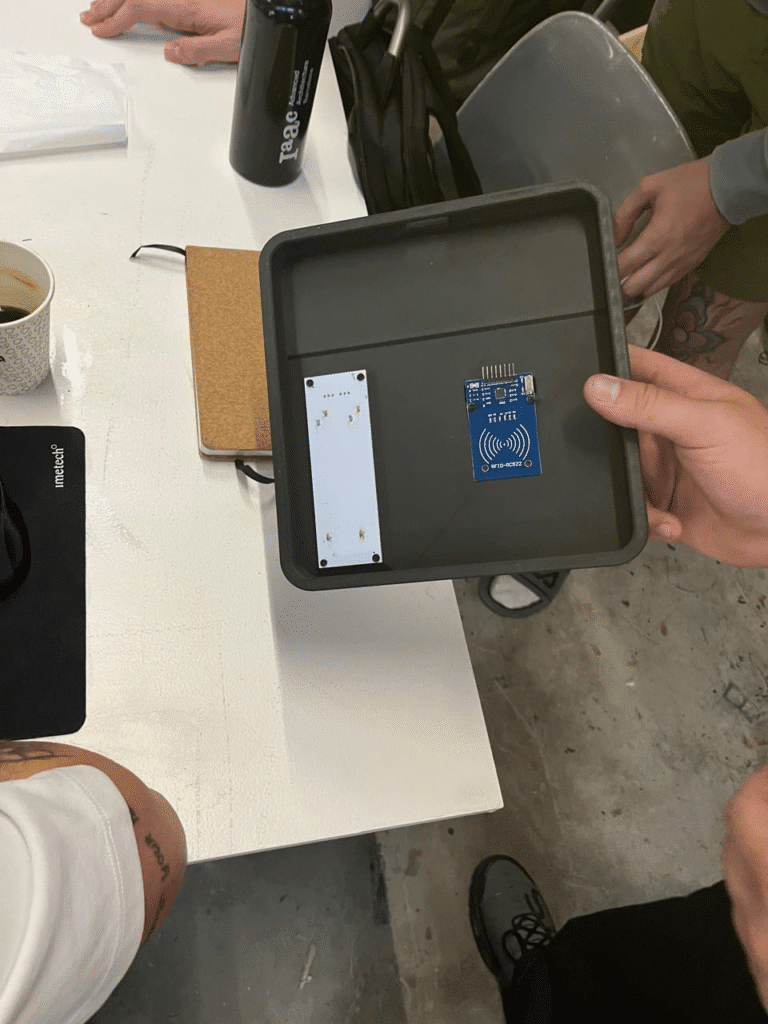
– Three method models, 3D-printed, each carrying a MIFARE Classic 1K RFID tag — masonry, 3D-printed, prefab.
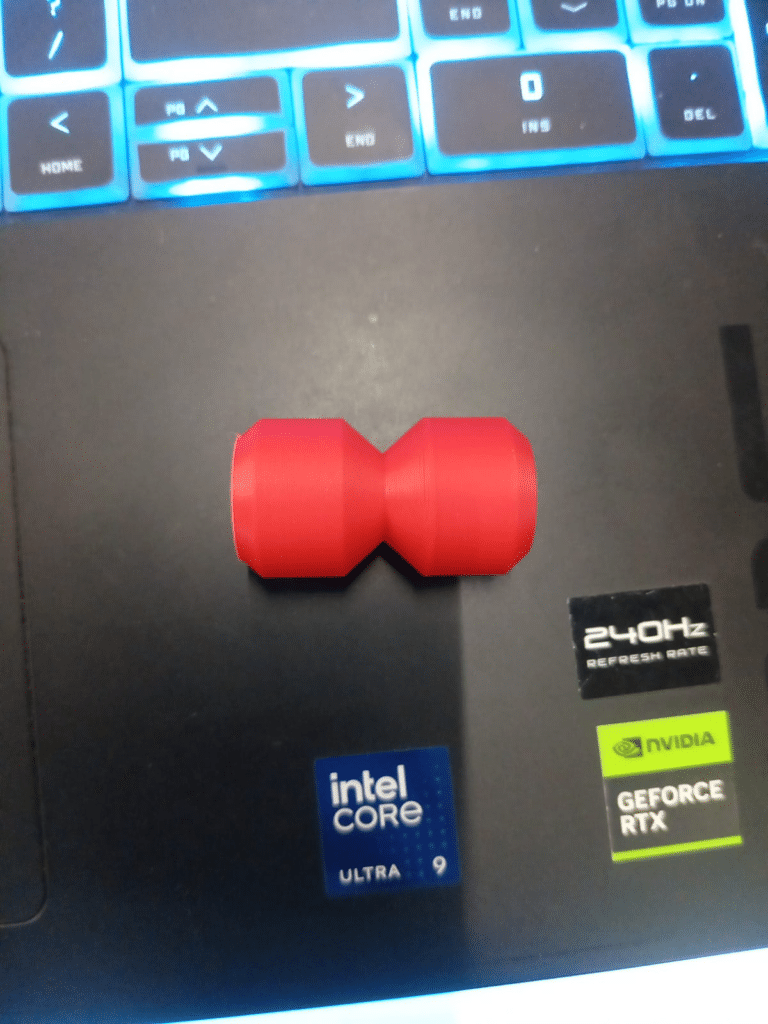
– Four corner markers plus one red puck — ArUco IDs 0–3 fix the working plane via homography; the HSV-tracked puck dwells three seconds to drop each footprint point (area via the shoelace formula).
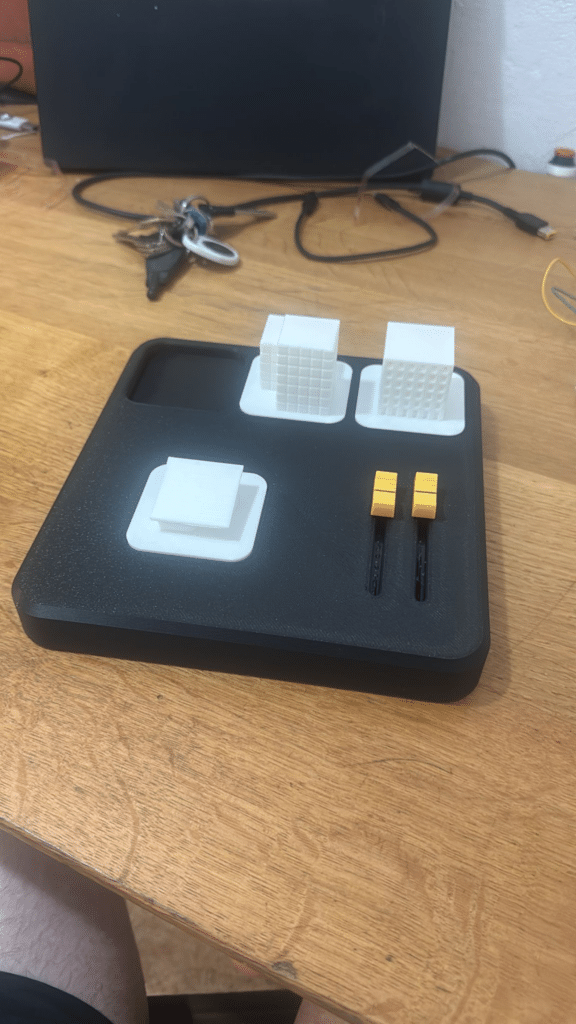
– The configuration inputs — a linear slider for height and a marker for material.
The data: one source of truth
Three methods — masonry, 3D-printed, prefab — each with its primary sources, its known wobble, and five metrics per phase:

Every figure is stored as a range with a confidence level and assumption notes, so the methodology-wobble layer has something real to draw from.
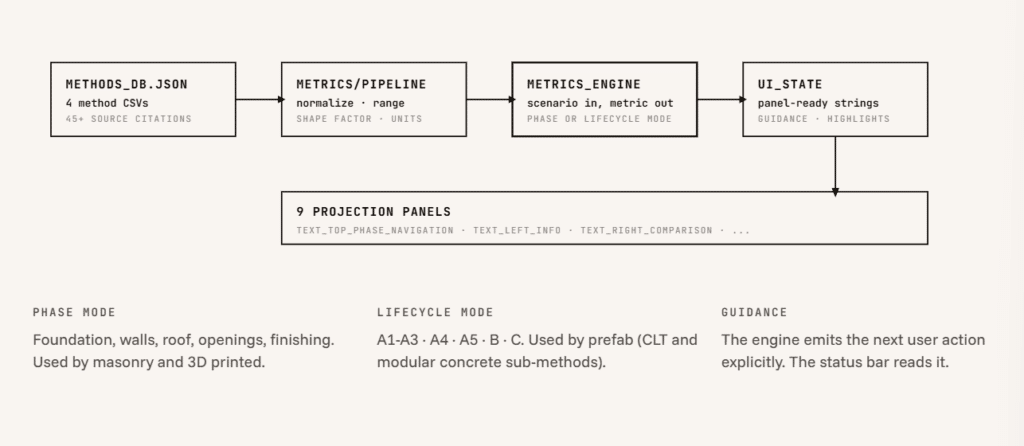
A single methods database feeds a pipeline that normalizes and ranges the numbers; a metrics engine takes a scenario and returns metrics in either phase mode (foundation → walls → roof → openings → finishing) or lifecycle mode (A1–A3 → A4 → A5 → B → C); and it emits panel-ready strings — including the next user action — straight to the nine projection panels.
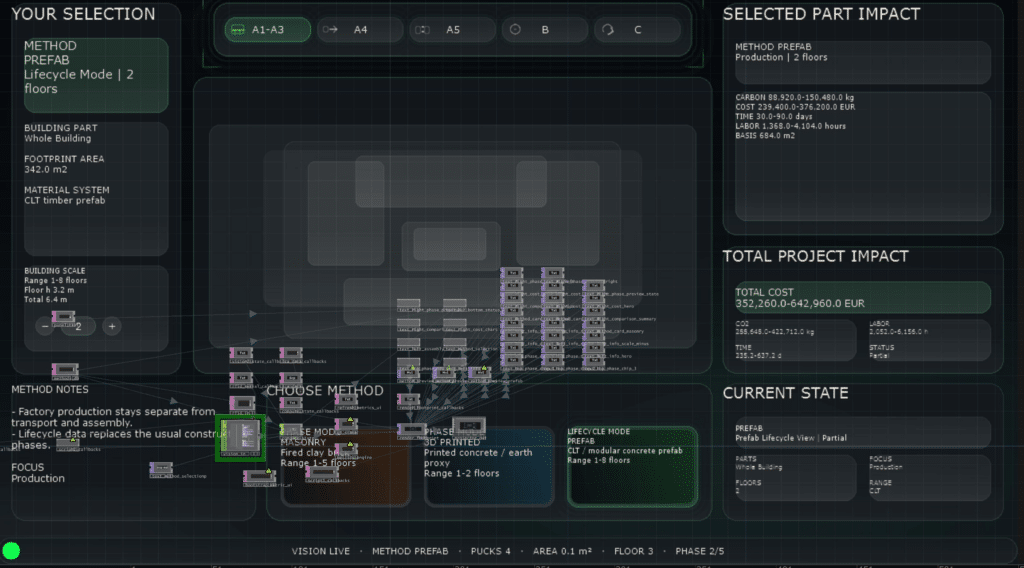
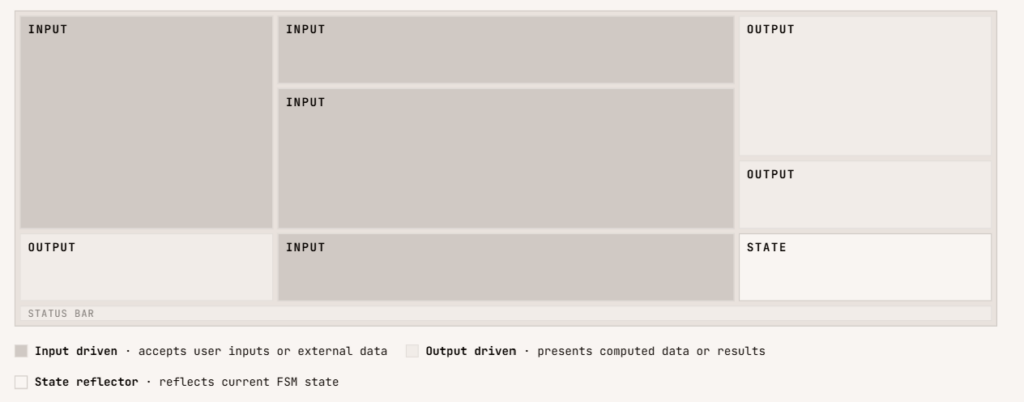
The projection itself is one Script TOP laying out nine named panels, each with a stable position and a stable meaning. The layout is our visual contract: selection clusters top-left, the plan is the centre, impacts read down the right column, and a status bar runs the next action along the floor of the projection.
Outlook: closing a loop, not starting one
Mid term — depth and polish: a sound layer (method soundscapes per phase), projection re-calibration under exhibition lighting, and a proximity zoom that reveals detail when you lean in.
Long term — beyond finals: projected phase animations (paused behind the data lock until tier-1 numbers are signed off), more construction methods, and museum deployment with timed public testing. And the real horizon: the client table — standard kit in every studio and contractor, sitting at the client meeting and showing the plan and each phase’s cost, carbon and time, so client and consultant decide together, on the numbers.
Selected references
Forty-plus citations sit behind the numbers. A representative set:
– Alhumayani, H., Gomaa, M., Soebarto, V., Jabi, W. (2020). *Environmental assessment of large-scale 3D printing in construction: A comparative study between cob and concrete.* Journal of Cleaner Production, 270, 122463.
– Mohammed, M., Rahman, R., Mohamed, S. F., Ahmad, M. (2020). *3D Concrete Printing Sustainability: A Comparative Life Cycle Assessment of Four Construction Method Scenarios.* Buildings, 10(12), 245.
– Izaola, B., Akizu-Gardoki, O., Oregi, X. (2023). *Setting baselines of the embodied, operational and whole life carbon emissions of the average Spanish residential building.* Sustainable Production and Consumption, 40, 252–264.
– Andersen, J. H., Rasmussen, N. L., Ryberg, M. W. (2022). *Comparative life cycle assessment of cross laminated timber building and concrete building with special focus on biogenic carbon.* Energy and Buildings, 254, 111604.
– Wei, J., Ge, B., Zhong, Y., et al. (2024). *Comparative analysis of embodied carbon in modular and conventional construction methods in Hong Kong.* Scientific Reports, 14, 22833.
– ITeC Banco BEDEC (2025/2026 release). *Catalonia construction cost and material-quantity database.*
– EN 15978 + EN 15804 + A2. *European standards for life-cycle assessment of buildings and EPD methodology with biogenic carbon module D.*
