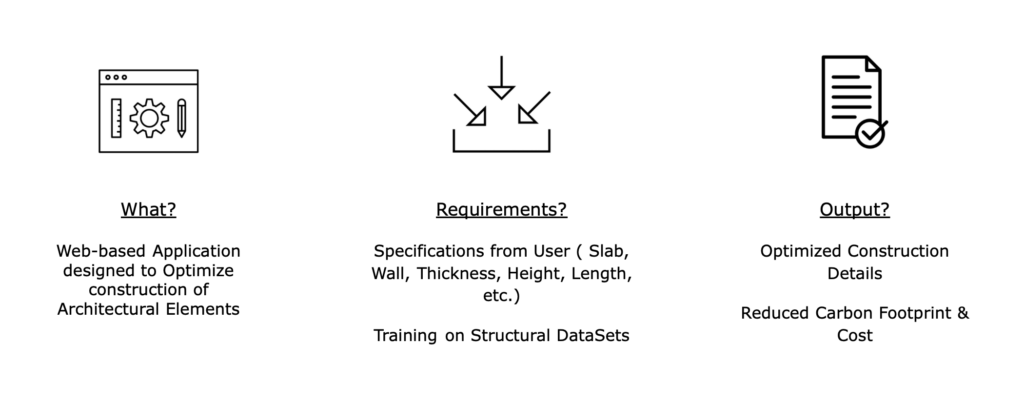
This project aims to develop a web-based application designed to optimize the construction of various architectural elements. The project requirements include several specifications from the user, such as the type of architectural element, its overall dimensions, and material selection. Additionally, the project involves specific training of a model using generated structural datasets from Karamba3D, which will be explored in further detail. Ultimately, the application will output detailed construction information for an optimized design of the selected element, including sustainability information such as a reduced carbon footprint and total cost.
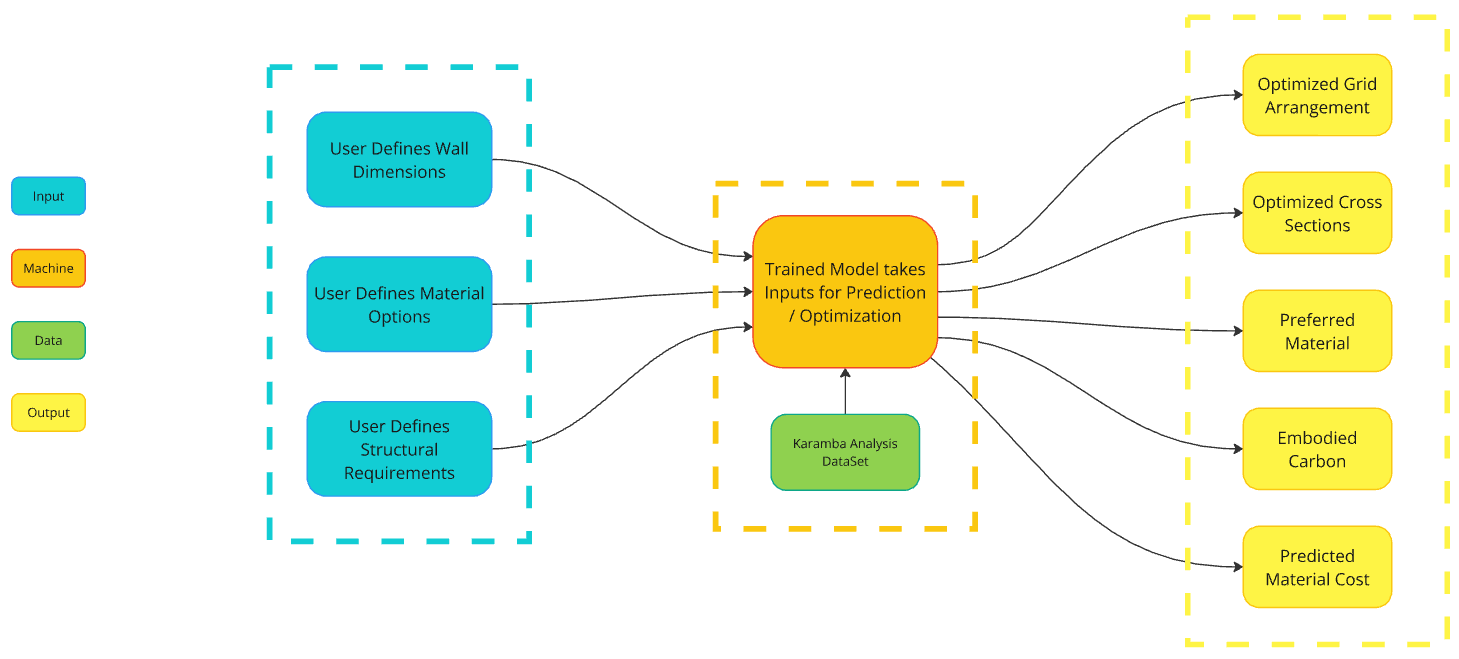
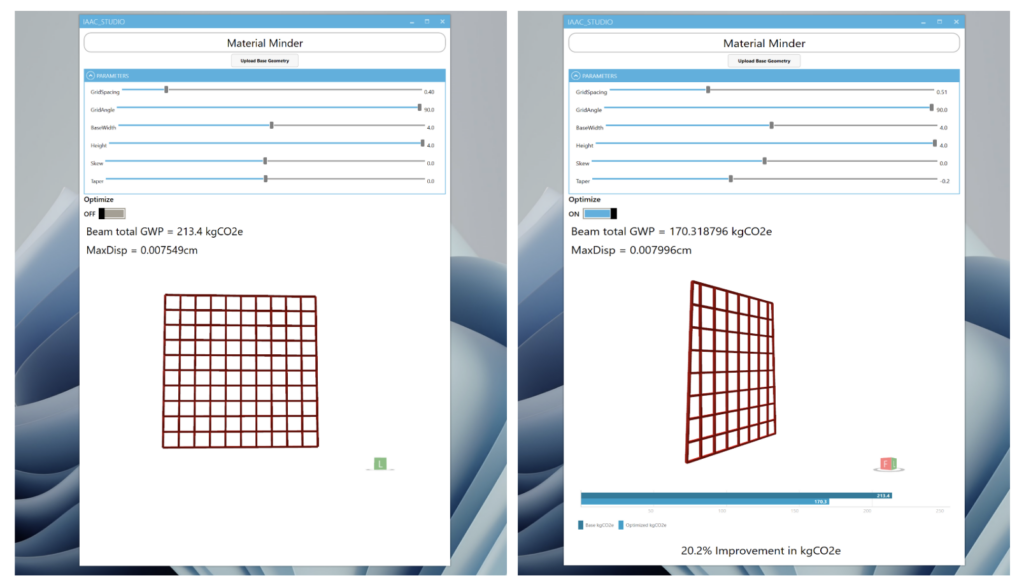
Regarding our intended user experience, the diagram presented provides a high-level overview of the process. The user would have options to define the dimensions of the element, such as a wall, either by uploading their geometry or simply inputting values. This would be accompanied by material selection and specific structural requirements, such as load capacity. Once these inputs are collected, the trained model would use them, along with the Karamba3D dataset, to provide optimized element options for the user. These options would include details such as grid arrangement, cross-section, and carbon footprint information.
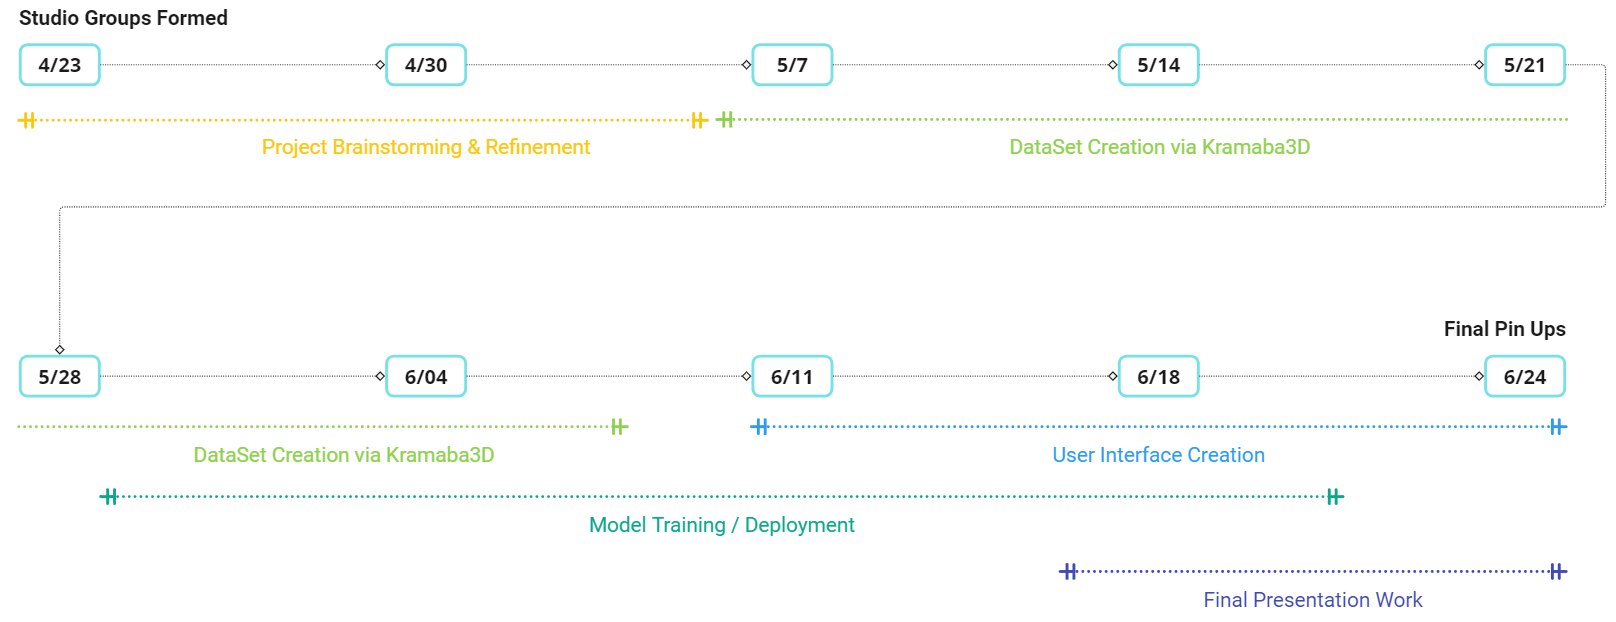
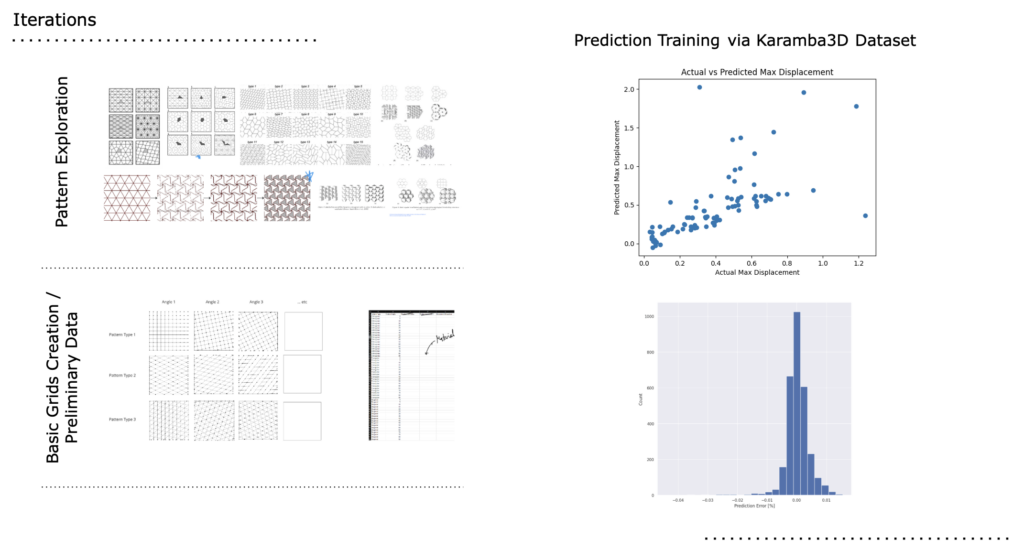
Quickly looking at the timeline of our project, we began focusing on our specific topic path toward the end of April. Since then, we first dedicated time to accurately creating our dataset to train our model using the Karamba3D plugin within Grasshopper. Toward the end of May, we started moving into Python to train and deploy our model. In addition to improving our notebooks, June has included the development of our user interface.
Before examining our final model, let’s quickly review some important milestones from the early stages of our project. Initially, we spent time exploring different tiling patterns for construction methods. We discovered that these patterns not only took a significant amount of time to accurately recreate but also proved insufficient for viable load-bearing architectural elements. Consequently, we shifted our focus to more traditional wooden wall construction. This approach allowed us to quickly create numerous iterations by adjusting variables such as grid spacing, angle of members, and cross-sections. Once we began extracting data from Grasshopper, we trained our model to recreate our datasets for further predictions. Although the initial results seemed accurate, we soon realized that we did not have enough data to achieve viable results.
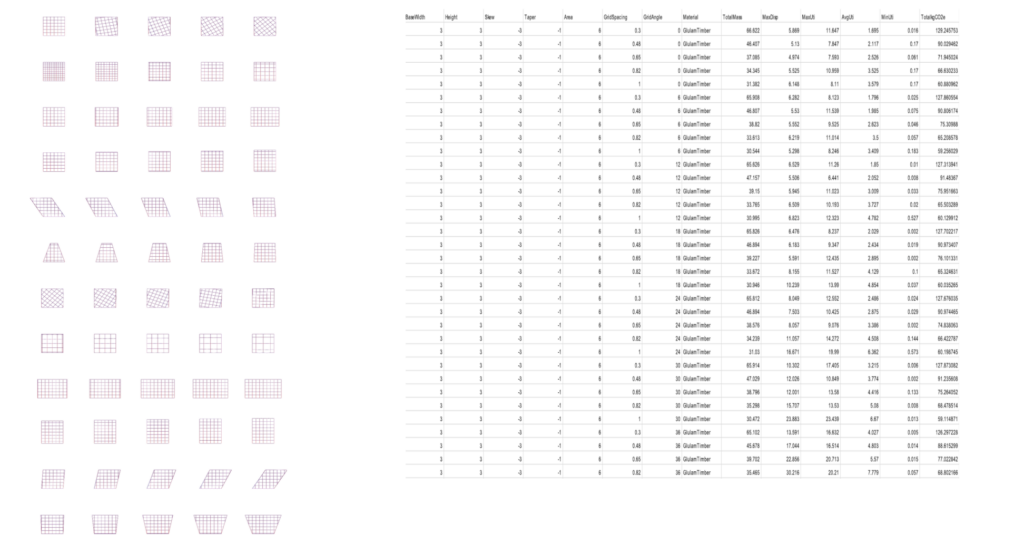
To address this issue, we returned to Grasshopper to expand our dataset. By creating over 1,500 variations of construction methods for a single 3m x 3m load-bearing wall and exporting a dozen different usable features for training, we were able to generate a dataset extensive enough for our training purposes.
And here we can see more of the expanded data set with around 7000 variations, as well as more views of some of the wall variations we created and extracted data from.
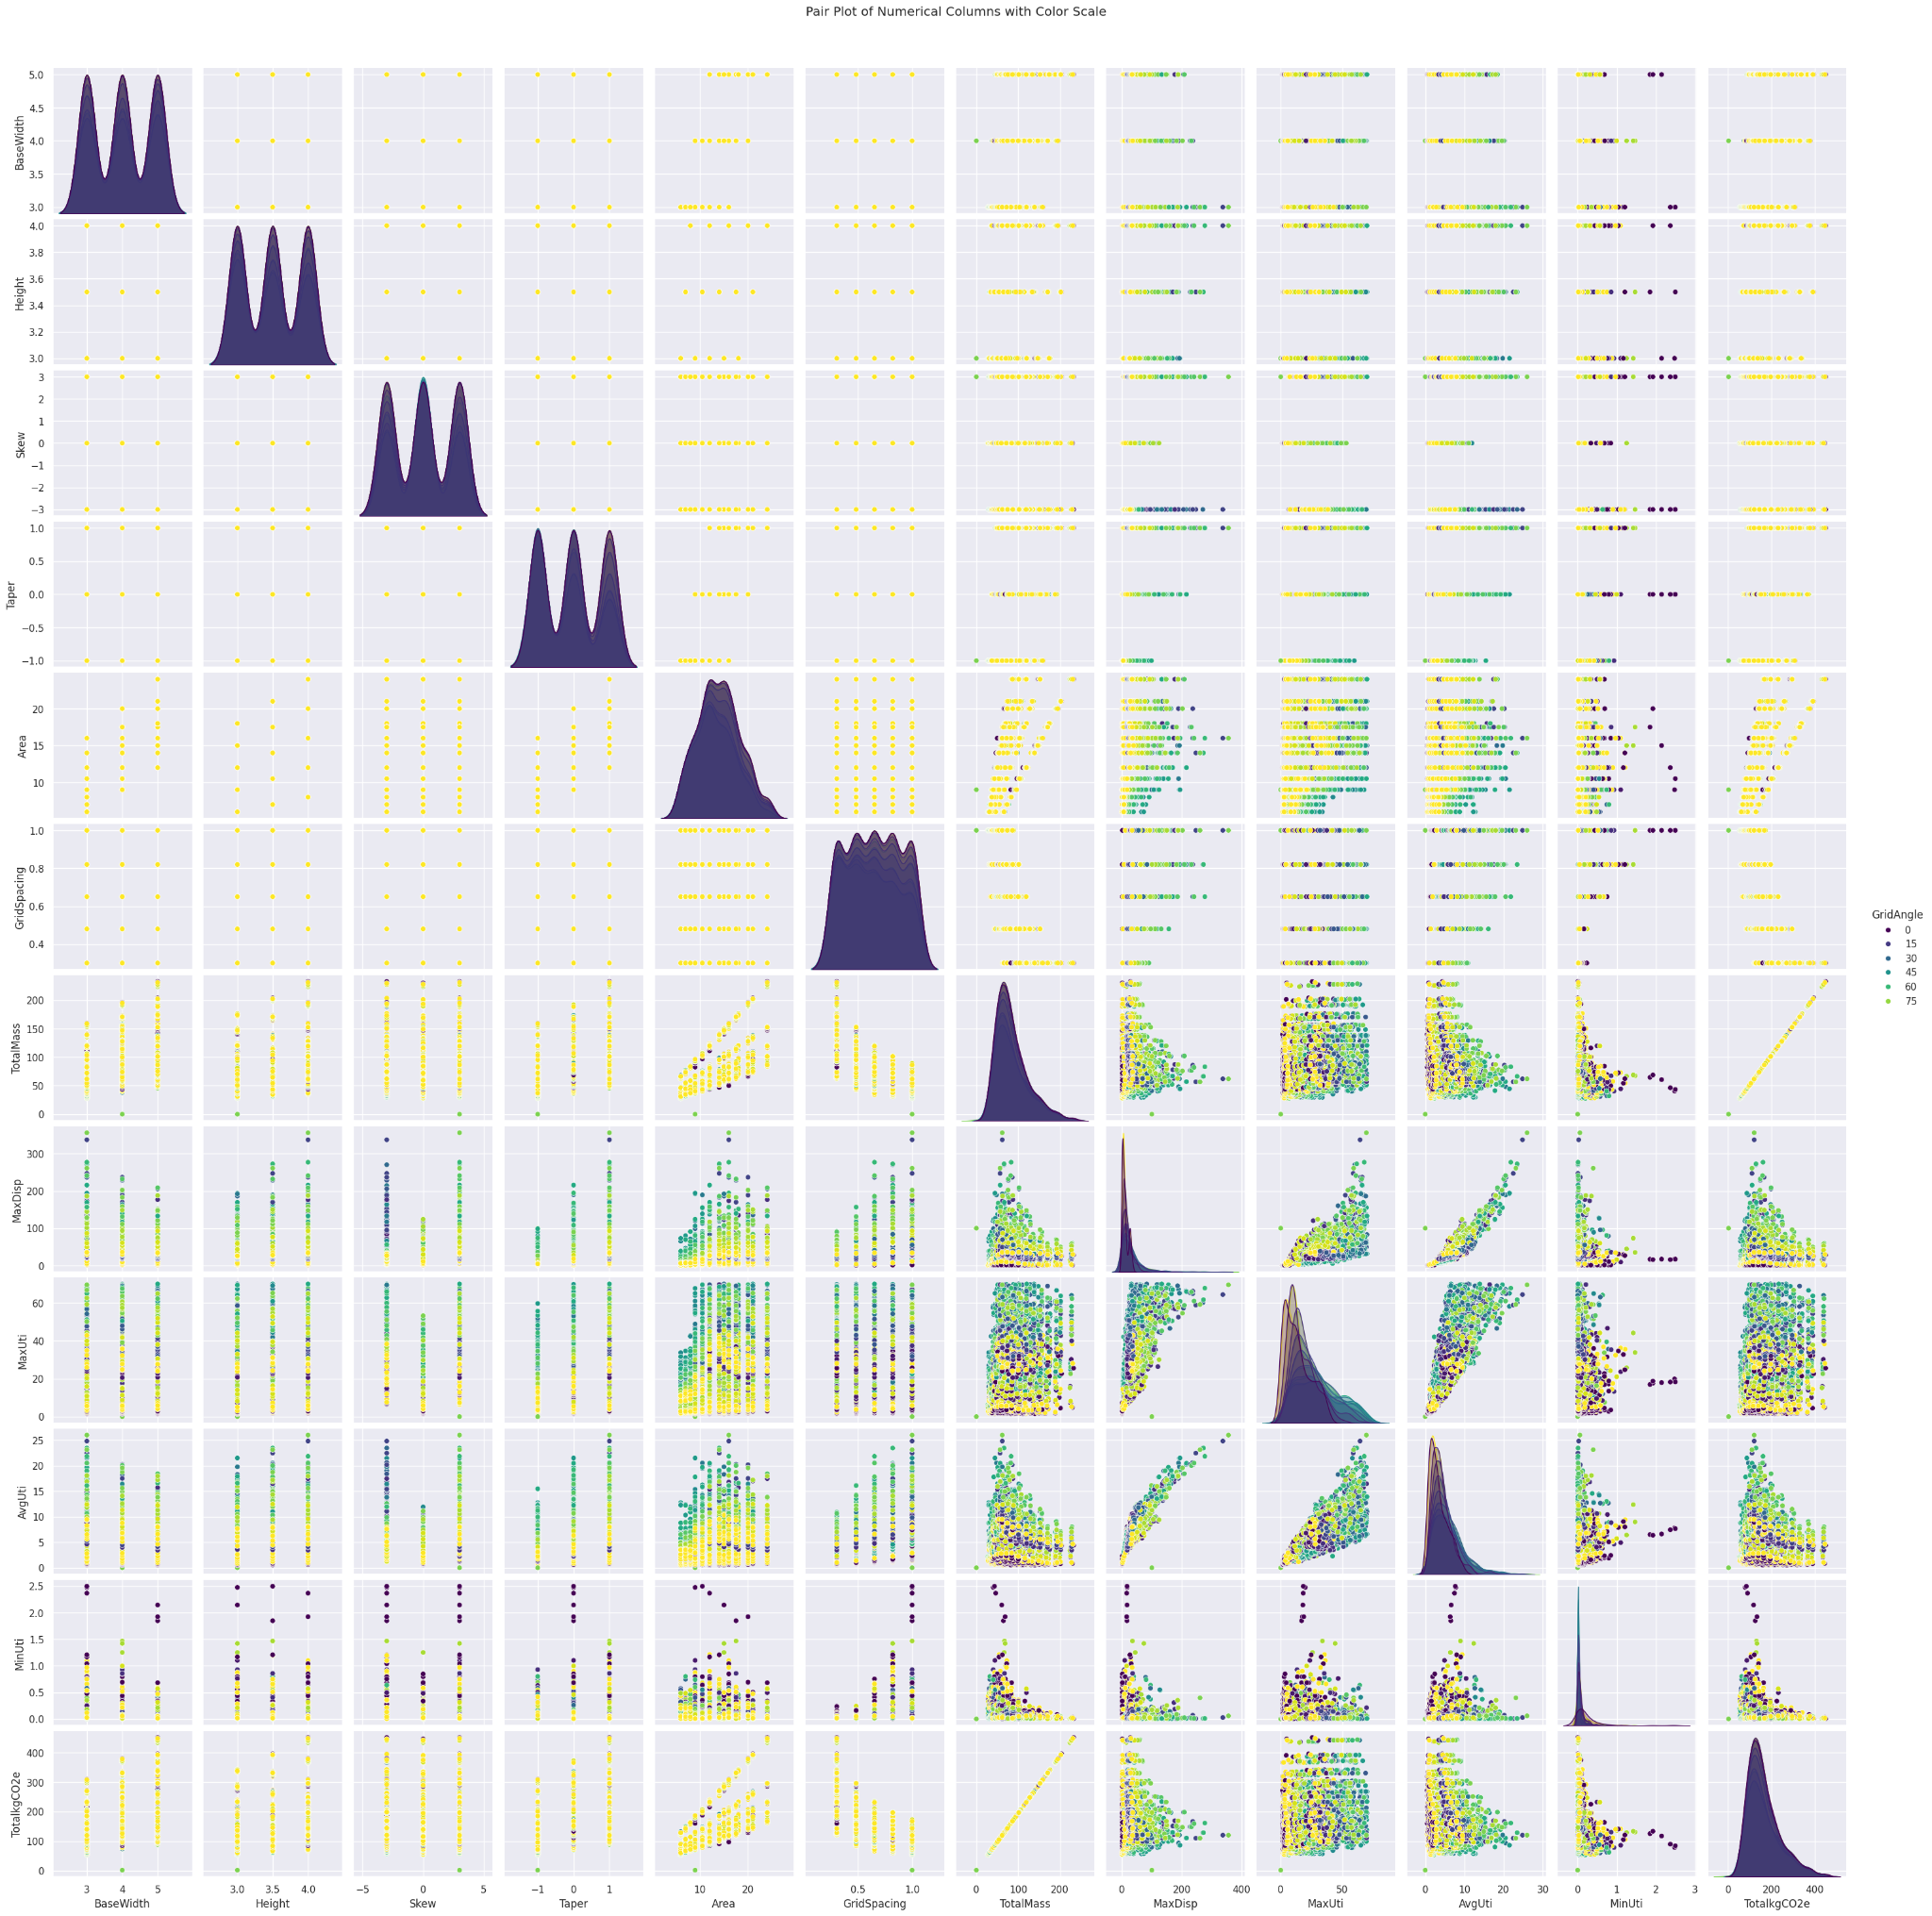
The pair plots of all the features initially showed smooth distributions due to the synthesized input data, with a few outliers indicating points at which the structure failed. These outliers were identified using interactive plots. After removing the outliers from the dataframe, the resulting plots continued to show smooth distributions, confirming the effectiveness of our data synthesis. Additionally, the pair plots are color-coded by maximum utilization, highlighting the primary feature we aim to predict.
Preliminary Testing – Grid Spacing
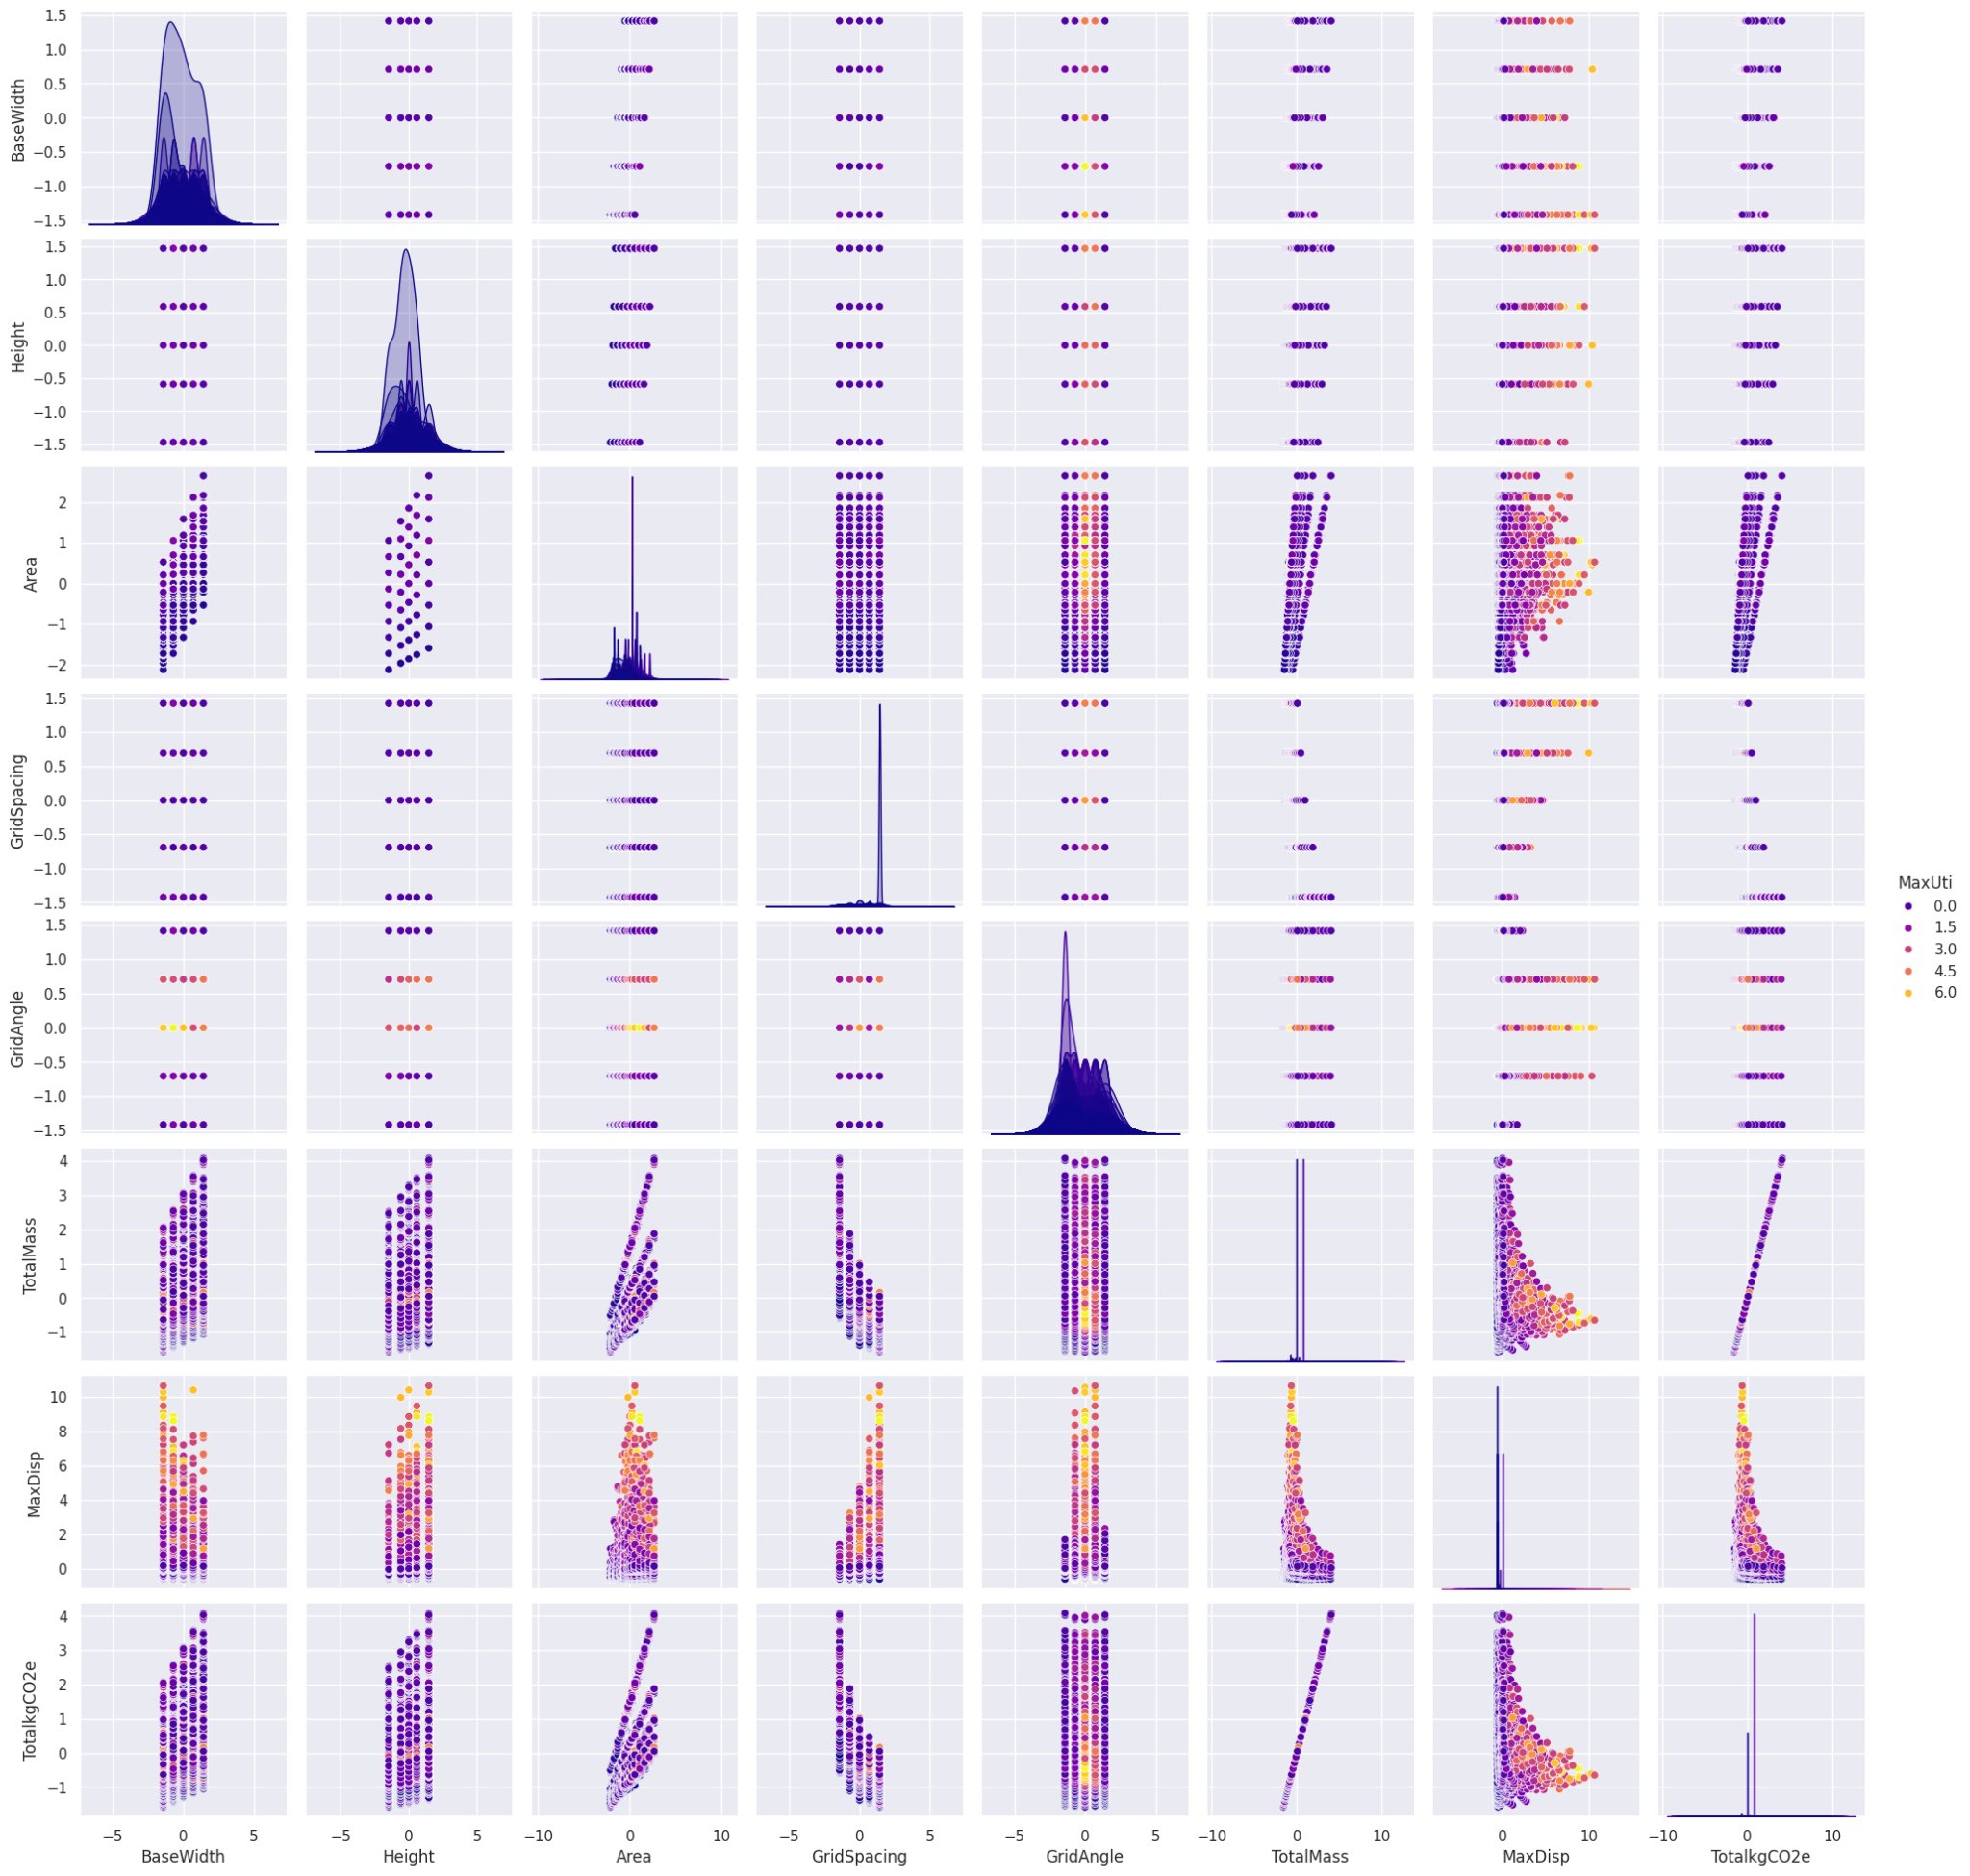
Preliminary Testing – Max Utilization
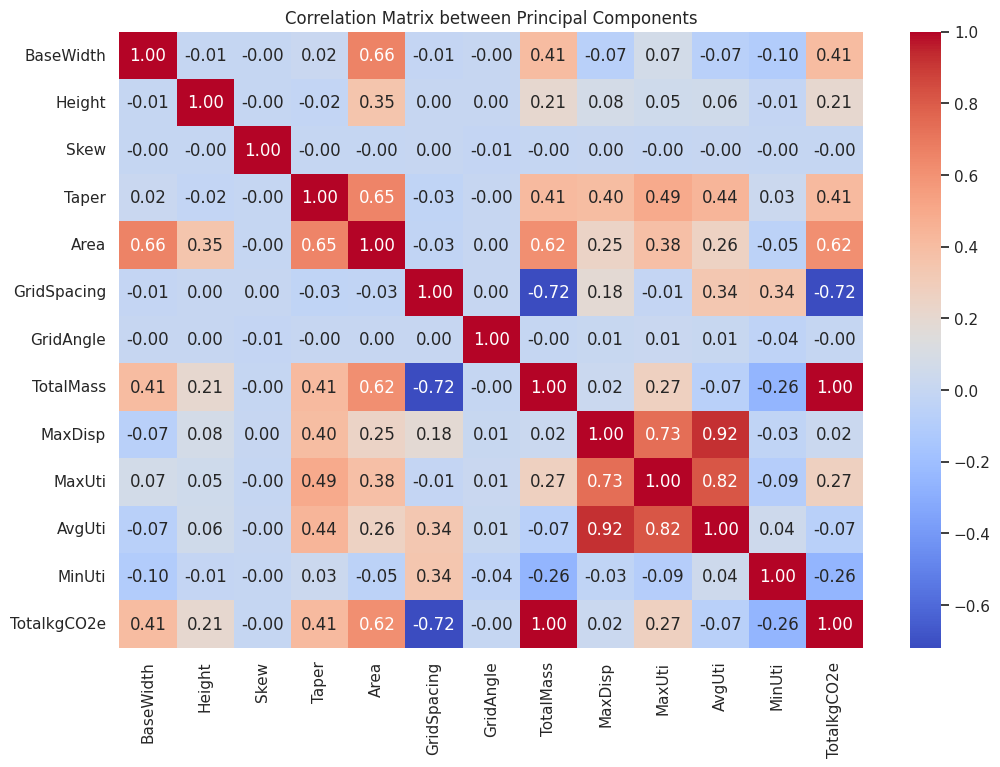
We then examined the correlation matrix of the extracted dataset features. The matrix revealed a high correlation between the structural performance features: maximum utilization, maximum displacement, and average utilization, which was expected. However, the correlation between maximum utilization and geometric features was not very high. Consequently, we decided to retain all features to enhance the model’s learning.
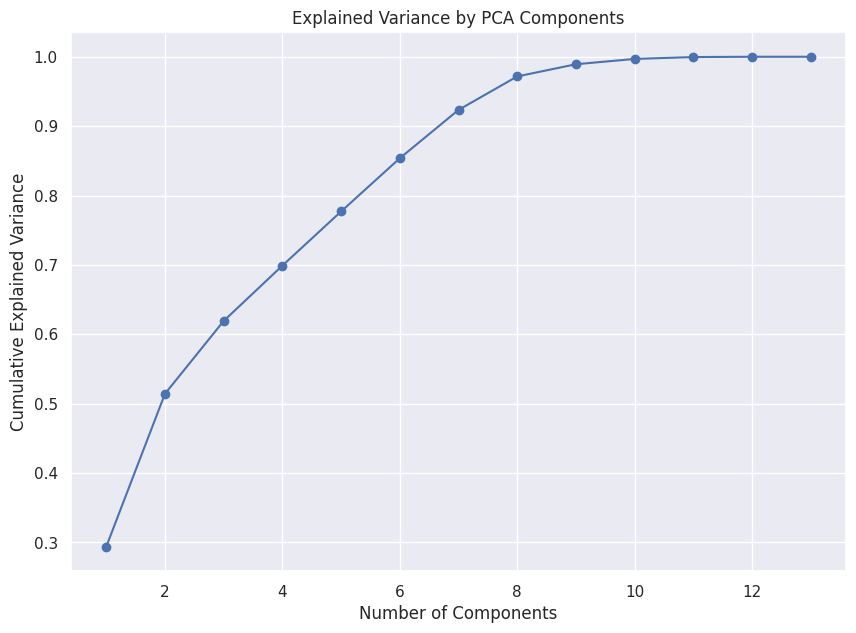
And the PCA plot shows that we can do with 10 features for adequate learning .
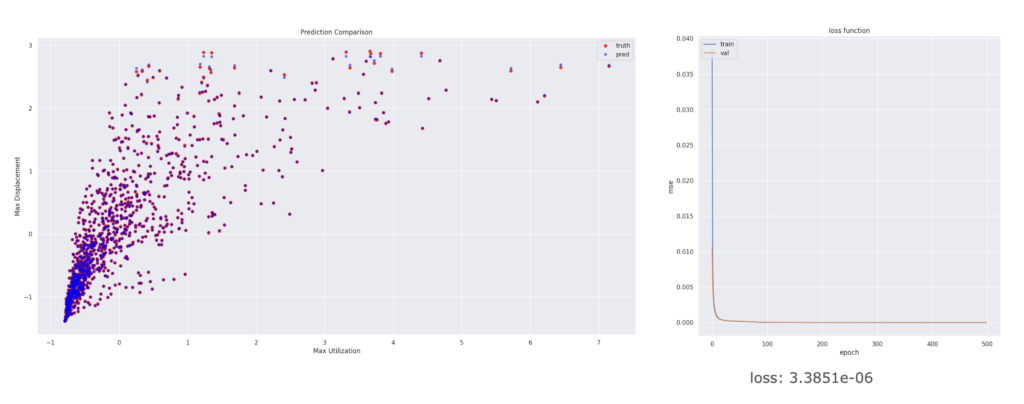
We chose to use an ANN regression model due to the large number of features and the complex relationships between them. The neural network was deep, with the number of features kept at roughly one-tenth of the data volume. The predictions closely matched the training data, as evidenced by the loss function and prediction comparison plot.
For the user experience, the user would input the geometry of a specific wall element as an outline curve. The script will decode this geometry into the features used in the ML model, and these features will be input into the exported model to make predictions. The script will include several models to predict different features, with a drop-down menu allowing the user to select the desired feature to predict. Based on the prediction results, the user can then choose the most suitable material.