ACESD Theory

Embodied Carbon Factors
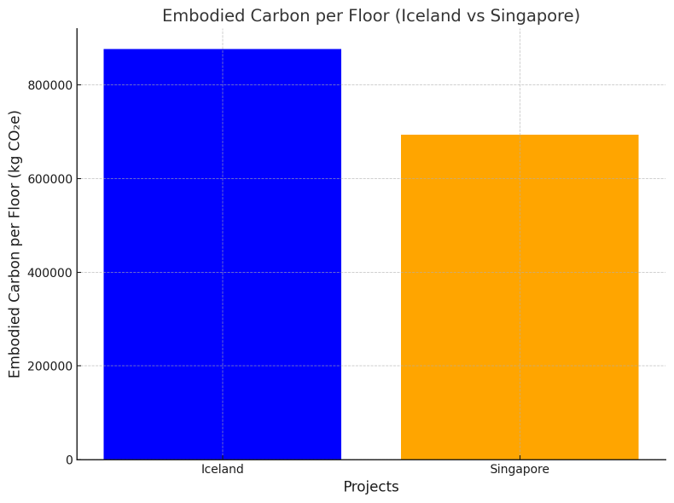
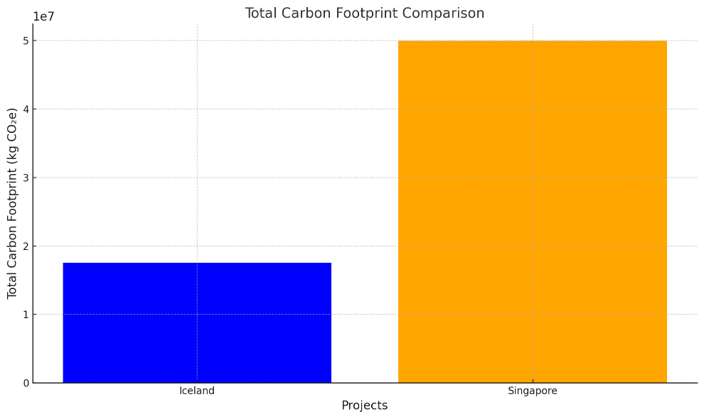

Total Carbon Footprints (per location and total towers):
•Iceland: 17,539,260 kg CO₂e – One tower
•Singapore: 49,958,698 kg CO₂e – Two towers
By Material
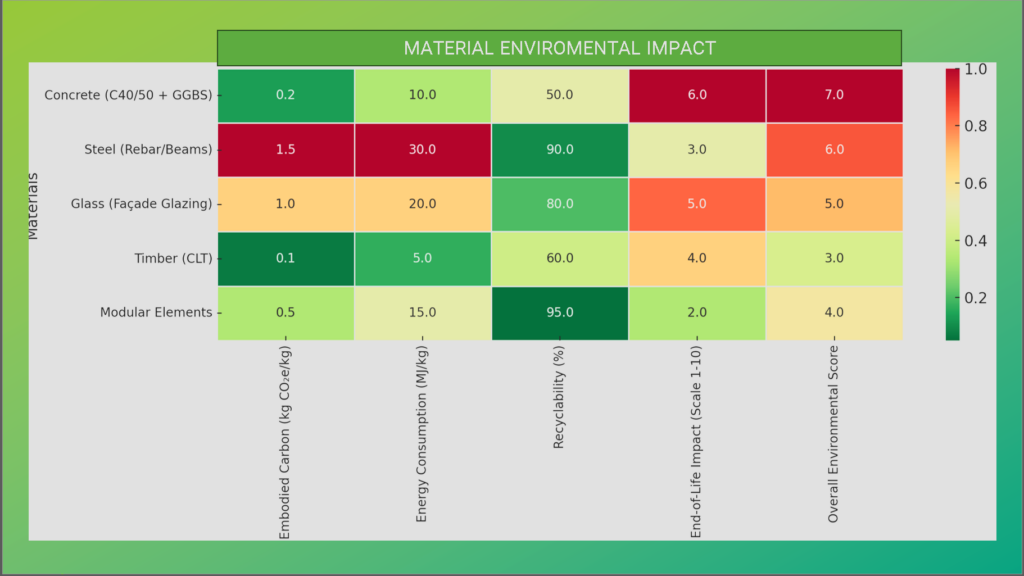
Concrete: Dominates the emissions for both locations due to its extensive use in slabs, beams, and columns.
Steel: Contributes significantly, particularly in Singapore, where the higher number of floors increases structural steel requirements.
Glass: Emissions are proportional to the window area, with Singapore’s larger number of windows amplifying its footprint.
By location
Iceland: Lower total emissions due to fewer floors and optimized material use.
Singapore: Higher total emissions reflecting the doubled floor count and larger structural and façade material volumes.
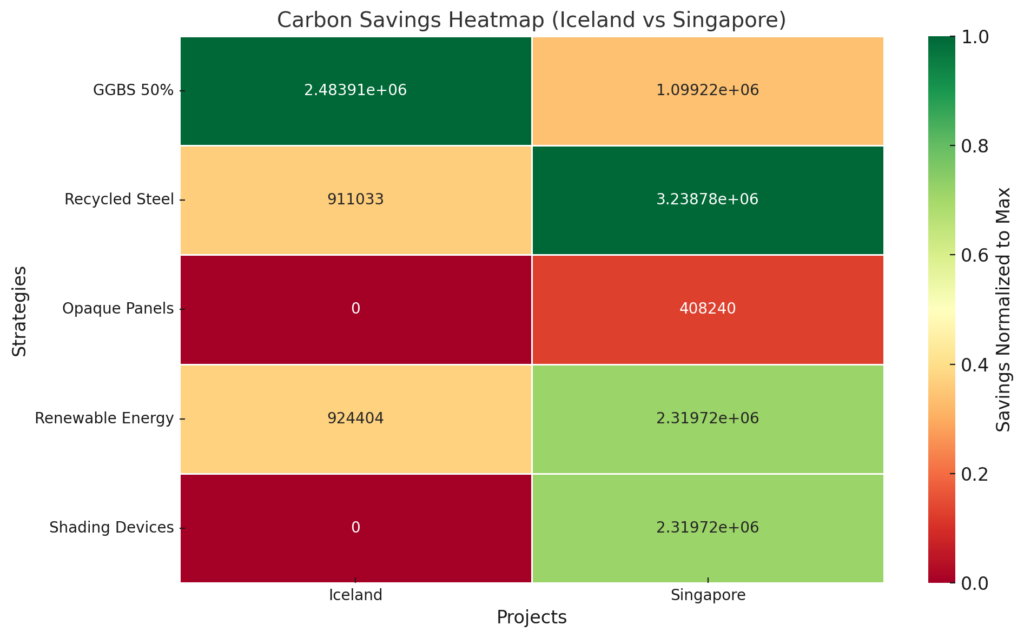
Optimization Strategies:
•Switching to low-carbon concrete with higher GGBS content can reduce the embodied carbon significantly, saving up to 30%.
•Minimizing the glass area reduces cooling demands in a hot climate.
•Using recycled steel in structural components provides additional savings.
Operational Carbon Reduction Possibilities:
•Optimize window-to-wall ratio:
•Reduce north-facing glazing to minimize heat loss while maintaining solar gains.
•Incorporate smart building systems:
•Install sensors to monitor energy use and adjust heating and lighting automatically.

Material
•Concrete (C40/50 with 25%-50% GGBS)
•Raw Material Extraction:
•Cement: High emissions from limestone calcination (CO₂ release).
•GGBS: Low impact as it’s a by-product of steel production.
•Production:
•Cement: High energy intensity in kilns (90% of concrete emissions).
•GGBS: Minimal emissions due to reuse of industrial by-product.
•Logistics:
•Transporting aggregates and cement to batching plants is carbon-intensive (~0.02–0.03 kg CO₂e/ton-km).
•Local sourcing can reduce transport emissions significantly.
•Construction:
•Mixing and pouring are energy-light but generate some waste (~2–5% of materials).
•End-of-Life:
•Partial recycling as crushed aggregates (~30–50%).
Optimization:
•Increase GGBS to 50%.
•Source aggregates locally to minimize transport emissions.
•Steel (Rebar and Beams)
•Raw Material Extraction:
•Iron ore mining and processing: High environmental impact, energy-intensive.
•Production:
•Virgin Steel: ~1.8–2.5 kg CO₂e/kg from blast furnaces.
•Recycled Steel: ~0.7–1.2 kg CO₂e/kg from electric arc furnaces.
•Logistics:
•Imported steel: Significant carbon footprint (~0.05 kg CO₂e/ton-km for shipping).
•Construction:
•On-site cutting and welding can produce waste (~5% material loss).
•End-of-Life:
•High recyclability (~90–95% can be reused or recycled).
•Optimization:
•Maximize recycled steel content (>50%).
•Design for disassembly to improve reuse potential.
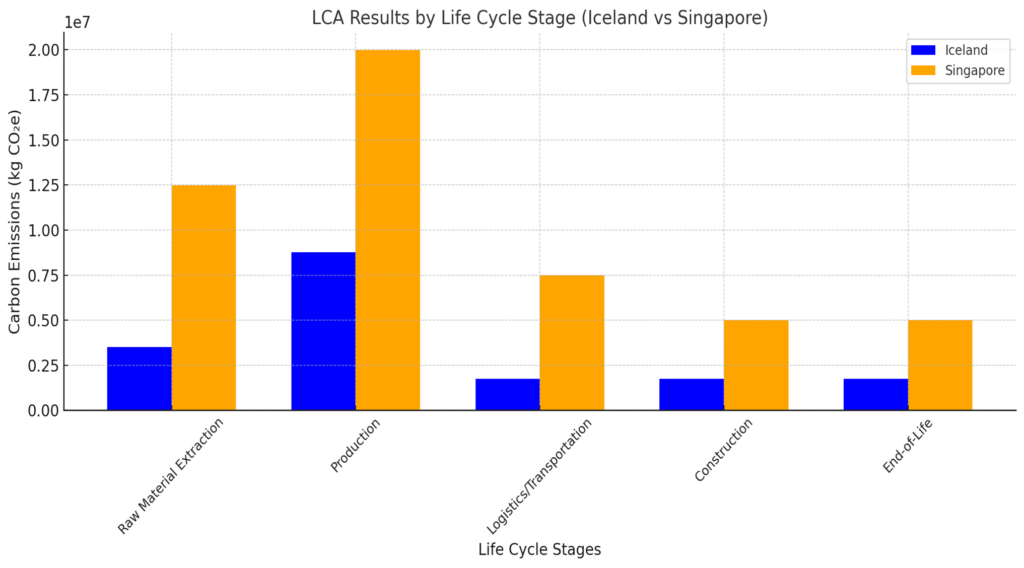
•Singapore has significantly higher emissions in raw material extraction and logistics, reflecting the impact of centralized production and transportation over long distances.
•Iceland benefits from local sourcing and reduced logistics emissions
Reflections
1. LCA (Life Cycle Assessment)
LCA has deepened my understanding of the importance of evaluating environmental impacts across the entire lifecycle of architectural products and processes. This comprehensive approach empowers me to anticipate and mitigate unintended consequences, enabling more informed and sustainable design decisions.
2. Materials
By incorporating environmental assessments early in the design process, I’ve learned to harmonize technical performance with ecological responsibility. Exploring innovative materials like biopolymers and 3D-printed concrete has emphasized the significance of embedding environmental consciousness into architectural practices.
3. Energy
My exploration of energy systems revealed its intricate interplay with social, technological, and environmental frameworks. This perspective reshaped my understanding of how innovations can drive sustainable energy solutions while reducing dependence on finite resources.
4. Geographies of Production
Understanding how geographies of production influence environmental outcomes has been transformative. I realized that decentralized production models can dramatically lower transportation-related emissions, presenting a critical pathway for more sustainable workflows.
5. Transportation
Designing with locally sourced materials has highlighted both the environmental benefits and the challenges of scalability. This approach encourages innovation in urban contexts while reducing transportation emissions, aligning with sustainable design goals.
6. Reuse
Integrating sustainable workflows with technological advancements has unlocked new opportunities in coproduct design. This process demonstrated how circular practices can reshape architectural processes, fostering both environmental and economic benefits.
During this exercise deviated from the original material plan and expanded based on assumptions of possible material improvements, such as Aluminum and Timber where additions to the original project to find lower number for the Environmental impact, not all scenarios provided positive results.
References and Resources
General Life Cycle Assessment (LCA) Framework
1.ISO 14040/14044 Standards: Life Cycle Assessment Principles and Framework.
1.Provides guidelines for conducting LCAs, including system boundaries and stages.
2.ISO 14040 Overview
2.Ecoinvent Database: Comprehensive LCA database for material-specific embodied carbon values and processes.Ecoinvent Database
Material Embodied Carbon and Energy Data
1.Concrete (C40/50, with GGBS):
1.Typical embodied carbon for standard concrete: 0.15–0.20 kg CO₂e/kg.
2.Source: Inventory of Carbon and Energy (ICE) Database, University of Bath (2020).
1.ICE Database
2.Steel (Reinforcing and Structural):
1.Virgin steel: 1.8–2.5 kg CO₂e/kg; recycled steel: 0.7–1.2 kg CO₂e/kg.
2.Source: World Steel Association’s Lifecycle Inventory Data for Steel Products (2019).
3.Glass (Triple-Pane and Double-Pane):
1.Embodied carbon: ~10–20 kg CO₂e/m² depending on type and coatings.
2.Source: Glass for Europe Environmental Product Declaration (EPD).
4.Timber (CLT):
1.CLT is considered carbon-negative due to sequestration; emissions depend on processing (~0.1–0.5 kg CO₂e/kg).
2.Source: WoodWorks Carbon Calculator and PEFC Certification Reports.
5.Opaque Façade Materials:
1.Aluminum: ~8–10 kg CO₂e/kg; composites vary (~4–8 kg CO₂e/kg).
2.Source: European Aluminum Association EPD for Façade Products.Aluminum EPD
Logistics and Transportation Data
1.Transportation Emissions:
1.Road transport: ~0.04–0.06 kg CO₂e/ton-km.
2.Sea freight: ~0.01–0.05 kg CO₂e/ton-km.
3.Source: DEFRA UK Government Conversion Factors for Greenhouse Gas Reporting.
1.DEFRA GHG Reporting
2.Impact of Local Sourcing:
1.Source: International Transport Forum (ITF) Report on Material Transportation and Emissions (2021).ITF Material Report
LCA Methodologies and Regional Adjustments
1.Building Design and Embodied Energy:
1.Source: RIBA Sustainable Outcomes Guide (2020).
1.RIBA Guide
2.Regional Energy Grids and Emissions:
1.Iceland: Dominated by renewable geothermal and hydroelectric power (~0.02 kg CO₂e/kWh).
2.Singapore: Grid factor ~0.4 kg CO₂e/kWh.
3.Source: IEA Global Energy Data (2022).IEA Energy Database

