The MaCT01 students were tasked with training a model that would be used to predict NYC yellow taxi ride durations using machine learning. The dataset included pickup and drop-off datetimes, location coordinates and passenger count.
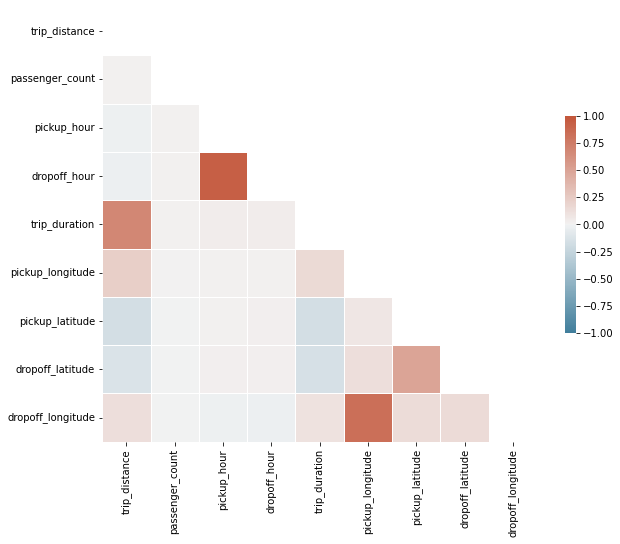
Visualizing the data helped to understand the correlation between the columns and remove the highly correlated values
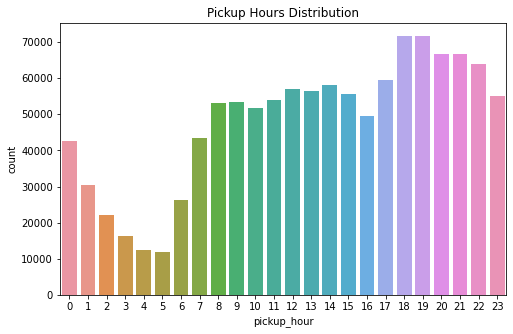
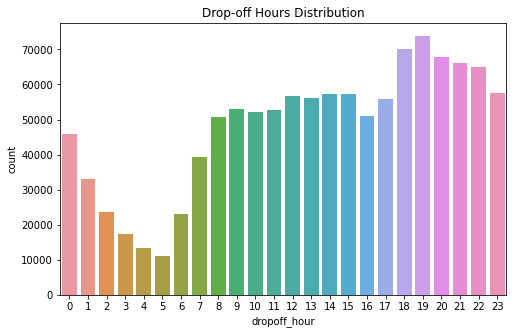
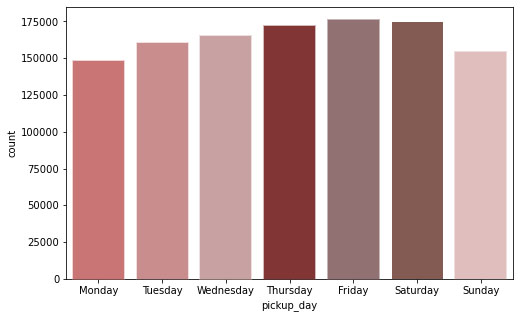
Understanding the distribution of trips during the week