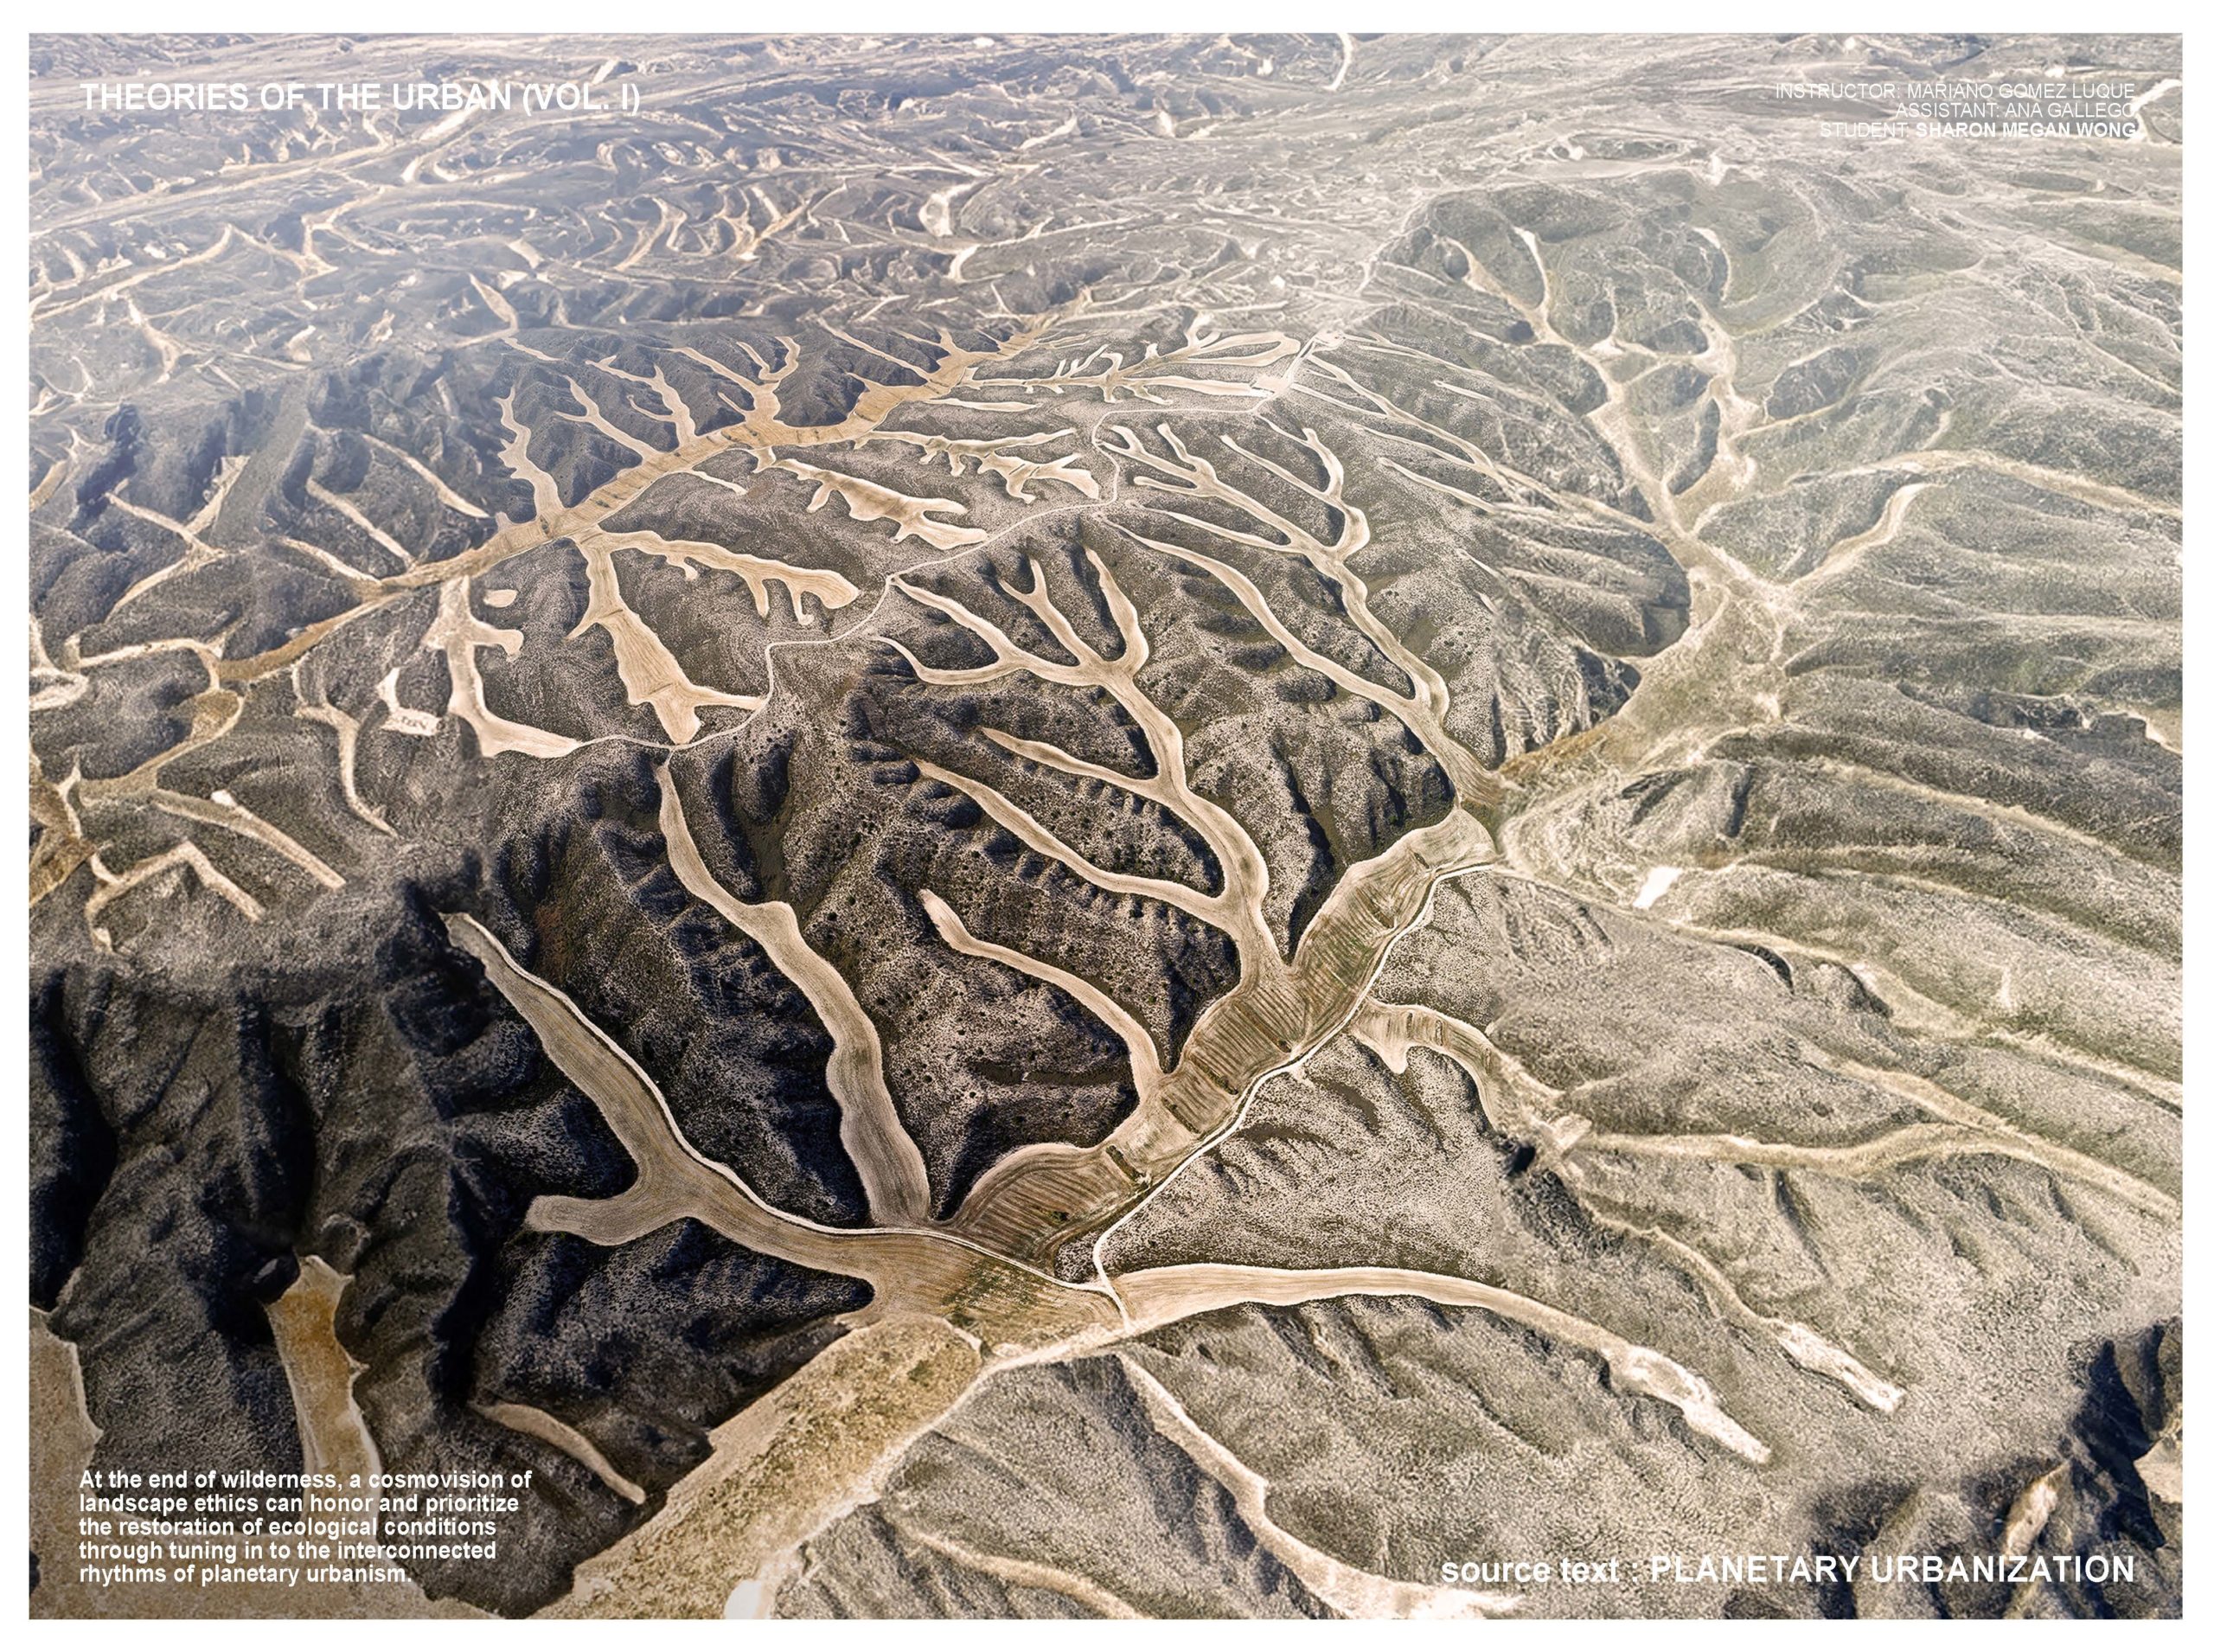
The Arteries of Lombardy
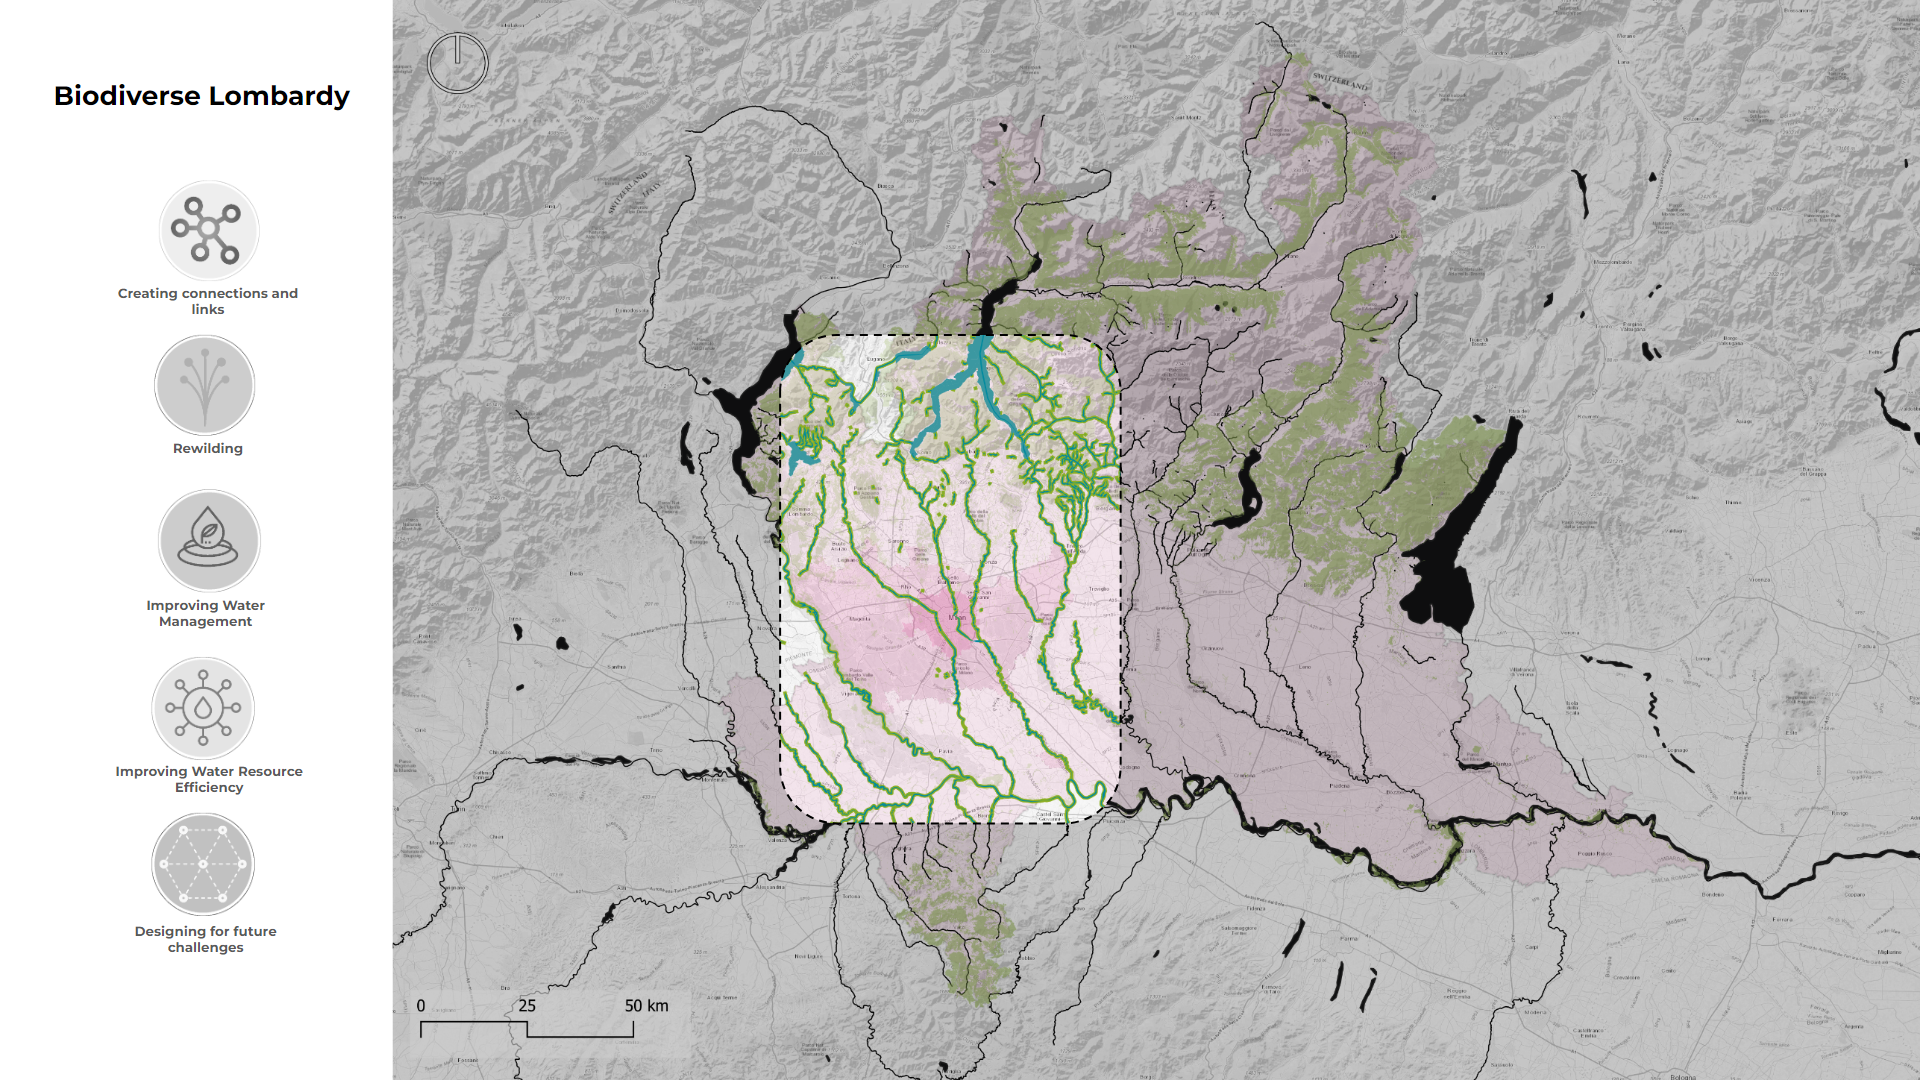
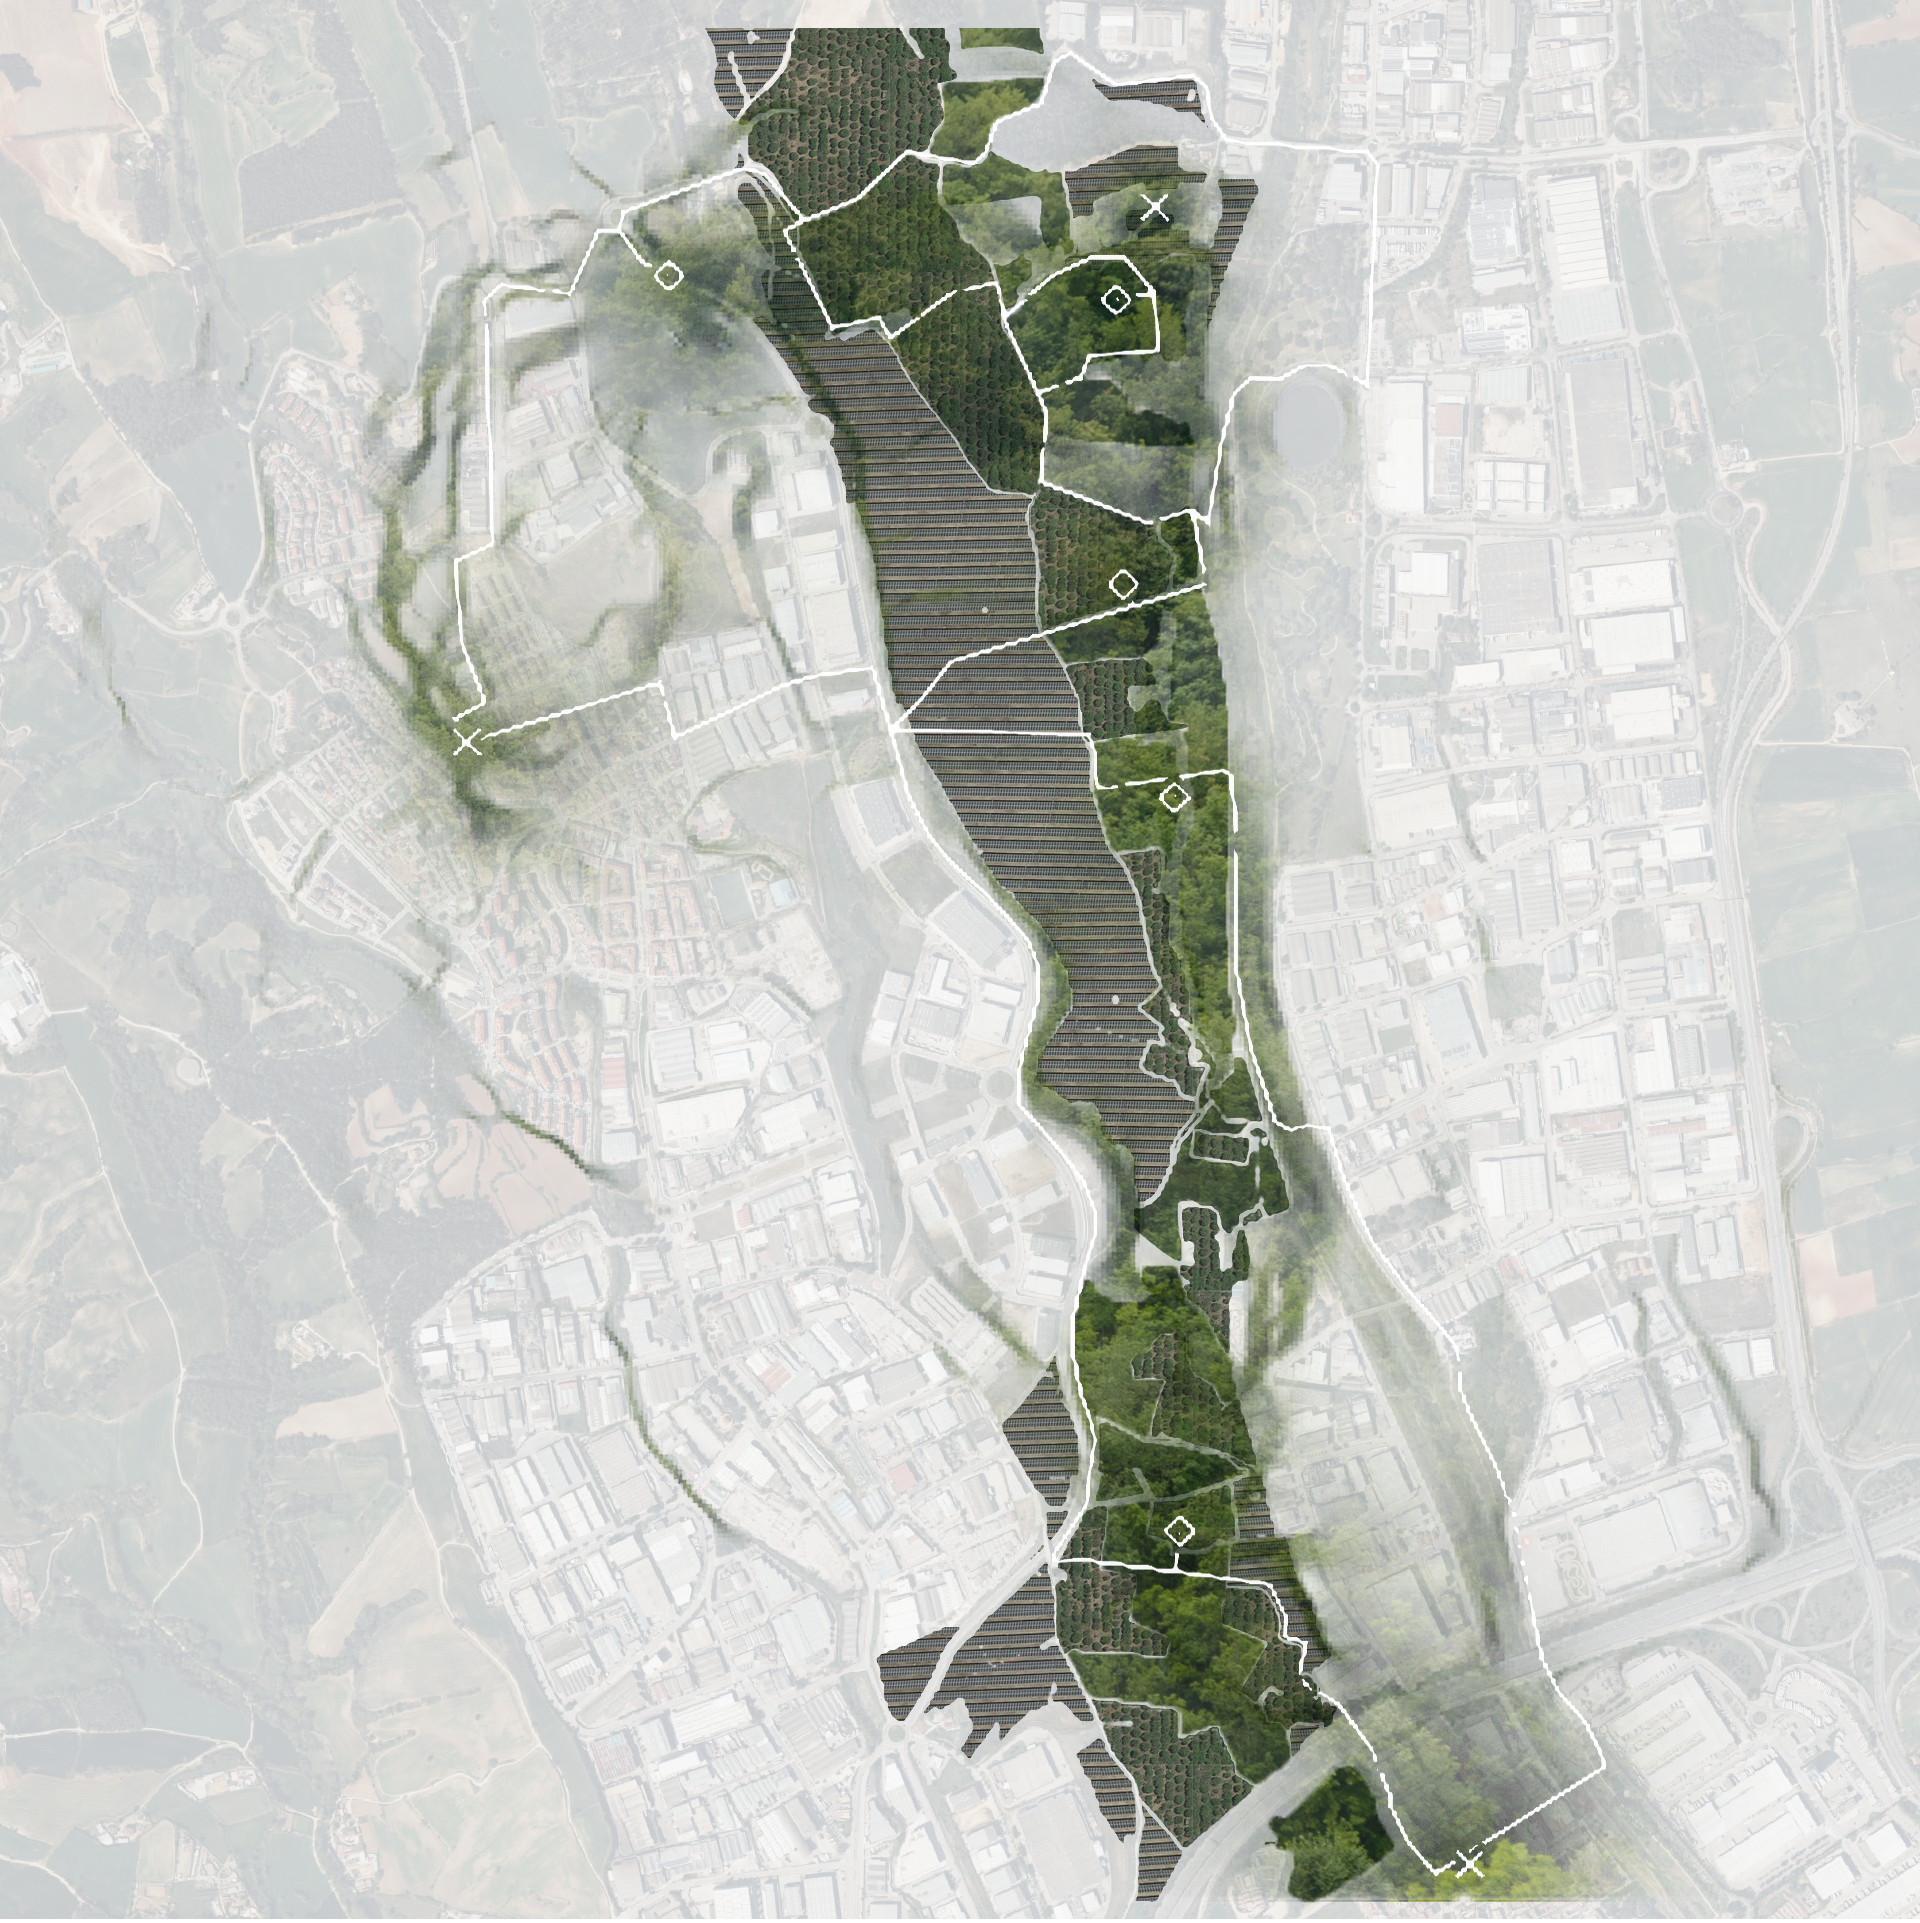
Introduction In the past centuries, Milan used to be perceived as a water-city, with an economy propelled by canals that extended throughout it. However, as the city evolved, those waterways were gradually buried beneath roads, and the aquatic arteries that once defined Milan are now relegated to the periphery of the urban fabric. This covering … Read more