
Introduction
Known for its fashion, history, and culture, Milan also faces a pressing environmental issue: it stands as one of the most polluted cities in the World. The challenge of mitigating air pollution in Milan is complex, as it is shaped by a mix of geographical, meteorological, socio-economic, and cultural factors. From the city’s dense population and heavy reliance on motor vehicles to its industrial activities and the intricate process of policy implementation, each aspect plays a pivotal role in the city’s air quality. In this post, we will tackle the multifaceted nature of Milan’s pollution problem and explore the solution our studio project proposes to breathe new life into this iconic city.
Local focus: from the wider region to a localized area
Firstly, we analyzed wind and pollution movements at a larger scale. This analysis showed that pollution from all the region travels to the Milan area and stays there. The Milan area registers little wind movement, thus PM particles coming from the surrounding region “fall down” on Milan. This little wind movement is precisely one of the reasons why Milan is an ideal place for having airports.
Continuing our exploration, we narrowed our focus to a more manageable scale to harness the power of computational analysis effectively and streamline our approach. The spotlight turned to the neighboring municipalities of ‘Segrate’ and ‘Peschiera Borromeo,’ situated near the Linate Airport. This strategic selection wasn’t just about convenience; it was a calculated decision driven by several compelling reasons. Firstly, zooming in on a smaller area allowed for a more detailed and intricate computational study. We aimed to understand the unique geographical features of these areas and how they influence air movement and quality, providing insights that are often lost in broader studies. Notably, these municipalities share many characteristics with the Greater Metropolitan Area of Milan, making them an excellent proxy for testing our air quality improvement strategies. Our ultimate goal? To develop solutions that can be scaled and adapted to enhance air quality across the wider Milanese landscape.
Pollution sources in selected area
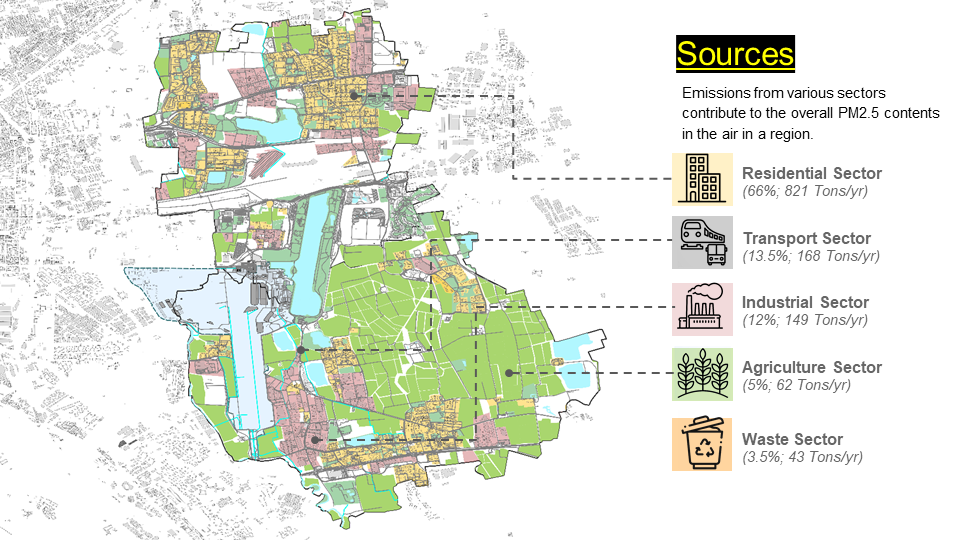
Firstly, we tried to identify all the pollution sources, focusing on PM2.5 particles. We modeled traffic information for the selected area, using data from TomTom Driving Patterns methodology adapted to the Milan metropolitan area. Estimates calculated for average traffic flows of 37,500 vehicles driving an average of 70 km in the selected area. We then proceeded to estimate yearly pollution using the EU Climate Neutral Cities methodology for the Buildings, Waste, industrial and Agricultural sectors for the selected area. This gave us an overview of where pollution is coming from, but also made us realize that we have to change our approach, and analyze the area even further to be able to conceptualize a possible solution.
Factors for Comfort and Health
We then proceeded to look at factors that can affect wind movement on a micro scale but also factors that affect the comfort and health of citizens. Understanding these factors was crucial for developing a holistic solution that addresses not just pollution but also the overall comfort and health of the community. Vegetation plays a pivotal role; selecting appropriate greenery for the varied street canyons of the area can significantly enhance the filtration of airborne pollutants. For example, tall trees in narrower streets act like natural filters, trapping pollutants more effectively.
However, the success of these green barriers is largely dependent on wind patterns. The direction and speed of the wind influences how well pollutants are filtered through the vegetation. When the wind blows perpendicular to these green barriers, we see the highest levels of filtration. Additionally, we considered the effect of surface temperatures, which can scatter air particles and redistribute pollutants, and the impact of seasons, particularly how the leaf-shedding cycle of certain trees affects their ability to purify the air. By analyzing these details, we were able to identify problematic areas and corridors that have high surface temperatures and little vegetation.
Movement clusters and final intervention areas
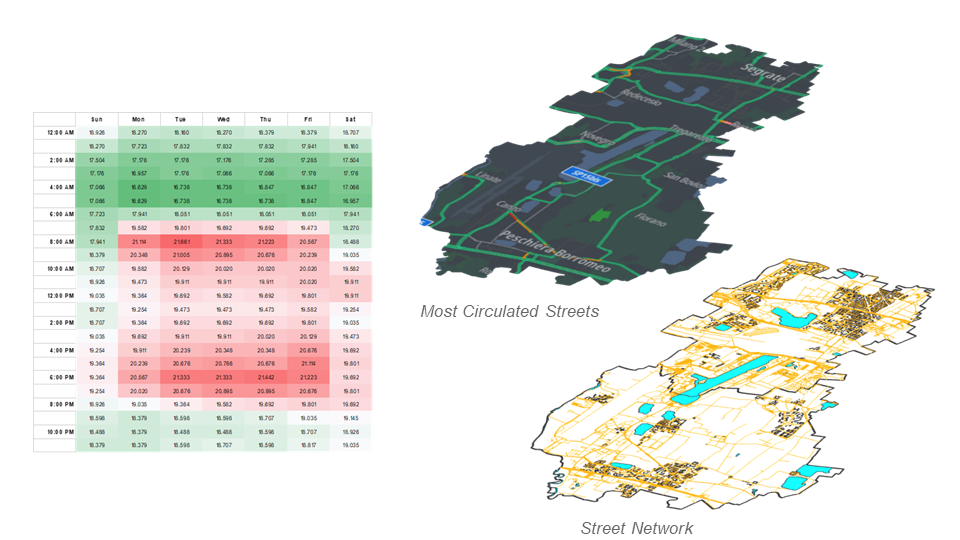
We further proceeded to analyze the possible movement of people in our selected area. For this we ran a Space Syntax analysis on our selected area. This highly computational analysis on the entire street network revealed areas of high integration, meaning areas that are well connected and that can easily be accessed in the network, but also areas of low choice, meaning areas that are not chosen for travel using the shortest path. By corelating high integration with low choice areas, we identified areas that have development potential. And by corelating these high potential areas with low vegetation and high surface temperature areas, we finally were able to identify specific micro areas where interventions would make the most sense.
Solution approach
The approach we took was to conceptualize a solution that could be used by citizens and public authorities to figure out ways to tackle the air pollution challenge together. The first part was to analyze existing solutions for air quality improvement that are available and then decide which of those solutions could be digitized or utilized in an app.
GreenScape – Milan
Our solution consists of a social app that is meant to give citizens an idea of how a space would change if air improvement measures were implemented. The solution would function as a social picture sharing app where citizens could log in with their social media accounts, take pictures of an existing space, set different parameters, visualize how that space would change with those parameters and shre the final image in the app or on their social network to get public support for that idea.
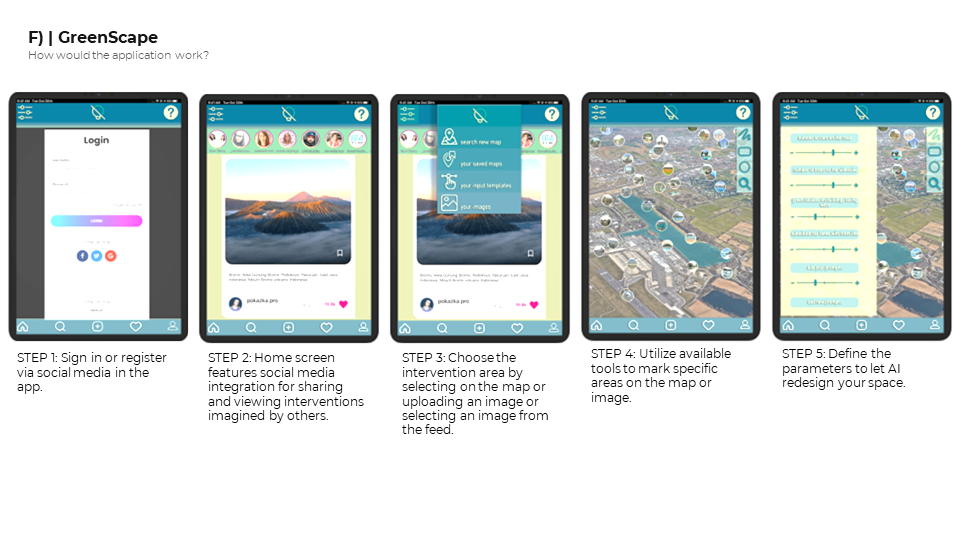
How does it work?
The parameters that a user can change are the following:
- number of trees and green space: this will increase or decrease the number of trees or green space, while also cutting in the surrounding structures like concrete. For example, if more trees are selected, the result image will add more trees in that space but will cut out other elements such as parking lots, sidewalks, and others.
- Number of cars: if users decrease the number of cars, the app will remove all elements associated with cars, and decrease the number of cars. This function is meant to make users realize that cleaner air implies they will have to give something up.
- Cycling lanes: users can opt for more cycling lanes or not. Again, increasing the cycling lanes parameter will add more cycling lanes, but will cut out the sidewalks or even part of the roads.
- EV charging stations: adding EV charging stations will add the physical stations in that space but will take out other stuff.
- Solar panels on buildings: this function can help users better understand how solar panels could look in that space.
- Green facades: adding more green facades to buildings would make the whole area greener.
In essence, the app has predefined prompts for each parameter. Changing the parameters, slightly changes each individual prompt and the overall master prompt composed of all the individual prompts. When the user takes a picture, the AI, identifies the urban elements in that picture, and feeds that picture with the master prompt in an AI engine to generate the new picture. This allows for ease of use and rapid prototyping of tailor-made solutions for spaces. Users can also take screen shots from google earth street view and use those images to generate new images.
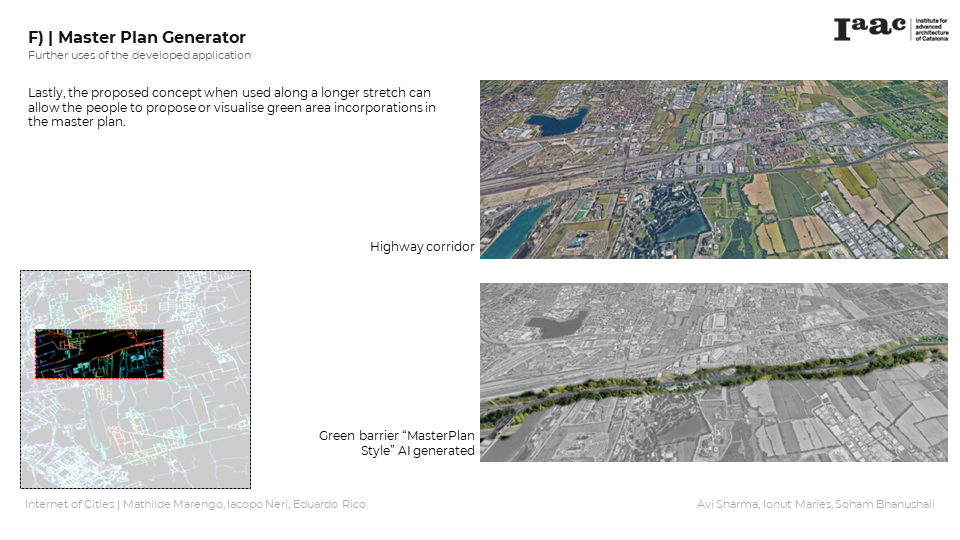
The app would also have a MasterPlan functionality that would allow for AI generated Masterplans for mitigating air pollution. A travel functionality could also be added that would allow users to simulate how they could travel from point A to point B in the old and new master plans.
The app would also have a MasterPlan functionality that would allow for AI generated Masterplans for mitigating air pollution. A travel functionality could also be added that would allow users to simulate how they could travel from point A to point B in the old and new master plans.
Conclusion
In conclusion, this app would allow citizens to better understand what they would have to give up for better air quality, would also allow them to generate ideas quickly and easily for better spaces that could be sent to city hall representatives. In the same time, city hall representatives could utilize this app to find out new ideas for the sustainable development of public spaces. All in all, the app could act as a catalyzer for new ideas and public engagement.
